Tier 2 Zonal Mean Profiles CMIP6
CMIP6 Multi-Model Mean Context
Comparison with CMIP6 conventional-resolution ensemble mean (up to 8 models under SSP3-7.0, regridded to 0.25°).
Synthesis
Related diagnostics
Zonal Mean 2m Temperature Change
| Variables | avg_2t |
|---|---|
| Models | ifs-fesom, ifs-nemo |
| Units | K |
| Baseline | 1990-2014 |
| Future | 2040-2049 |
| Method | 5° latitude bins on HealPix cells; equal-area mean per band. |
Summary high
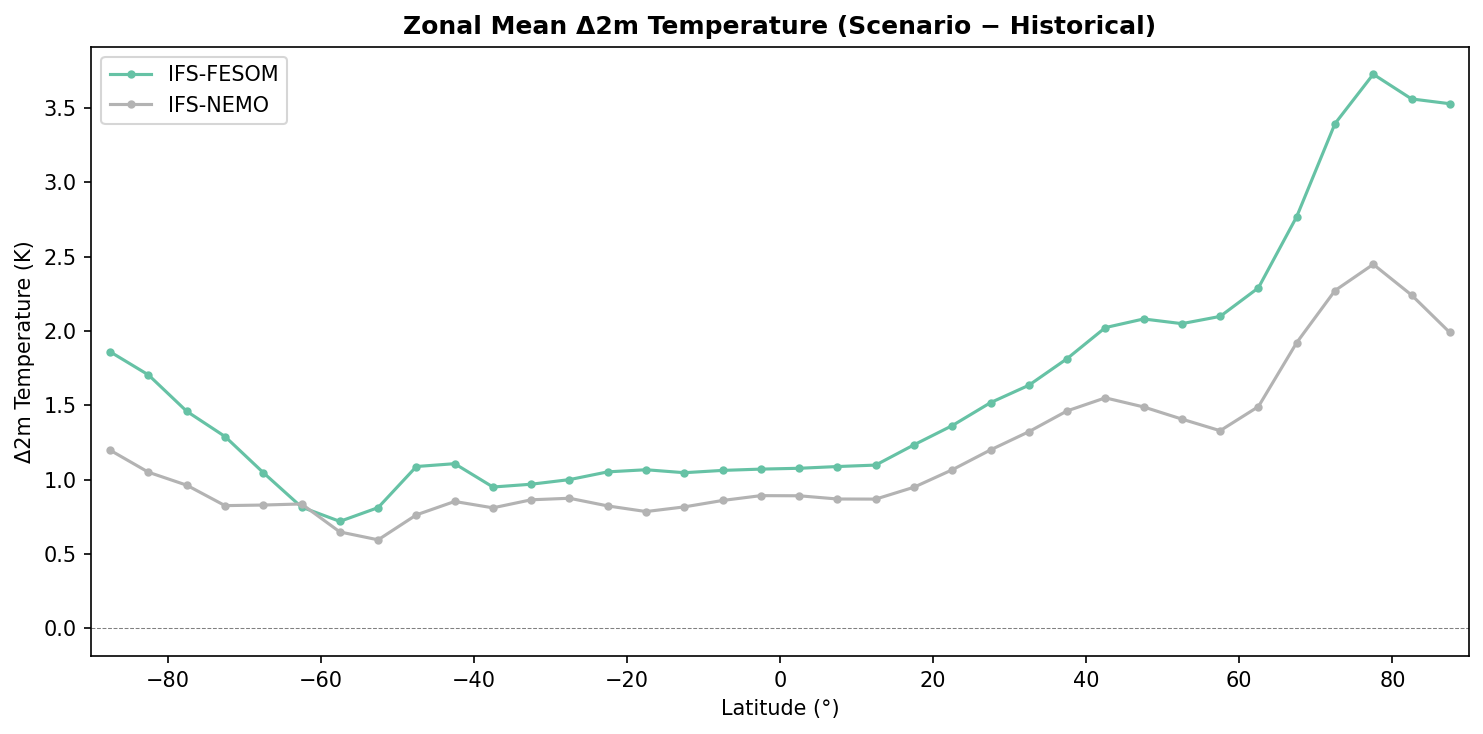
The figure illustrates zonal mean 2m temperature change (2040–2049 vs. 1990–2014), showing that IFS-FESOM closely tracks the CMIP6 median warming while IFS-NEMO consistently aligns with the lower bound (P5) of the CMIP6 envelope.
Key Findings
- IFS-FESOM exhibits robust Arctic amplification (reaching ~3.7 K), tracking slightly above the CMIP6 median in the Northern Hemisphere.
- IFS-NEMO shows systematically suppressed warming globally, hugging the CMIP6 5th percentile boundary, with notably weak Arctic amplification (~2.4 K peak).
- Both DestinE models and the CMIP6 ensemble capture the Southern Ocean 'warming hole' minimum around 50°S–60°S.
Spatial Patterns
All models show polar amplification, which is significantly stronger in the Northern Hemisphere. The Southern Ocean (approx. 60°S) features a local minimum in warming. The Arctic (>60°N) exhibits the largest spread in model responses, where IFS-FESOM is nearly 1.5 K warmer than IFS-NEMO.
Model Agreement
IFS-FESOM shows excellent agreement with the CMIP6 median (P50) across all latitudes, indicating a representative climate response. IFS-NEMO is an outlier on the cool side, consistently tracking the P5 lower envelope, suggesting a lower transient climate sensitivity or stronger ocean heat uptake in this configuration.
Physical Interpretation
The divergence between IFS-FESOM and IFS-NEMO highlights the influence of the ocean component (unstructured FESOM vs. structured NEMO) on the coupled system. The muted Arctic response in IFS-NEMO suggests differences in sea-ice albedo feedback or northward ocean heat transport. The Southern Ocean minimum is physically consistent with delayed warming due to deep ocean heat uptake and upwelling.
Caveats
- The 2040–2049 period is relatively near-term, meaning internal variability may still significantly modulate the zonal mean signal compared to the forced trend.
- The cause of IFS-NEMO's suppressed warming requires further investigation into its sea ice baseline and ocean mixing depths.
Zonal Mean Total Column Water Vapour Change
| Variables | avg_tcwv |
|---|---|
| Models | ifs-fesom, ifs-nemo |
| Units | kg/m2 |
| Baseline | 1990-2014 |
| Future | 2040-2049 |
| Method | 5° latitude bins on HealPix cells; equal-area mean per band. |
Summary high
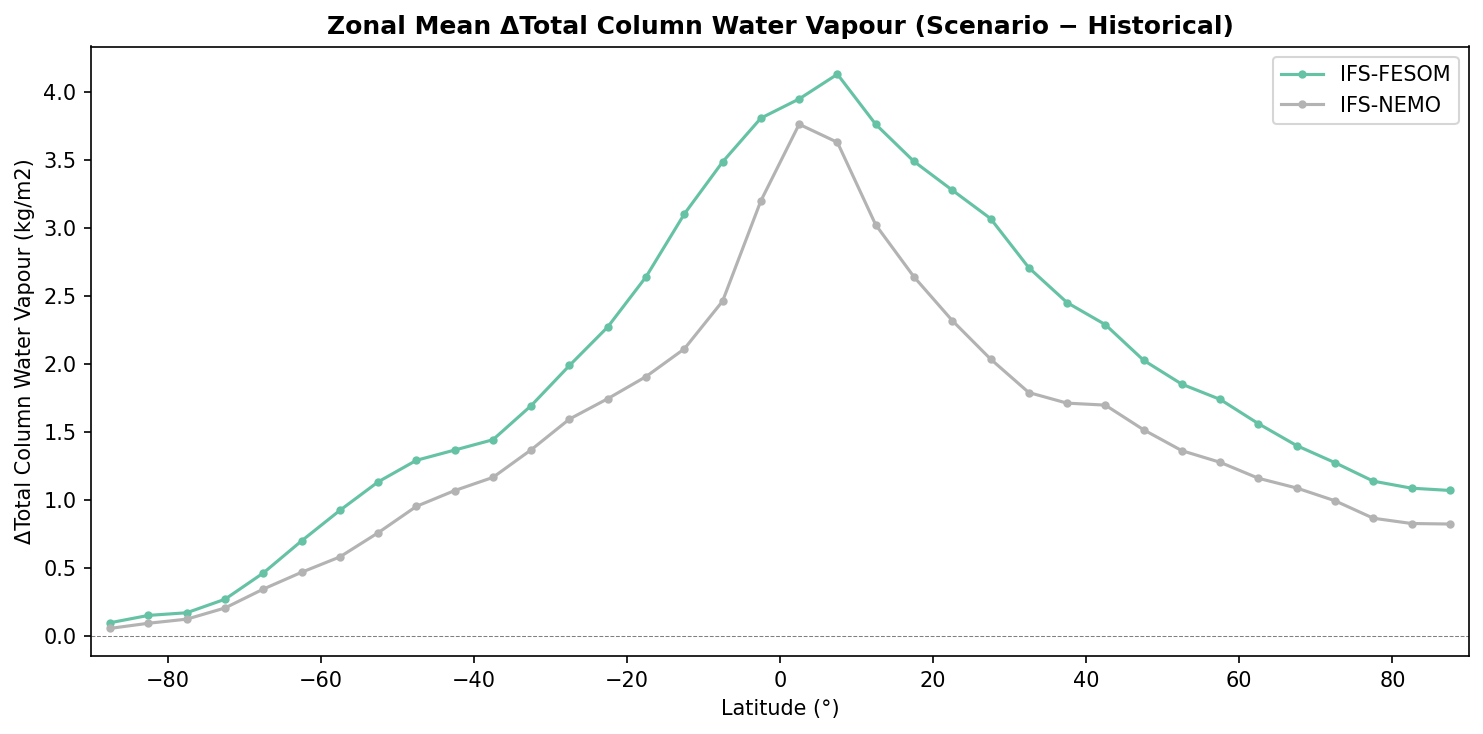
This figure illustrates the zonal mean change in Total Column Water Vapour (TCWV) between the future (2040–2049) and baseline (1990–2014) periods for IFS-FESOM and IFS-NEMO, compared against the CMIP6 SSP3-7.0 ensemble spread.
Key Findings
- All models show a robust global increase in atmospheric water vapour, peaking in the tropics (~4.5 kg/m²) and decreasing poleward, consistent with thermodynamic scaling.
- There is a systematic divergence between the two DestinE models: IFS-FESOM consistently projects a larger increase in TCWV than IFS-NEMO across all latitudes.
- IFS-NEMO tracks the very bottom of the CMIP6 envelope (P5) throughout the mid-latitudes (30°–60° N/S), indicating a response weaker than 95% of the CMIP6 ensemble.
- IFS-FESOM aligns closer to the CMIP6 median, though it shifts towards the upper quartile (P75) in the Northern Hemisphere subtropics (15°N–35°N).
Spatial Patterns
The response is dominated by a tropical peak (ITCZ region) where background temperatures and moisture availability are highest. A secondary feature is the distinct separation in the Northern Hemisphere subtropics, where IFS-FESOM shows a broad shoulder of high moisture increase (~3.5 kg/m²) compared to the sharper drop-off in IFS-NEMO (~2.7 kg/m²).
Model Agreement
Both models generally fall within the CMIP6 P5–P95 envelope, but they occupy opposite ends of the distribution. IFS-FESOM represents a 'median-to-wet' response relative to CMIP6, while IFS-NEMO represents a 'dry' (minimal change) outlier. The CMIP6 spread is widest in the tropics, reflecting high uncertainty in convective parametrization and tropical warming sensitivity.
Physical Interpretation
The universal increase is driven by the Clausius-Clapeyron relation (~7% more water vapour per degree of warming). Since both DestinE models share the same atmospheric physics (IFS), the systematic offset suggests the ocean components drive the difference: the FESOM ocean likely produces stronger Sea Surface Temperature (SST) warming than the NEMO ocean, leading to higher evaporation rates and atmospheric moisture capacity.
Caveats
- Zonal means obscure significant regional heterogeneity, particularly land-ocean contrasts which are crucial for TCWV changes.
- The analysis assumes the 'Scenario' period is SSP3-7.0 based on the CMIP6 context; the specific warming level difference between models is inferred rather than shown.
Zonal Mean Total Precipitation Rate Change
| Variables | avg_tprate |
|---|---|
| Models | ifs-fesom, ifs-nemo |
| Units | kg/m2/s |
| Baseline | 1990-2014 |
| Future | 2040-2049 |
| Method | 5° latitude bins on HealPix cells; equal-area mean per band. |
Summary high
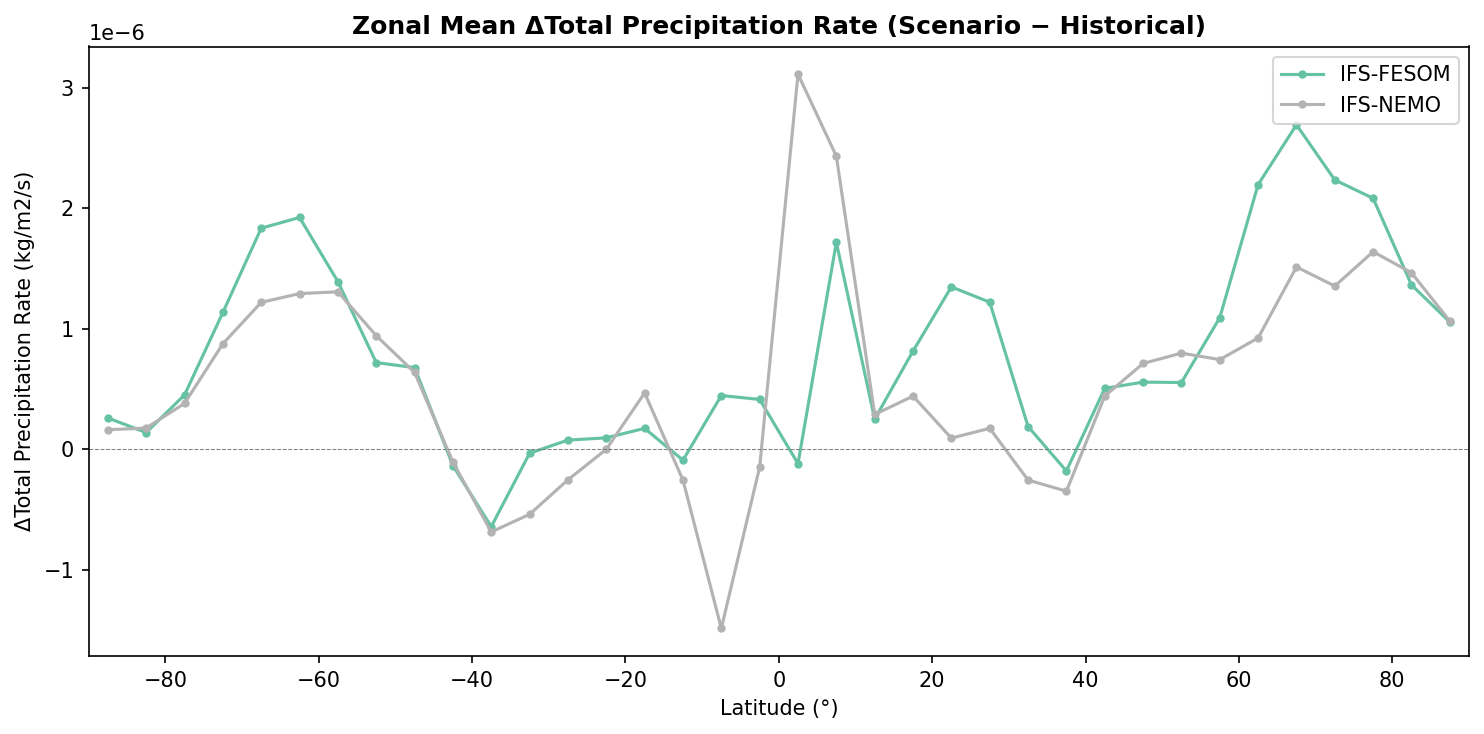
IFS-NEMO closely tracks the CMIP6 multi-model median zonal mean precipitation changes, reinforcing the 'wet-get-wetter, dry-get-drier' paradigm, whereas IFS-FESOM diverges significantly in the Northern Hemisphere, predicting unexpected wetting in the subtropics and excessive precipitation in the Arctic.
Key Findings
- IFS-FESOM shows a strong positive precipitation anomaly in the Northern Hemisphere subtropics (approx. 15°N–30°N), contradicting the drying trend (negative anomaly) seen in the CMIP6 median and IFS-NEMO.
- IFS-FESOM projects precipitation increases in the Northern High Latitudes (>60°N) that significantly exceed the CMIP6 95th percentile envelope.
- IFS-NEMO exhibits high fidelity to the CMIP6 ensemble median structure, correctly capturing the equatorial wetting peak and the subtropical drying minima in both hemispheres.
- Both DestinE models and CMIP6 agree on the magnitude of precipitation increase in the Southern Ocean and Antarctica.
Spatial Patterns
The standard zonal profile features a tropical peak (ITCZ intensification), subtropical troughs (Hadley cell drying), and high-latitude increases. IFS-NEMO reproduces this structure faithfully. IFS-FESOM disrupts the Northern Hemisphere pattern, lacking a distinct subtropical drying minimum and instead showing a broad region of wetting extending from the tropics to the pole.
Model Agreement
IFS-NEMO falls well within the CMIP6 P5-P95 envelope at nearly all latitudes, often tracking the P50 median. IFS-FESOM agrees with CMIP6 in the Southern Hemisphere but disagrees sharply north of the equator, lying outside the P95 envelope in the NH subtropics and Arctic.
Physical Interpretation
The anomalous wetting in the NH subtropics in IFS-FESOM suggests either a northward displacement of the ITCZ/monsoon systems or a failure to capture the dynamical drying associated with the descending branch of the Hadley cell in this simulation. The excessive Arctic precipitation in IFS-FESOM implies a stronger hydrological response to warming, possibly linked to sea-ice loss feedbacks or enhanced poleward moisture transport in the FESOM coupling configuration.
Caveats
- Zonal means blend land and ocean signals; the NH subtropical anomaly in IFS-FESOM could be driven by specific regional biases (e.g., overactive monsoons) rather than a global zonal shift.
- The analysis is based on a single ensemble member for the DestinE models.