Tier 1 Bowen Ratio CMIP6 f_out 20.5%
CMIP6 Envelope Comparison
DestinE anomalies compared to the CMIP6 P5–P95 percentile envelope derived from 48 ensemble members across 11 models under SSP3-7.0.
Contributing models: AWI-CM-1-1-MR, CNRM-CM6-1, MIROC6, MPI-ESM1-2-LR, UKESM1-0-LL
Outside CMIP6 does not mean wrong — it indicates an uncommon response within the CMIP6 distribution.
Synthesis
Related diagnostics
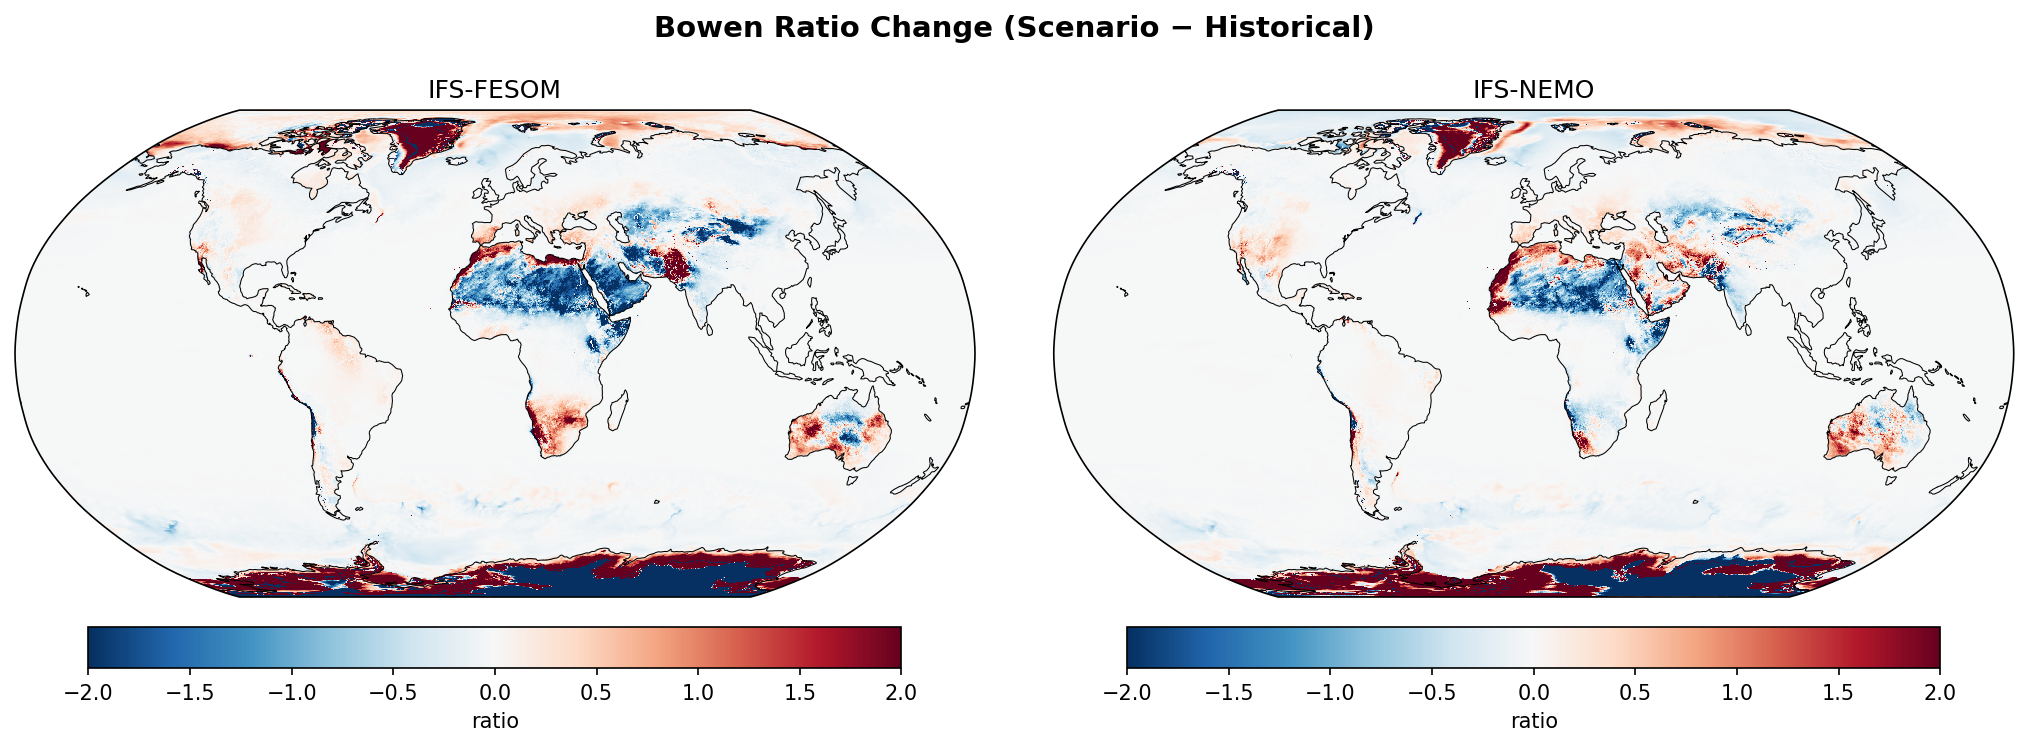
Bowen Ratio Change
| Variables | avg_ishf, avg_slhtf |
|---|---|
| Models | ifs-fesom, ifs-nemo, CMIP6-MMM |
| Units | W/m2 |
| Baseline | 1990-2014 |
| Future | 2040-2049 |
| Method | B = SHF/LHF. ΔB = B_future − B_historical. |
Summary medium
The figure illustrates projected mid-century changes in the Bowen ratio (sensible/latent heat flux), highlighting a robust wetting signal in the Sahel and drying in the subtropics across all models, though IFS simulations show sharper gradients and stronger drying over Southern Hemisphere land compared to the CMIP6 multi-model mean.
Key Findings
- Sahel Greening: All models show a strong decrease in Bowen ratio (blue) across the Sahel, indicating increased latent heat flux driven by intensified monsoon rainfall/moisture availability.
- Subtropical Drying: IFS-FESOM and IFS-NEMO exhibit prominent increases in Bowen ratio (red) over Southern Africa, Australia, and the Mediterranean, suggesting stronger soil moisture depletion and a shift towards sensible heating compared to the weaker signals in CMIP6-MMM.
- Antarctic Discrepancy: A major divergence exists in the high southern latitudes; CMIP6-MMM displays a uniform, intense increase in Bowen ratio around Antarctica (likely sea-ice edge retreat), whereas IFS models show a complex, spatially heterogeneous response with significant areas of decrease.
Spatial Patterns
A distinct zonal dipole is visible over North Africa (blue Sahel vs. red Sahara/Mediterranean). High-resolution IFS models resolve sharper regional drying features in Australia, South Africa, and parts of the Amazon compared to the smoother CMIP6 field. The Southern Ocean exhibits high-magnitude changes, but with opposing signs/patterns between IFS and CMIP6.
Model Agreement
There is strong qualitative agreement on the dipole response over Africa (Sahel wetting/North Africa drying) and general subtropical drying. Significant disagreement occurs in the magnitude of Southern Hemisphere land drying (IFS > CMIP6) and the sign/structure of changes around the Antarctic sea-ice zone.
Physical Interpretation
Decreases in Bowen ratio (blue) in the Sahel reflect a northward shift or intensification of the West African Monsoon, increasing soil moisture and evapotranspiration. Increases (red) in the subtropics correspond to the 'dry-gets-drier' paradigm and poleward expansion of arid zones, limiting evapotranspiration. The high-latitude signals likely result from sea-ice loss altering the surface energy balance, with model differences potentially stemming from sea-ice baseline states or flux parameterizations over mixed ice/ocean surfaces.
Caveats
- The analysis compares a single decadal slice (2040-2049) against a baseline, which may include internal variability noise.
- The Bowen ratio can be unstable or noisy in very arid regions where latent heat flux approaches zero.
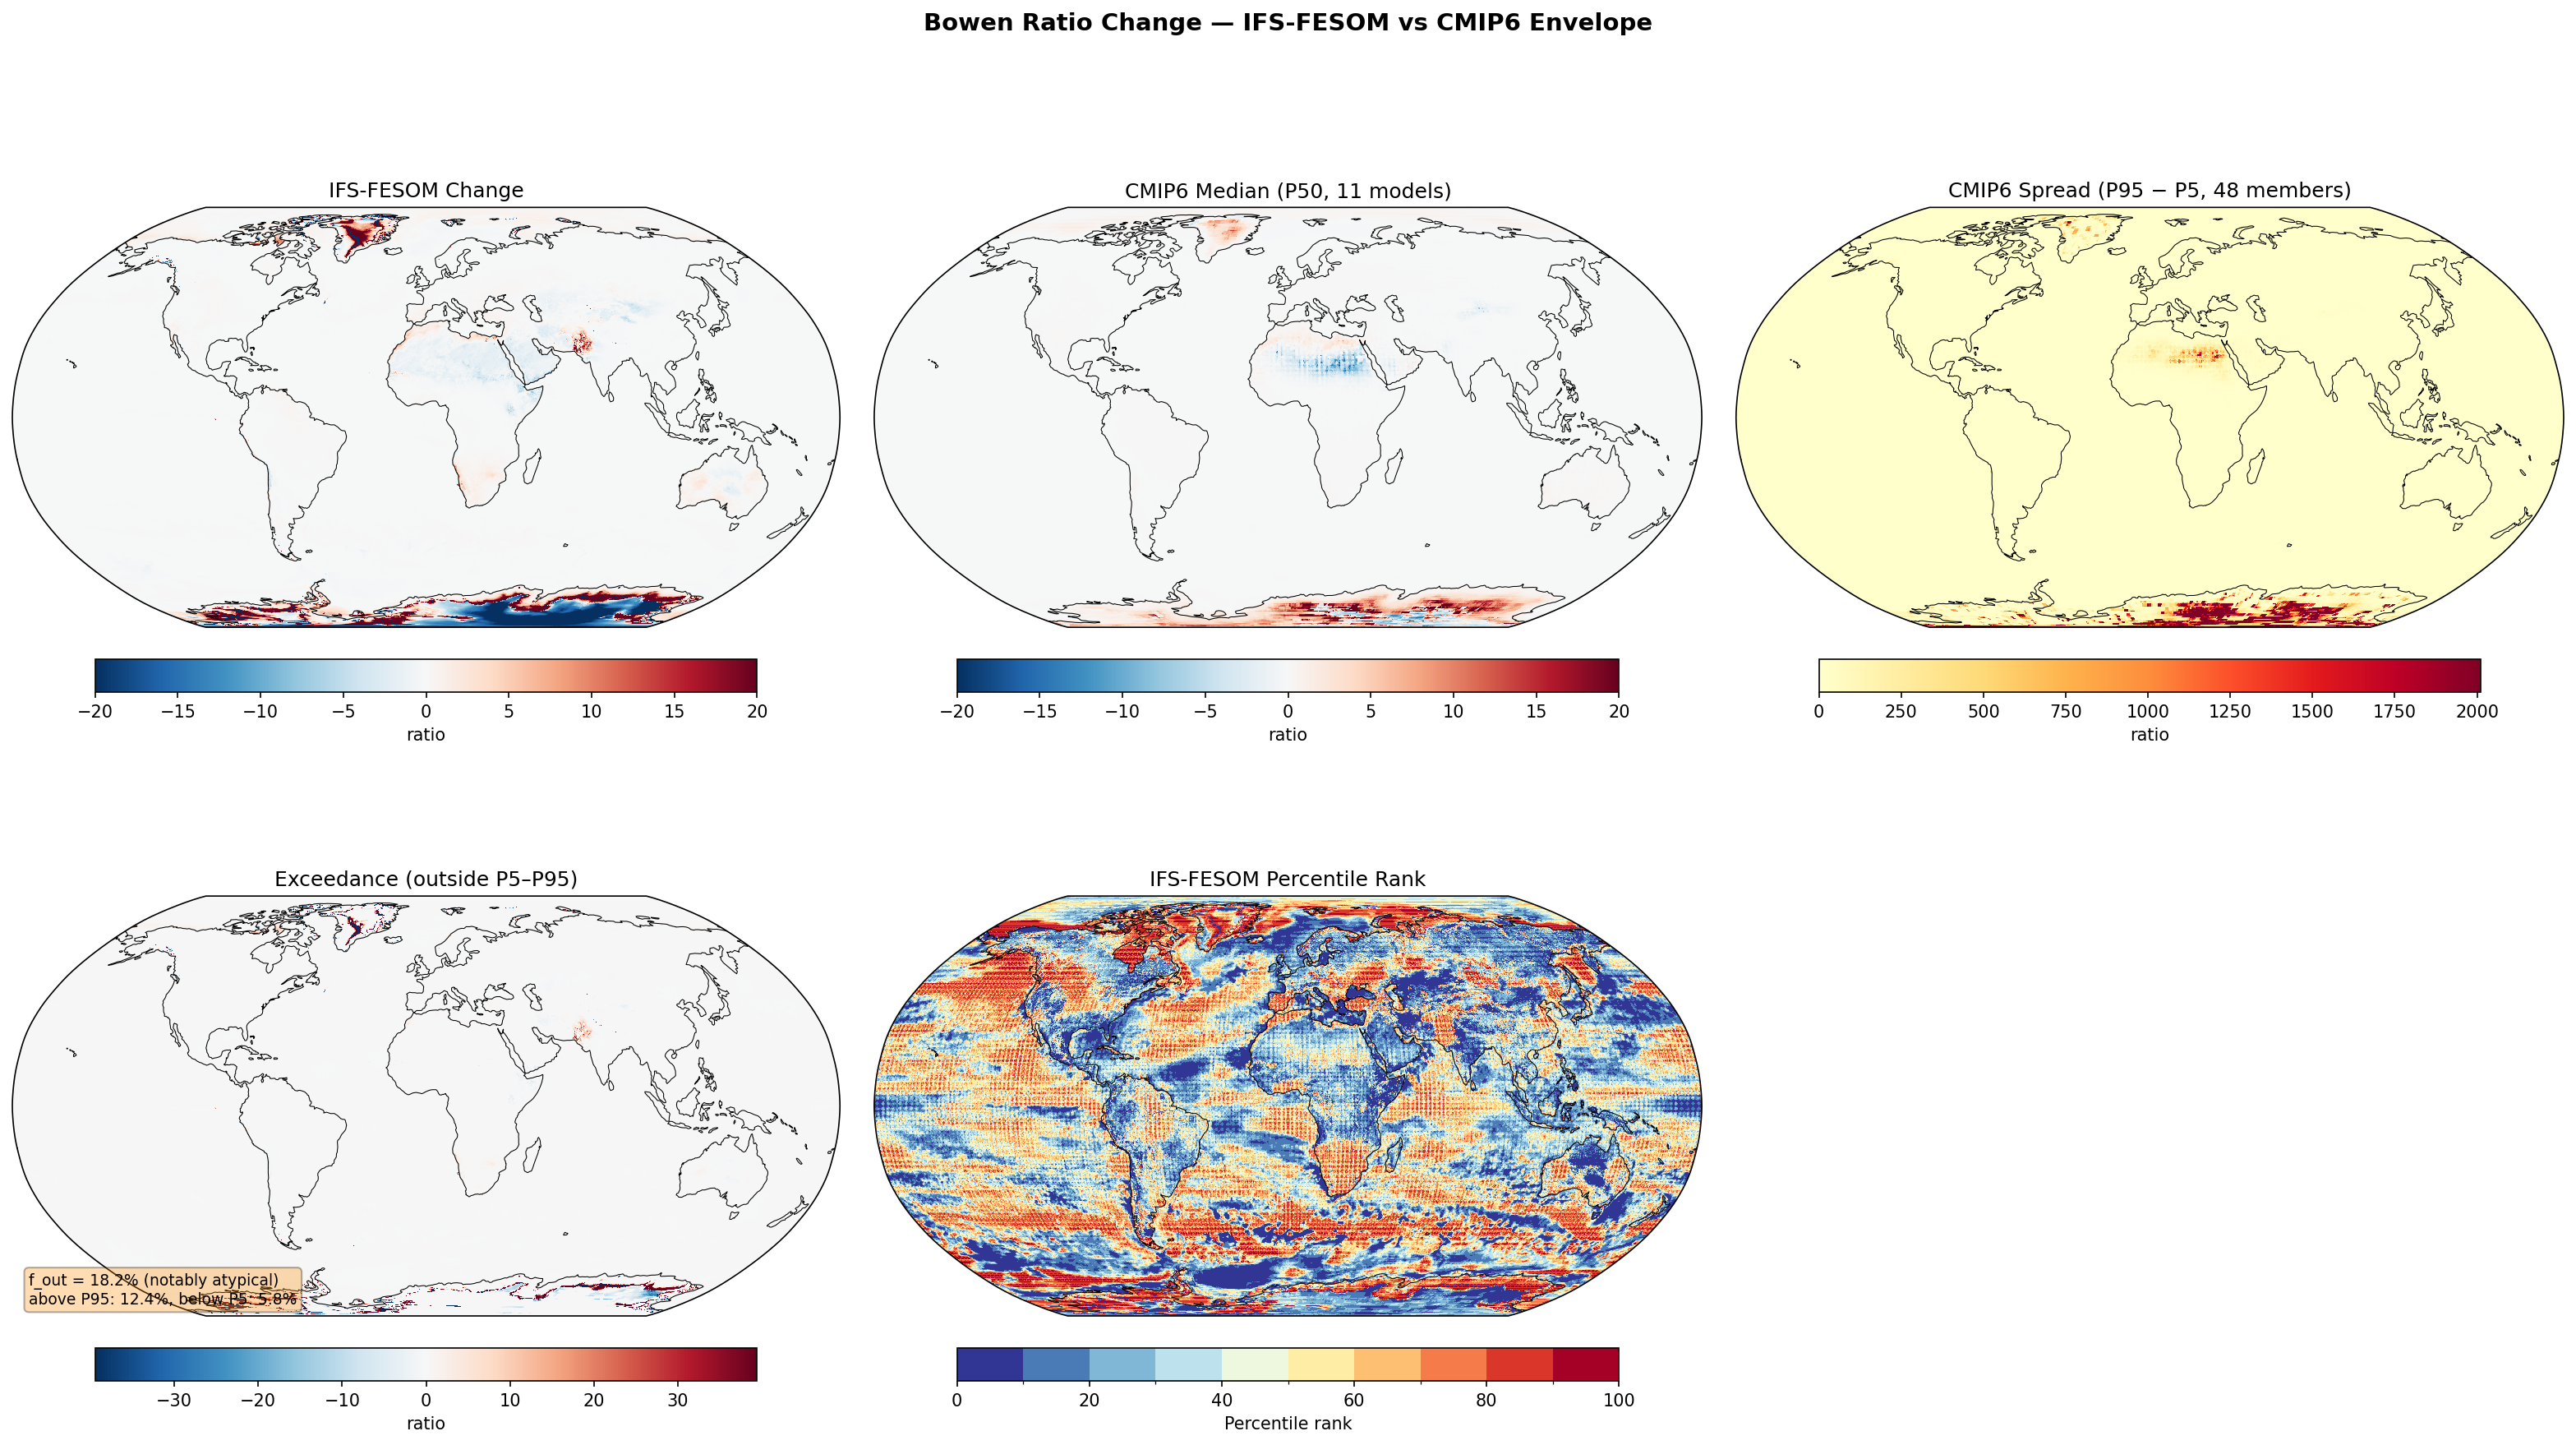
Bowen Ratio Change — IFS-FESOM vs CMIP6 Envelope f_out 18.2%
Envelope Metrics
| f_out (outside P5–P95) | 18.2% notably atypical |
|---|---|
| Above P95 | 12.4% |
| Below P5 | 5.8% |
| CMIP6 ensemble | 11 models, 48 members |
| Variables | avg_ishf, avg_slhtf |
|---|---|
| Models | ifs-fesom |
| Units | W/m2 |
| Baseline | 1990-2014 |
| Future | 2040-2049 |
| Method | B = SHF/LHF. ΔB = B_future − B_historical. Compared to CMIP6 percentile envelope (P5, P50, P95). |
Summary high
IFS-FESOM exhibits a notably atypical response (f_out = 18.2%) compared to the CMIP6 envelope, primarily driven by substantial deviations in surface energy partitioning over the cryosphere (Greenland and Antarctica). While the model captures the sign of hydrological changes in the Sahel, its magnitude of response over ice sheets lies significantly outside the CMIP6 P5–P95 range.
Key Findings
- Greenland shows a strong positive Bowen ratio change (shift towards sensible heat), far exceeding the CMIP6 P95 percentile.
- Antarctica exhibits a complex dipole pattern with the interior falling below the CMIP6 P5 (wetter/more latent heat influence) and coastal margins exceeding the P95.
- The Sahel region displays a decrease in Bowen ratio, consistent with a 'greening' signal (increased latent heat flux) seen in the CMIP6 median, though spatially sharper in IFS-FESOM.
- Oceanic regions show high variance in percentile ranks (often at extremes 0 or 100) despite negligible absolute changes in the Bowen ratio.
Spatial Patterns
The most prominent features are the intense positive anomalies over Greenland and coastal Antarctica, and the negative anomalies in the Antarctic interior and the Sahel. The CMIP6 spread is largest over arid regions (Sahara, Australia) and Antarctica, indicating high ensemble uncertainty in these moisture-limited regimes.
Model Agreement
IFS-FESOM agrees with the CMIP6 median regarding the sign of change in the Sahel (decreasing Bowen ratio) but disagrees significantly over the cryosphere. The exceedance map highlights that IFS-FESOM's response over Greenland and the Antarctic interior is structurally distinct from the standard CMIP6 distribution.
Physical Interpretation
The deviations over ice sheets suggest differences in surface schemes handling sublimation versus melt (latent vs. sensible heat) in a warmer climate, potentially exacerbated by the higher resolution resolving coastal topography differently. The Sahel signal reflects an intensified hydrological cycle with increased evapotranspiration. The extreme sensitivity of the Bowen ratio when the denominator (latent heat flux) is near zero contributes to the large spread and high exceedance values in arid and frozen regions.
Caveats
- The Bowen ratio is mathematically unstable in regions with very low latent heat flux (deserts, ice sheets), leading to extreme values and large ensemble spreads; comparisons in these regions should be interpreted with caution.
- High percentile ranks over the ocean often correspond to physically negligible absolute differences due to the small range of oceanic Bowen ratios.
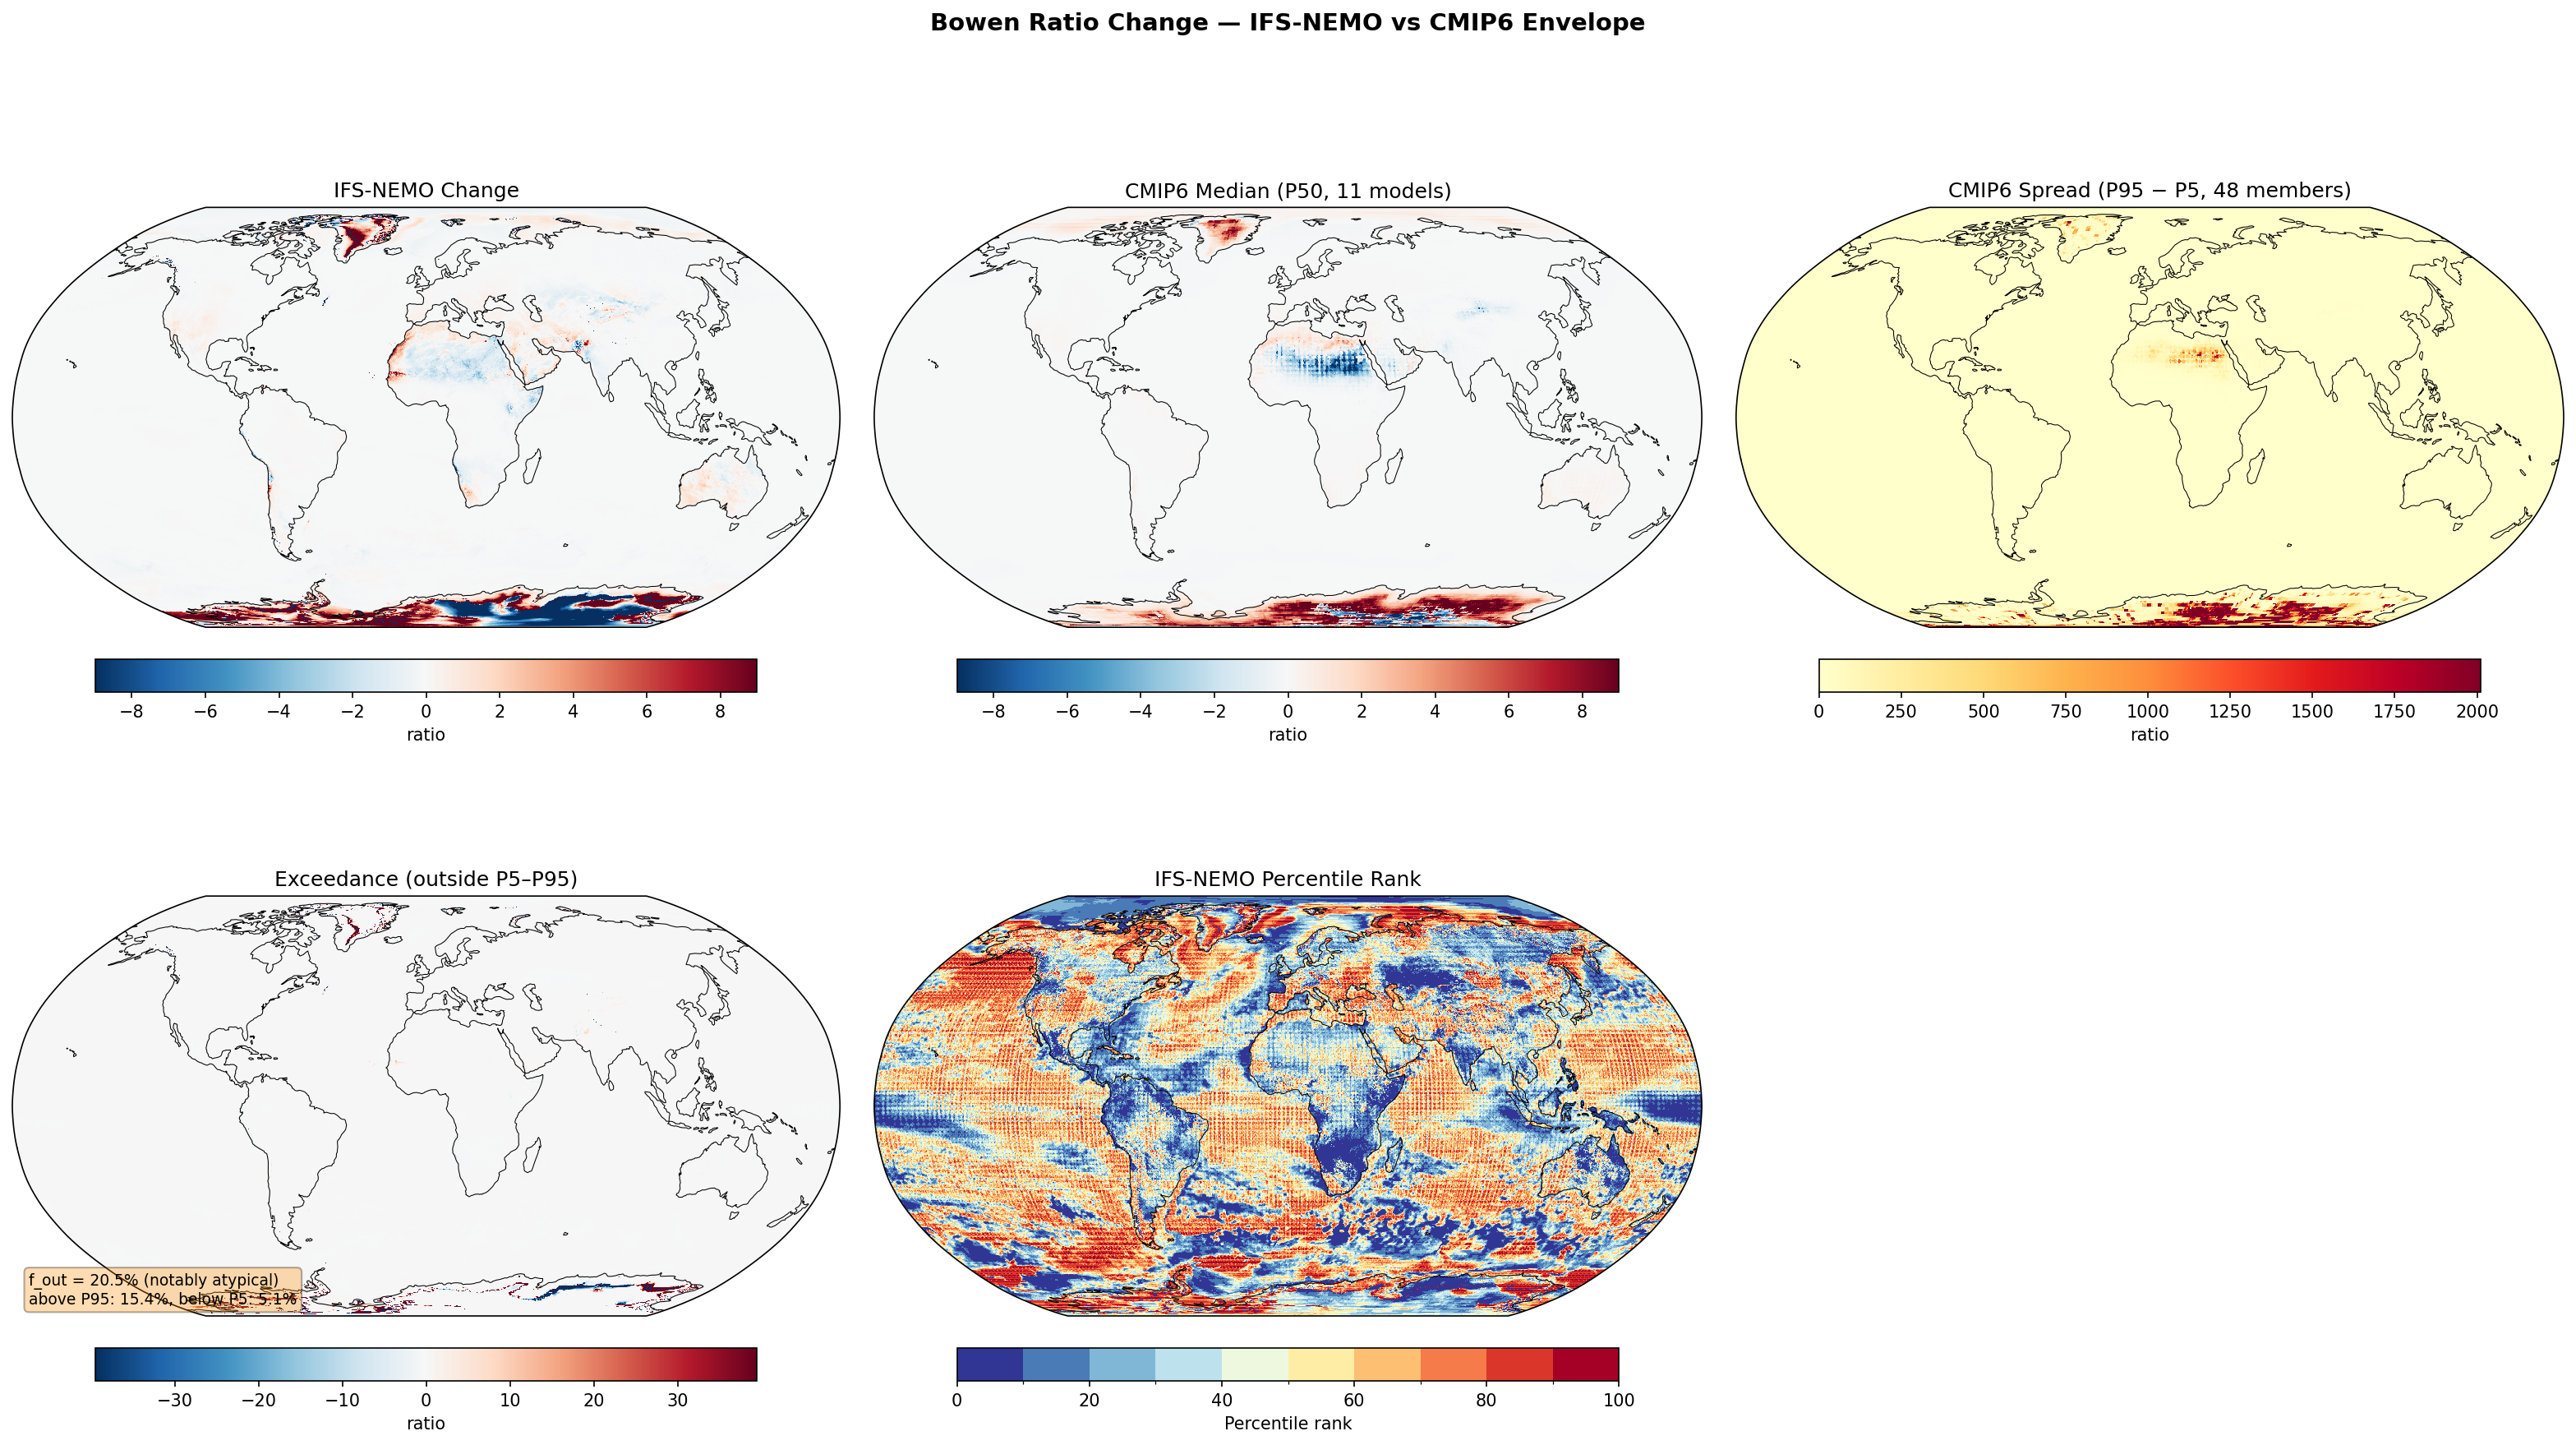
Bowen Ratio Change — IFS-NEMO vs CMIP6 Envelope f_out 20.5%
Envelope Metrics
| f_out (outside P5–P95) | 20.5% notably atypical |
|---|---|
| Above P95 | 15.4% |
| Below P5 | 5.1% |
| CMIP6 ensemble | 11 models, 48 members |
| Variables | avg_ishf, avg_slhtf |
|---|---|
| Models | ifs-nemo |
| Units | W/m2 |
| Baseline | 1990-2014 |
| Future | 2040-2049 |
| Method | B = SHF/LHF. ΔB = B_future − B_historical. Compared to CMIP6 percentile envelope (P5, P50, P95). |
Summary high
IFS-NEMO exhibits a notably atypical Bowen ratio response (f_out = 20.5%) relative to CMIP6, primarily driven by large divergences in surface energy partitioning over the Antarctic cryosphere and Greenland, despite good agreement on the Sahel greening signal.
Key Findings
- IFS-NEMO lies outside the CMIP6 P5–P95 envelope over 20.5% of the globe, classified as 'notably atypical', with 15.4% exceeding the P95 threshold.
- Major discrepancies are concentrated in the cryosphere: IFS-NEMO shows a strong negative Bowen ratio change (shift to latent heat) in the Weddell Sea region, whereas the CMIP6 median shows a positive change.
- IFS-NEMO predicts a significantly stronger increase in the Bowen ratio over Greenland (shift to sensible heat) compared to the CMIP6 ensemble.
- The model reproduces the projected decrease in Bowen ratio over the Sahel (Sahel greening/wetting), falling well within the CMIP6 envelope.
Spatial Patterns
The most prominent spatial features are the intense dipole patterns over Antarctica (strong negative change in the Weddell/Ross sea sectors, positive elsewhere) and the sharp positive signal over Greenland. Over the ocean, the percentile rank map is noisy ('salt-and-pepper'), indicating sensitivity to small differences where the Bowen ratio is naturally low. The Sahel shows a coherent band of negative change (blue) extending across North Africa.
Model Agreement
IFS-NEMO agrees well with the CMIP6 median in the tropics and subtropics, particularly capturing the wettening signal in the Sahel and the general oceanic patterns. Disagreement is starkest at high latitudes; for instance, the CMIP6 spread is massive over the Sahara and Antarctica, yet IFS-NEMO still falls outside this wide envelope in specific Antarctic coastal zones and Greenland.
Physical Interpretation
The Bowen ratio (SHF/LHF) change reflects shifts in surface energy partitioning. In the Sahel, the agreement signals a robust intensification of the monsoon (increased soil moisture and evaporation). The divergence in Antarctica likely stems from differences in sea-ice thermodynamics and surface boundary layer parameterizations; the negative anomaly in IFS-NEMO suggests enhanced latent heat flux (sublimation or open-water evaporation from reduced sea ice) relative to the CMIP6 mean. The positive anomaly over Greenland suggests surface warming outpaced evaporation capacity, shifting energy to sensible heat.
Caveats
- The Bowen ratio becomes numerically unstable/volatile when Latent Heat Flux is near zero (e.g., over ice sheets and deserts), leading to extreme values and high inter-model spread.
- High f_out over oceans in the percentile rank map may represent negligible absolute differences in W/m² due to the typically low Bowen ratio over water.
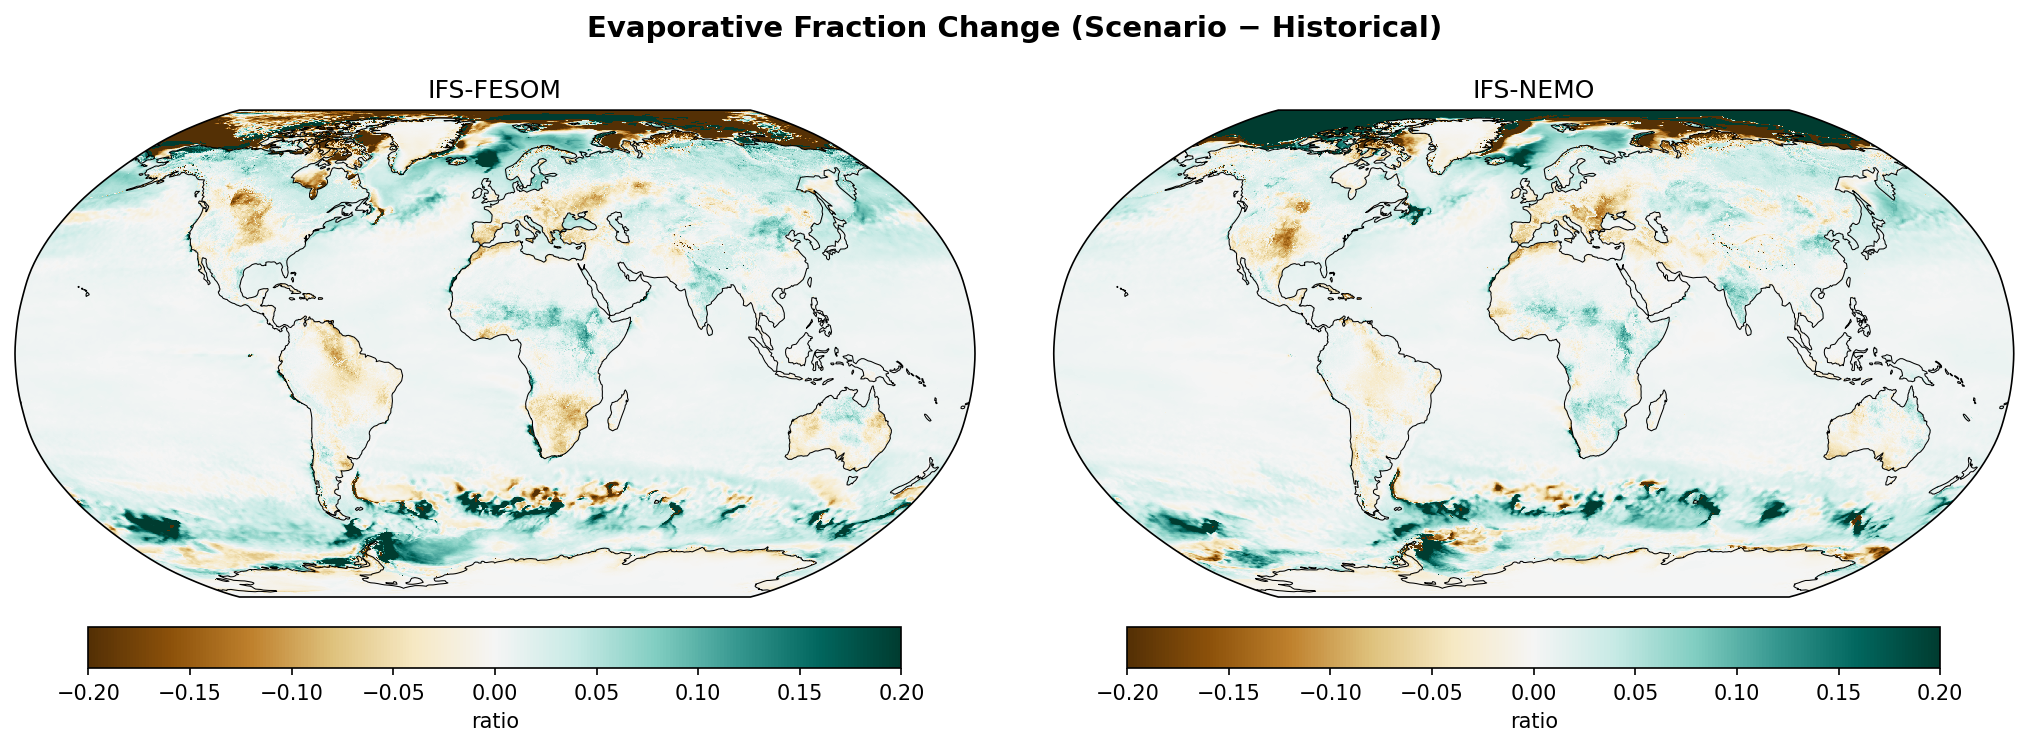
Evaporative Fraction Change
| Variables | avg_ishf, avg_slhtf |
|---|---|
| Models | ifs-fesom, ifs-nemo, CMIP6-MMM |
| Units | W/m2 |
| Baseline | 1990-2014 |
| Future | 2040-2049 |
| Method | EF = LHF/(SHF+LHF). ΔEF = EF_future − EF_historical. |
Summary high
The figure illustrates the change in Evaporative Fraction (EF) between the future (2040-2049) and historical baseline, highlighting shifts in surface energy partitioning. The models generally agree on drying trends (decreased EF) in the subtropics and wetting (increased EF) in the Sahel and high latitudes, with high-resolution IFS models resolving sharper regional features than the CMIP6 mean.
Key Findings
- Widespread decrease in evaporative fraction (browning) over the Mediterranean, Southern Africa, and the Amazon, indicating a shift towards sensible heat dominance due to soil moisture drying.
- Strong increase in evaporative fraction (greening) over the Sahel and Central Africa, suggesting enhanced monsoon rainfall and evapotranspiration.
- High-latitude oceans show intense positive anomalies driven by sea ice loss, which exposes open water and dramatically increases latent heat flux.
Spatial Patterns
The maps display a distinct zonal asymmetry: high northern latitudes and the Sahel show increased EF, while subtropical land masses (Mediterranean, South Africa, Western North America, Amazon) show decreases. The Southern Ocean displays complex, turbulent structures of increasing EF in the IFS models, contrasting with the smooth CMIP6 mean.
Model Agreement
All models agree on the sign of change in major hotspots: Mediterranean drying, Sahel wetting, and high-latitude sea-ice effects. However, IFS-NEMO projects more intense drying over the Amazon and Central Europe compared to IFS-FESOM. The CMIP6-MMM shows weaker amplitudes and lacks the fine-scale variability seen in the eddy-permitting IFS simulations.
Physical Interpretation
Decreasing EF on land signifies a transition to moisture-limited regimes where available energy is dissipated as sensible heat rather than evaporation (drying). Increasing EF in the Sahel reflects vegetation greening and precipitation increases. In polar regions, the retreat of sea ice allows for significantly greater surface evaporation compared to the insulated ice cover.
Caveats
- The CMIP6-MMM is an ensemble average, which naturally smooths out internal variability and sharp frontal features present in the single-realization IFS runs.
- Decadal variability in the short 10-year future window (2040s) may influence regional patterns, particularly in regions with high natural variability like North America.
Evaporative Fraction Change — IFS-FESOM vs CMIP6 Envelope f_out 18.8%

Envelope Metrics
| f_out (outside P5–P95) | 18.8% notably atypical |
|---|---|
| Above P95 | 7.8% |
| Below P5 | 10.9% |
| CMIP6 ensemble | 11 models, 48 members |
| Variables | avg_ishf, avg_slhtf |
|---|---|
| Models | ifs-fesom |
| Units | W/m2 |
| Baseline | 1990-2014 |
| Future | 2040-2049 |
| Method | EF = LHF/(SHF+LHF). ΔEF = EF_future − EF_historical. Compared to CMIP6 percentile envelope (P5, P50, P95). |
Summary high
IFS-FESOM displays a notably atypical response (f_out = 18.8%) in projected Evaporative Fraction (EF) changes, characterized primarily by a strong relative decrease in the Arctic and localized increases in the Sahel compared to the CMIP6 ensemble.
Key Findings
- The model falls outside the CMIP6 P5-P95 envelope over 18.8% of the globe, with the largest deviation being below the 5th percentile (10.9%), concentrated in the Arctic.
- IFS-FESOM projects a strong decrease in EF over the Arctic Ocean (shifting towards sensible heat), whereas the CMIP6 median shows a neutral-to-positive signal.
- A coherent region in the Sahel/West Africa shows EF increases exceeding the CMIP6 P95 threshold, suggesting stronger surface wetting/greening.
- Oceanic regions exhibit a granular 'salt-and-pepper' pattern in percentile rank, indicating resolved mesoscale variability not present in the coarser CMIP6 ensemble.
Spatial Patterns
The Arctic Ocean is marked by widespread negative change (brown) and 'below P5' exceedance (blue). The Sahel shows a distinct band of positive change (green) and 'above P95' exceedance (red). Open oceans show fine-scale heterogeneity in percentile ranks, while broad subtropical gyres remain within the CMIP6 envelope.
Model Agreement
IFS-FESOM agrees with the CMIP6 ensemble in stable subtropical ocean regions. It strongly disagrees in the Arctic (IFS-FESOM predicts lower EF) and the Sahel (IFS-FESOM predicts higher EF).
Physical Interpretation
The Arctic anomaly implies IFS-FESOM partitions turbulent fluxes more towards Sensible Heat Flux (relative to Latent Heat Flux) than CMIP6 models as sea ice retreats; this may result from colder atmospheric boundary layers or distinct sea-ice coupling physics. The Sahel signal is consistent with improved resolution of the West African Monsoon often yielding wetter soils and higher evaporation. Oceanic granularity reflects resolved eddies creating local flux extremes.
Caveats
- Evaporative Fraction is numerically sensitive/unstable in regions with low total turbulent fluxes (e.g., over sea ice or arid deserts).
- Comparing a high-resolution model (with resolved eddies) to a smooth ensemble mean inherently inflates f_out over the oceans due to spatial variance mismatch.
Evaporative Fraction Change — IFS-NEMO vs CMIP6 Envelope f_out 20.5%
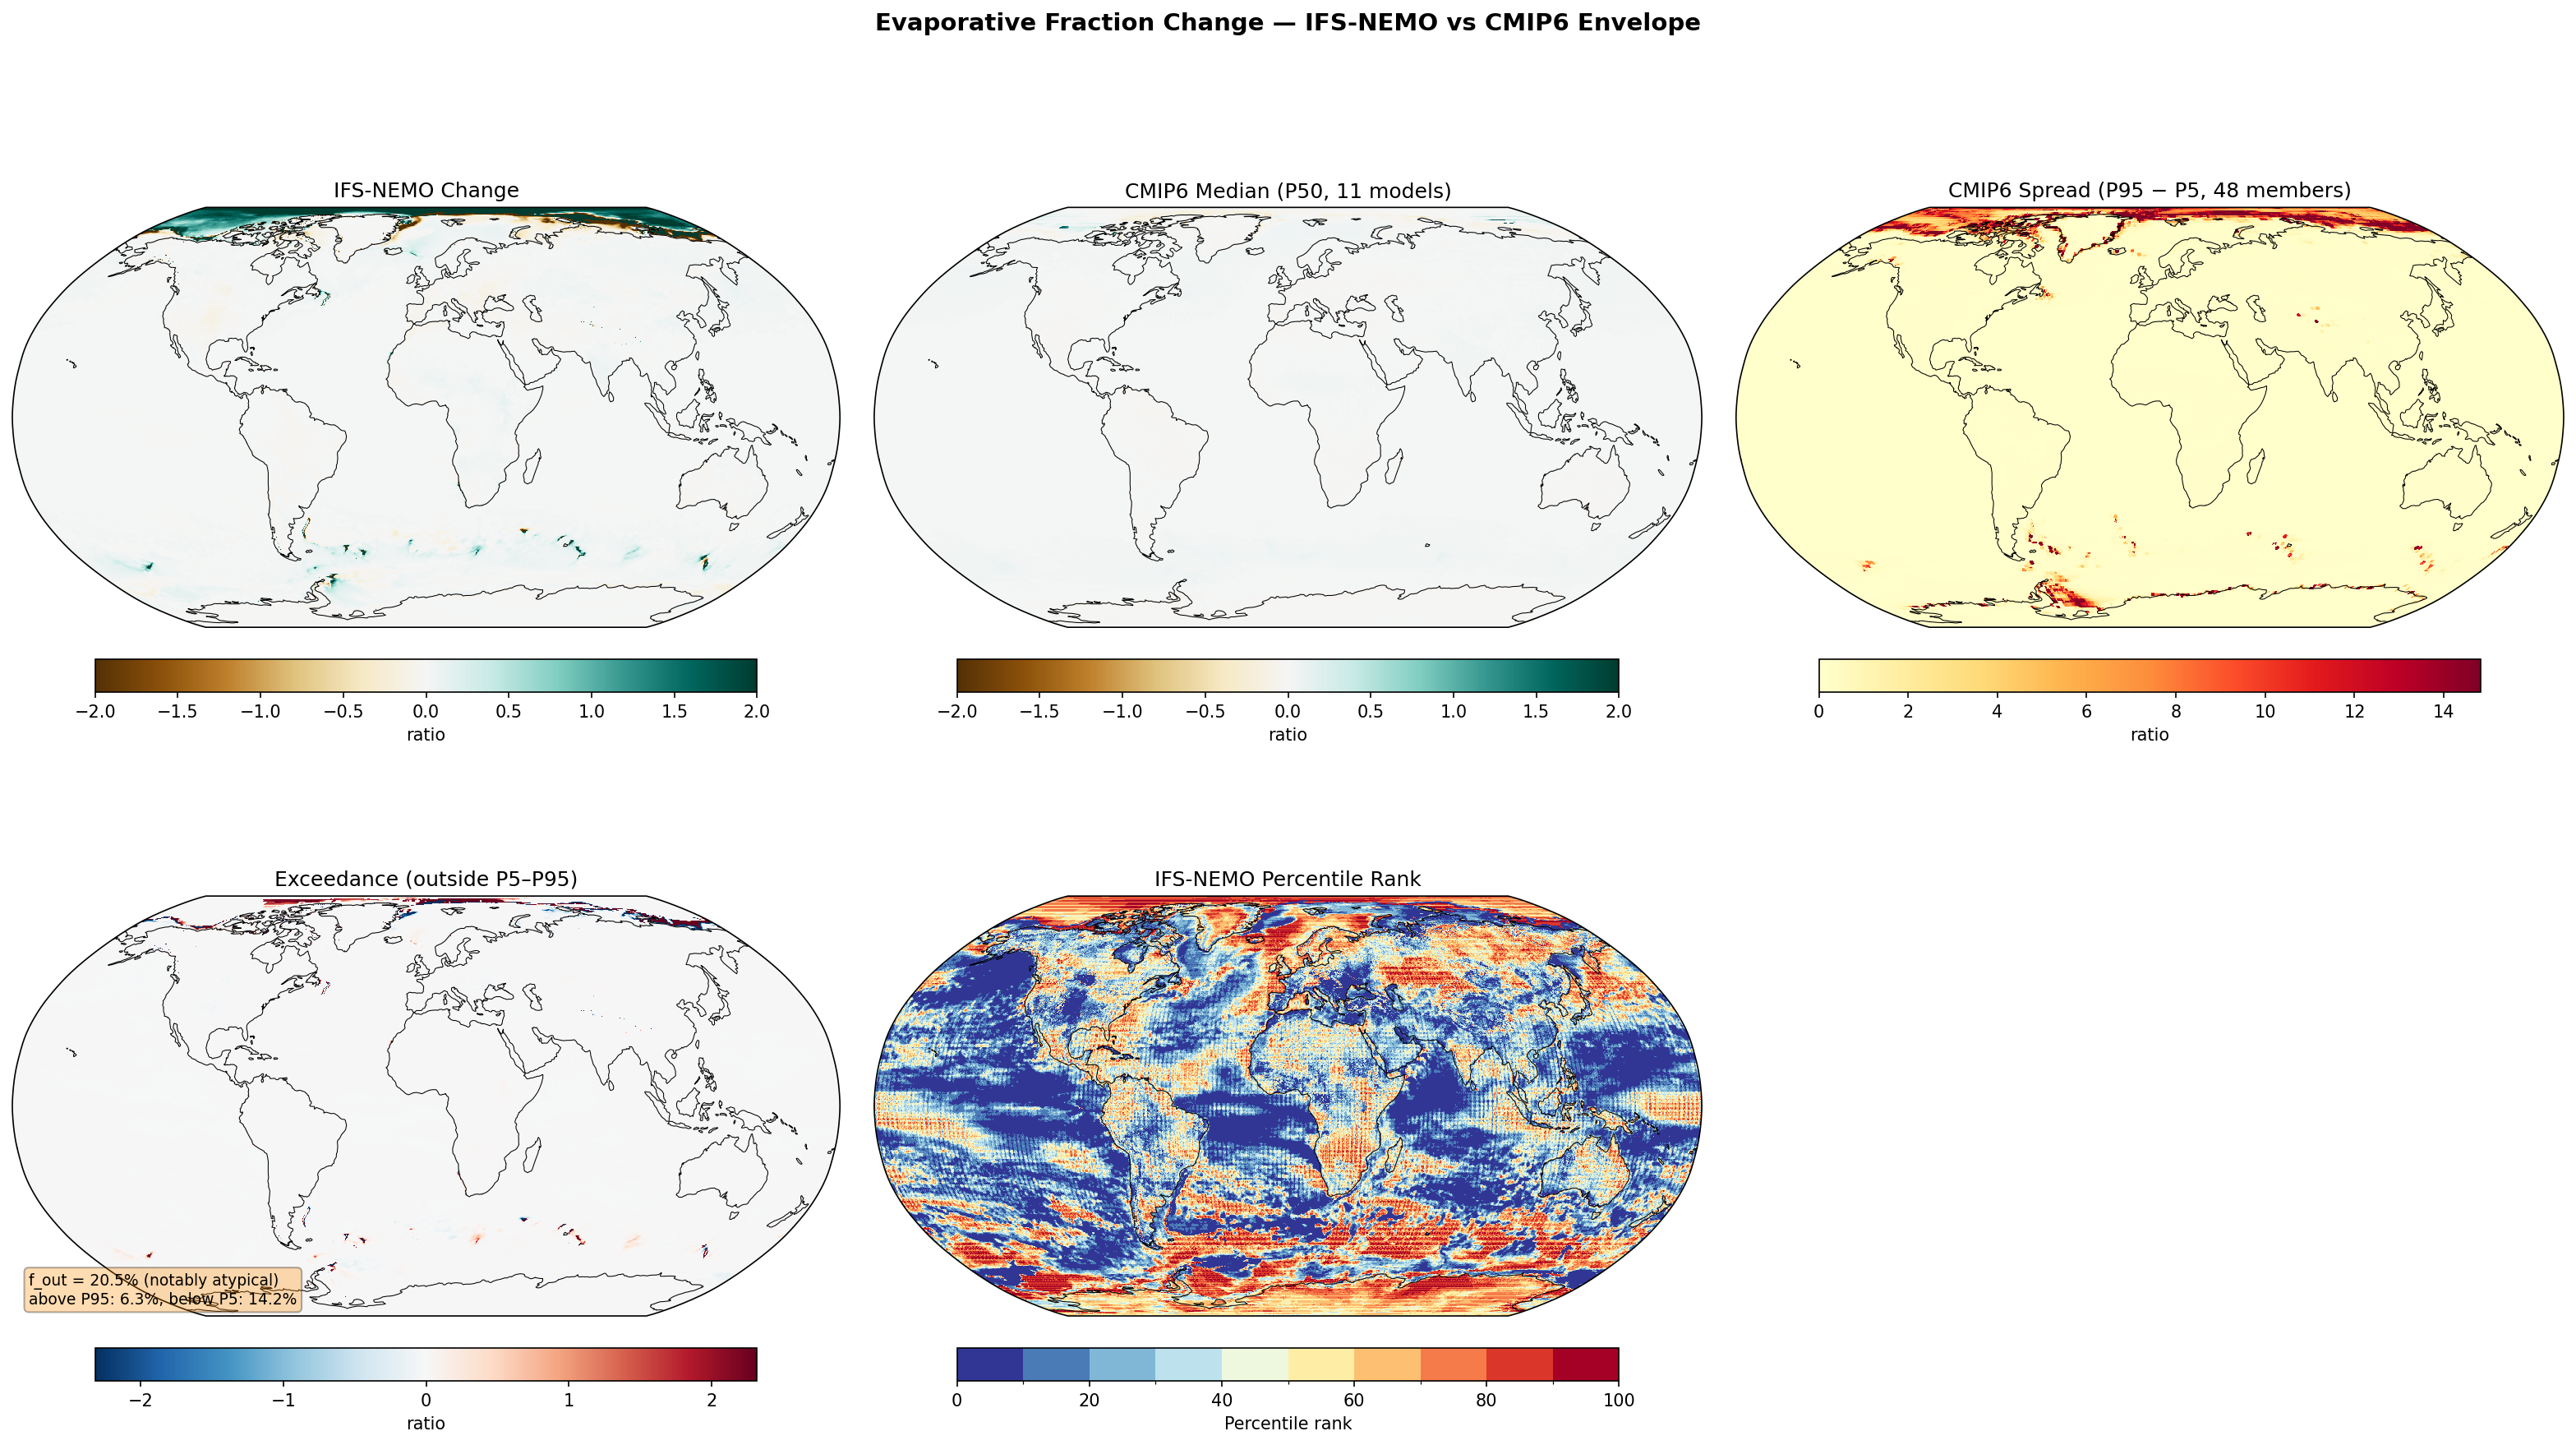
Envelope Metrics
| f_out (outside P5–P95) | 20.5% notably atypical |
|---|---|
| Above P95 | 6.3% |
| Below P5 | 14.2% |
| CMIP6 ensemble | 11 models, 48 members |
| Variables | avg_ishf, avg_slhtf |
|---|---|
| Models | ifs-nemo |
| Units | W/m2 |
| Baseline | 1990-2014 |
| Future | 2040-2049 |
| Method | EF = LHF/(SHF+LHF). ΔEF = EF_future − EF_historical. Compared to CMIP6 percentile envelope (P5, P50, P95). |
Summary high
IFS-NEMO exhibits notably atypical changes in Evaporative Fraction (f_out = 20.5%) relative to the CMIP6 envelope, driven primarily by strong, spatially complex deviations in high-latitude sea-ice transition zones.
Key Findings
- A significant fraction of the domain (20.5%) lies outside the CMIP6 P5–P95 envelope, with a bias towards values below the P5 threshold (14.2% below vs 6.3% above).
- Discrepancies are physically concentrated in the Arctic and Southern Oceans, where IFS-NEMO shows sharp, high-magnitude changes (both positive and negative) absent or smoothed out in the CMIP6 median.
- Tropical and mid-latitude oceans display extreme percentile ranks (0 or 100) but negligible absolute changes, indicating that while IFS-NEMO is statistically distinct, the physical difference in these regions is minimal.
- Land areas show high agreement with CMIP6, with very low absolute changes and few areas of exceedance.
Spatial Patterns
The Arctic Ocean features a distinct mosaic of strong increases (teal) and decreases (brown) in evaporative fraction along coastline and ice margins. In contrast, the tropical and subtropical oceans show a 'salt-and-pepper' noise pattern in the percentile rank map, corresponding to areas of near-zero absolute change in the top-left panel.
Model Agreement
IFS-NEMO and CMIP6 agree on the lack of significant change over most land masses and tropical oceans. Strong disagreement is confined to the cryosphere (Arctic/Antarctic), where the high-resolution model likely resolves sea-ice edges, leads, and coastal polynyas that are sub-grid scale for standard CMIP6 models.
Physical Interpretation
The signal is dominated by surface flux changes associated with sea-ice retreat and variability. In transition zones, the partitioning between Latent and Sensible Heat Flux shifts dramatically as surfaces change from ice to open water. The high-resolution IFS-NEMO captures sharper gradients and more granular sea-ice dynamics, resulting in localized extremes that fall outside the broader, smoother CMIP6 envelope.
Caveats
- Extreme percentile ranks in the tropics coincide with negligible absolute changes, suggesting these statistical exceedances are due to narrow CMIP6 spreads rather than physically meaningful signal differences.
- The 'salt-and-pepper' pattern in the percentile rank plot may indicate high-frequency internal variability or regridding artifacts rather than a robust climate change signal.