Tier 2 Land–Ocean Warming Contrast CMIP6 f_out 19.5%
CMIP6 Envelope Comparison
DestinE anomalies compared to the CMIP6 P5–P95 percentile envelope derived from 51 ensemble members across 11 models under SSP3-7.0.
Contributing models: ACCESS-ESM1-5, AWI-CM-1-1-MR, CNRM-CM6-1, CNRM-ESM2-1, EC-Earth3, FGOALS-g3, GISS-E2-1-G, INM-CM5-0, IPSL-CM6A-LR, MPI-ESM1-2-LR, MRI-ESM2-0
Outside CMIP6 does not mean wrong — it indicates an uncommon response within the CMIP6 distribution.
Synthesis
Related diagnostics
Land-Ocean Warming Contrast
| Variables | avg_2t, avg_tos |
|---|---|
| Models | ifs-fesom, ifs-nemo |
| Units | K |
| Baseline | 1990-2014 |
| Future | 2040-2049 |
| Method | Ocean mask from SST availability; ΔT from avg_2t. Ratio = ΔT_land / ΔT_ocean. |
Summary high
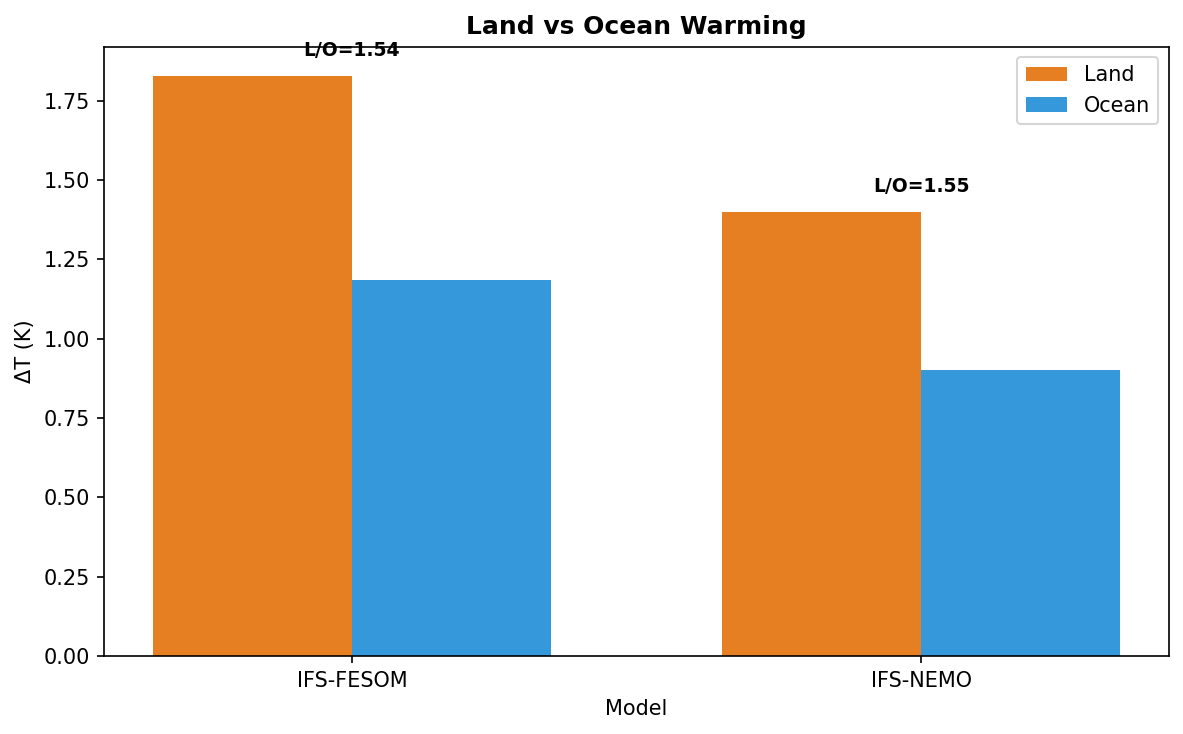
This figure compares the globally averaged surface warming over land versus ocean for IFS-FESOM, IFS-NEMO, and the CMIP6 ensemble (SSP3-7.0) between the baseline (1990–2014) and near-future (2040–2049).
Key Findings
- The Land/Ocean warming amplification ratio is remarkably consistent across all simulations (1.54 for IFS-FESOM, 1.55 for IFS-NEMO, and 1.54 for CMIP6 median).
- IFS-FESOM exhibits higher absolute warming (Land: ~1.83 K, Ocean: ~1.19 K), closely matching the CMIP6 median.
- IFS-NEMO shows significantly reduced warming (Land: ~1.40 K, Ocean: ~0.90 K), positioning it in the lower quartile of the CMIP6 distribution, though still within the P5–P95 range.
Spatial Patterns
While specific map-based spatial patterns are not shown, the figure quantifies the primary global spatial mode of warming heterogeneity: the land-ocean contrast. The data confirms that land surfaces warm roughly 55% faster than ocean surfaces in all examined models.
Model Agreement
There is excellent agreement on the warming ratio (contrast) but notable disagreement on climate sensitivity (absolute magnitude). IFS-FESOM aligns well with the CMIP6 ensemble mean, whereas IFS-NEMO is significantly 'cooler', approaching the lower bound (P5) of the CMIP6 envelope.
Physical Interpretation
The consistent Land/Ocean ratio suggests that fundamental feedback mechanisms—specifically the lower heat capacity of land and the constraint on evaporative cooling compared to the ocean—are operating similarly across models. The lower absolute warming in IFS-NEMO suggests a lower transient climate response (TCR) or effective climate sensitivity in that configuration compared to IFS-FESOM.
Caveats
- Global aggregates mask regional variations, such as polar amplification or specific regional land-sea contrasts.
- The relatively short future period (2040–2049) means internal variability could still influence the absolute warming magnitudes shown.
Temperature Change — IFS-FESOM vs CMIP6 Envelope f_out 14.8%
Envelope Metrics
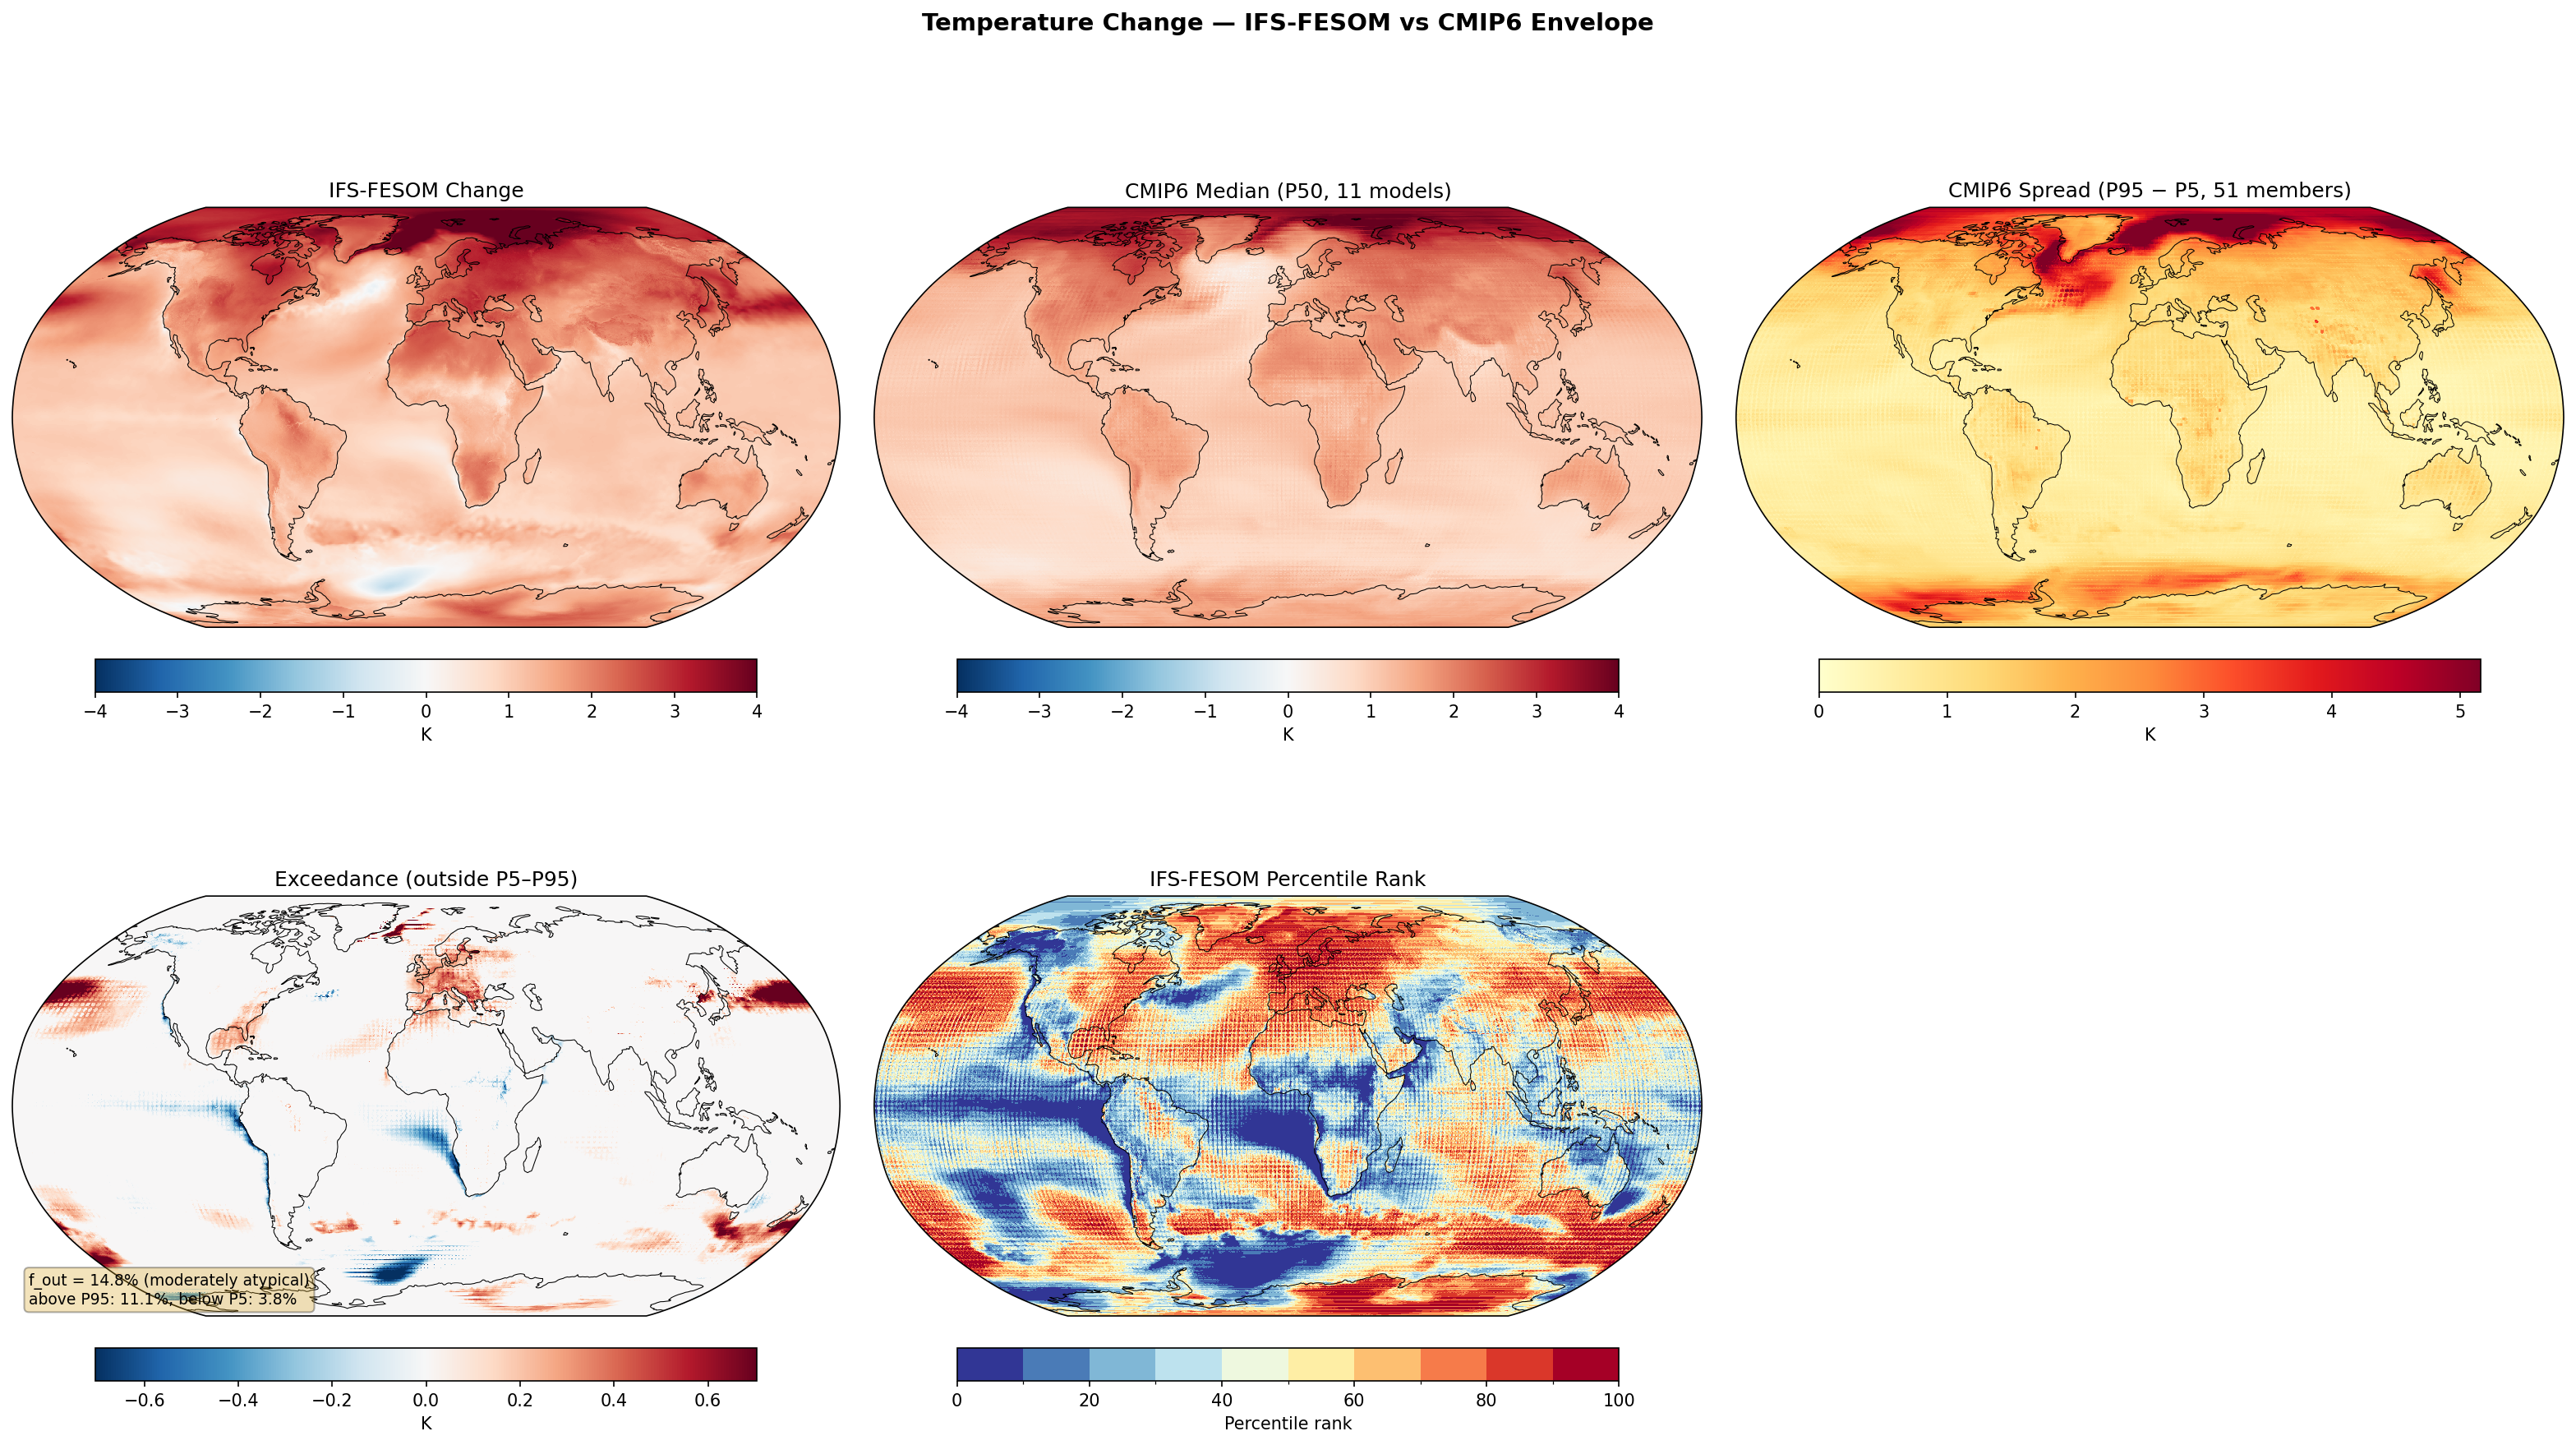
| f_out (outside P5–P95) | 14.8% moderately atypical |
|---|---|
| Above P95 | 11.1% |
| Below P5 | 3.8% |
| CMIP6 ensemble | 11 models, 51 members |
| Variables | avg_2t |
|---|---|
| Models | ifs-fesom |
| Units | K |
| Baseline | 1990-2014 |
| Future | 2040-2049 |
| Method | DestinE avg_2t change compared to CMIP6 percentile envelope (P5, P50, P95). |
Summary high
IFS-FESOM projects a moderately atypical temperature change (f_out=14.8%) compared to the CMIP6 ensemble for 2040-2049, characterized by significantly stronger warming over Europe and the Arctic, contrasting with suppressed warming in major coastal upwelling zones.
Key Findings
- The model shows enhanced warming over Europe and the Arctic Ocean, frequently exceeding the CMIP6 P95 threshold (11.1% of global area above P95).
- Distinct regions of suppressed warming (below CMIP6 P5) are evident in Eastern Boundary Upwelling Systems (Humboldt, Benguela, California currents), likely due to better-resolved ocean dynamics.
- Global warming patterns broadly agree on land-sea contrast and polar amplification, but IFS-FESOM exhibits sharper gradients and stronger regional extremes.
Spatial Patterns
The Exceedance panel reveals a distinct spatial dichotomy: 'red' zones (DestinE > CMIP6 P95) dominate the Northeast Atlantic, Europe, the North Pacific, and parts of the Southern Ocean. 'Blue' zones (DestinE < CMIP6 P5) track the eastern coasts of the ocean basins (off Chile/Peru, Namibia/South Africa, California) and parts of the South Pacific. The Percentile Rank map confirms this, showing ranks >90 in the Northern Hemisphere high latitudes and <10 in eastern ocean basins.
Model Agreement
IFS-FESOM diverges from CMIP6 primarily in regions sensitive to resolution. It agrees well in the deep tropics and broad open ocean gyres (ranks ~40-60). The disagreement is structured: IFS-FESOM is warmer in land regions prone to drying (Europe) and cooler in ocean regions driven by vertical transport (upwelling), suggesting structural added value rather than random noise.
Physical Interpretation
The 'cool' anomalies in upwelling regions relative to CMIP6 likely stem from the high-resolution ocean grid (FESOM) resolving coastal upwelling dynamics that coarse CMIP6 models miss (where unresolved physics leads to excessive warming). The strong warming over Europe and the Arctic may result from stronger sea-ice albedo feedback or different land-surface coupling (e.g., soil moisture depletion) in the high-resolution model. The North Pacific warm anomaly suggests a specific phasing of the Pacific Decadal Oscillation (PDO) different from the CMIP6 mean.
Caveats
- The analysis uses a short 10-year future window (2040-2049), making the signal susceptible to decadal internal variability (e.g., PDO, AMV phases) rather than purely forced climate change.
- f_out (14.8%) is near the threshold for 'notably atypical,' warranting caution regarding whether the European warming is a robust signal or a variability excursion.
Temperature Change — IFS-NEMO vs CMIP6 Envelope f_out 19.5%
Envelope Metrics
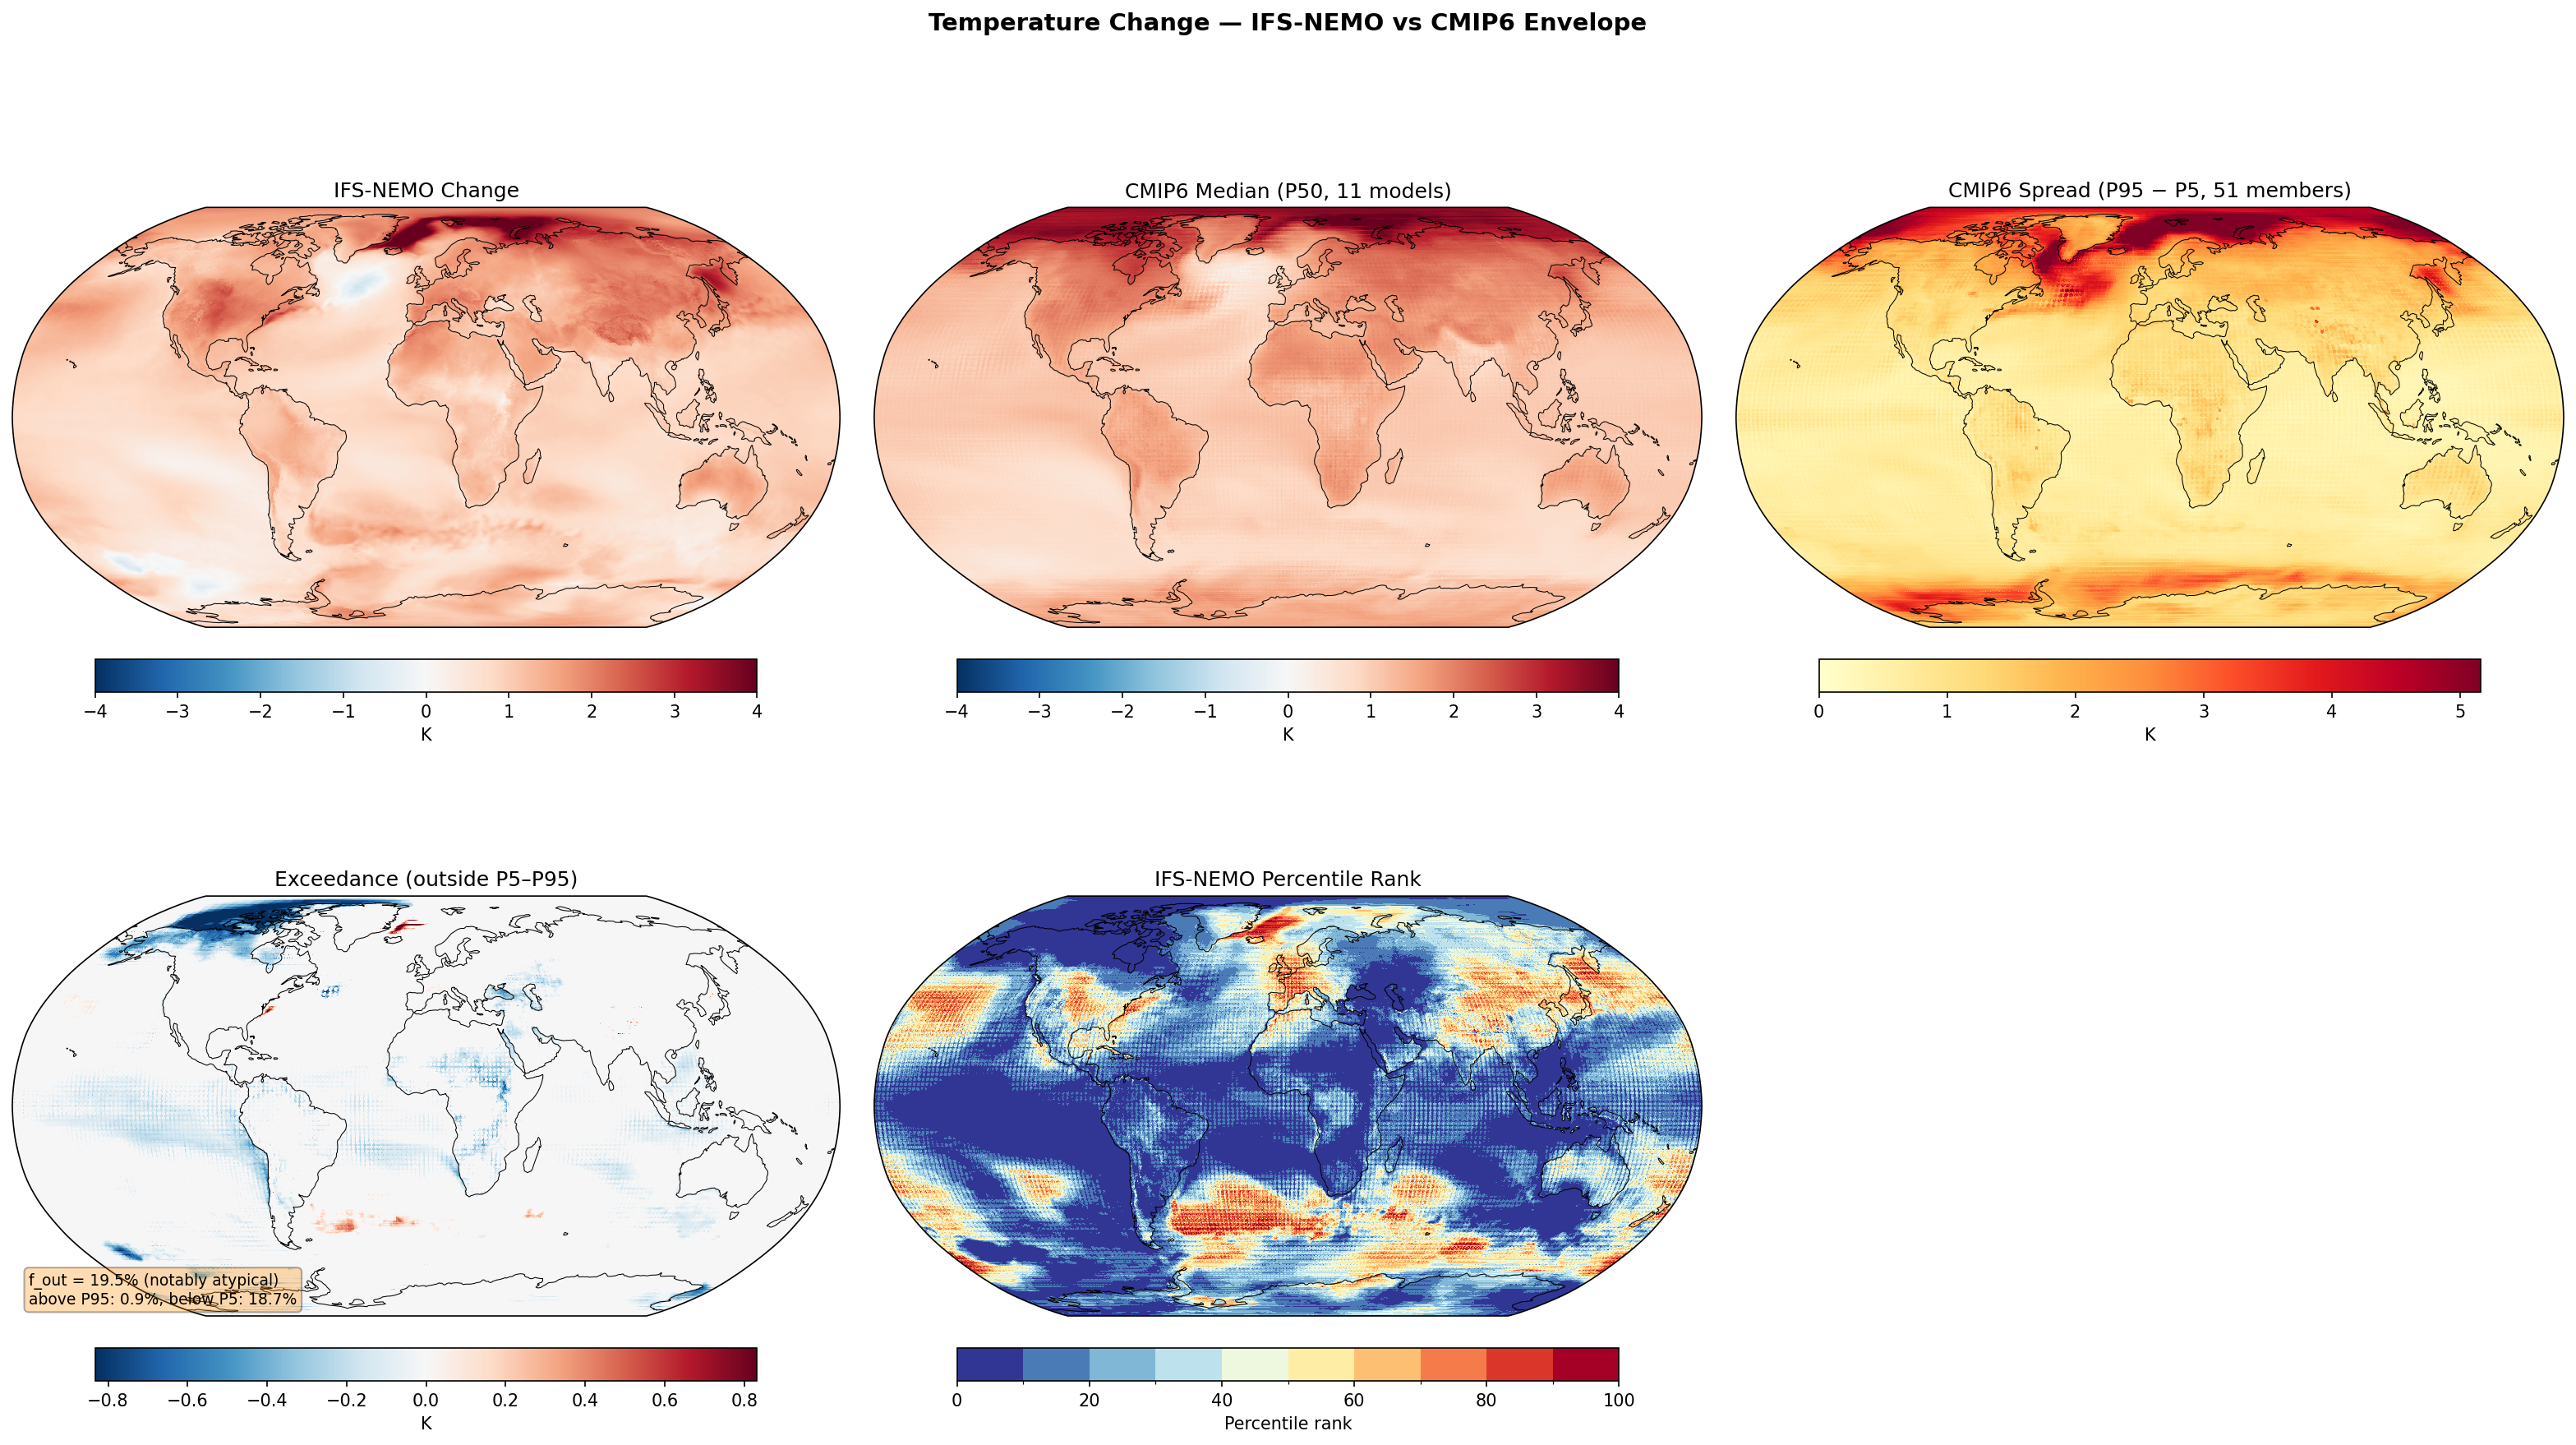
| f_out (outside P5–P95) | 19.5% notably atypical |
|---|---|
| Above P95 | 0.9% |
| Below P5 | 18.7% |
| CMIP6 ensemble | 11 models, 51 members |
| Variables | avg_2t |
|---|---|
| Models | ifs-nemo |
| Units | K |
| Baseline | 1990-2014 |
| Future | 2040-2049 |
| Method | DestinE avg_2t change compared to CMIP6 percentile envelope (P5, P50, P95). |
Summary high
IFS-NEMO exhibits a notably lower warming response than the CMIP6 ensemble for the 2040-2049 period, with 19.5% of the global surface area falling outside the P5-P95 envelope, dominated almost exclusively by values below the CMIP6 5th percentile.
Key Findings
- Global 'Cold' Anomaly relative to CMIP6: 18.7% of the total area falls below the CMIP6 P5 threshold, indicating IFS-NEMO warms significantly less than the multi-model ensemble, particularly over the oceans.
- Intensified North Atlantic Warming Hole: IFS-NEMO projects a strong cooling signal in the subpolar North Atlantic that exceeds the cooling/weak warming range seen in 95% of CMIP6 models.
- Land-Sea Contrast: While ocean basins are largely below the CMIP6 P5 percentile, continental warming over Eurasia, Africa, and the Americas generally falls within the standard CMIP6 envelope (P5-P95), suggesting the discrepancy is ocean-driven.
Spatial Patterns
The 'below P5' exceedance (blue) covers vast swathes of the global ocean, specifically the North Atlantic, North Pacific, and Southern Ocean. In contrast, the Arctic exhibits strong warming consistent with CMIP6 (within envelope), and continental regions show typical warming patterns. A distinct localized cooling feature is evident south of Greenland.
Model Agreement
IFS-NEMO agrees with CMIP6 on the general pattern of Arctic amplification and continental warming (percentile ranks 20-80). Significant disagreement occurs over the oceans, where IFS-NEMO consistently sits at the very bottom of the distribution (percentile ranks <10), indicating a systematic difference in ocean surface warming rates.
Physical Interpretation
The widespread suppressed surface warming over oceans suggests efficient vertical heat mixing in the high-resolution NEMO ocean (eddy-permitting), transporting heat to depth more effectively than coarser CMIP6 models, or a generally lower transient climate sensitivity (TCR). The pronounced North Atlantic cooling hole likely reflects a stronger slowdown of the Atlantic Meridional Overturning Circulation (AMOC) or distinct subpolar gyre dynamics resolved at ~5 km resolution that are averaged out in standard resolution models.
Caveats
- The widespread oceanic 'cold' signal relative to CMIP6 could indicate model drift or initialization shock if the ocean spin-up was insufficient.
- The analysis period (2040-2049) is relatively near-term; internal variability in the high-resolution model could heavily influence the comparison against the ensemble mean.
Temperature Change Map
| Variables | avg_2t |
|---|---|
| Models | ifs-fesom, ifs-nemo, CMIP6-MMM |
| Units | K |
| Baseline | 1990-2014 |
| Future | 2040-2049 |
| Method | Future mean minus historical mean of avg_2t. |
Summary high
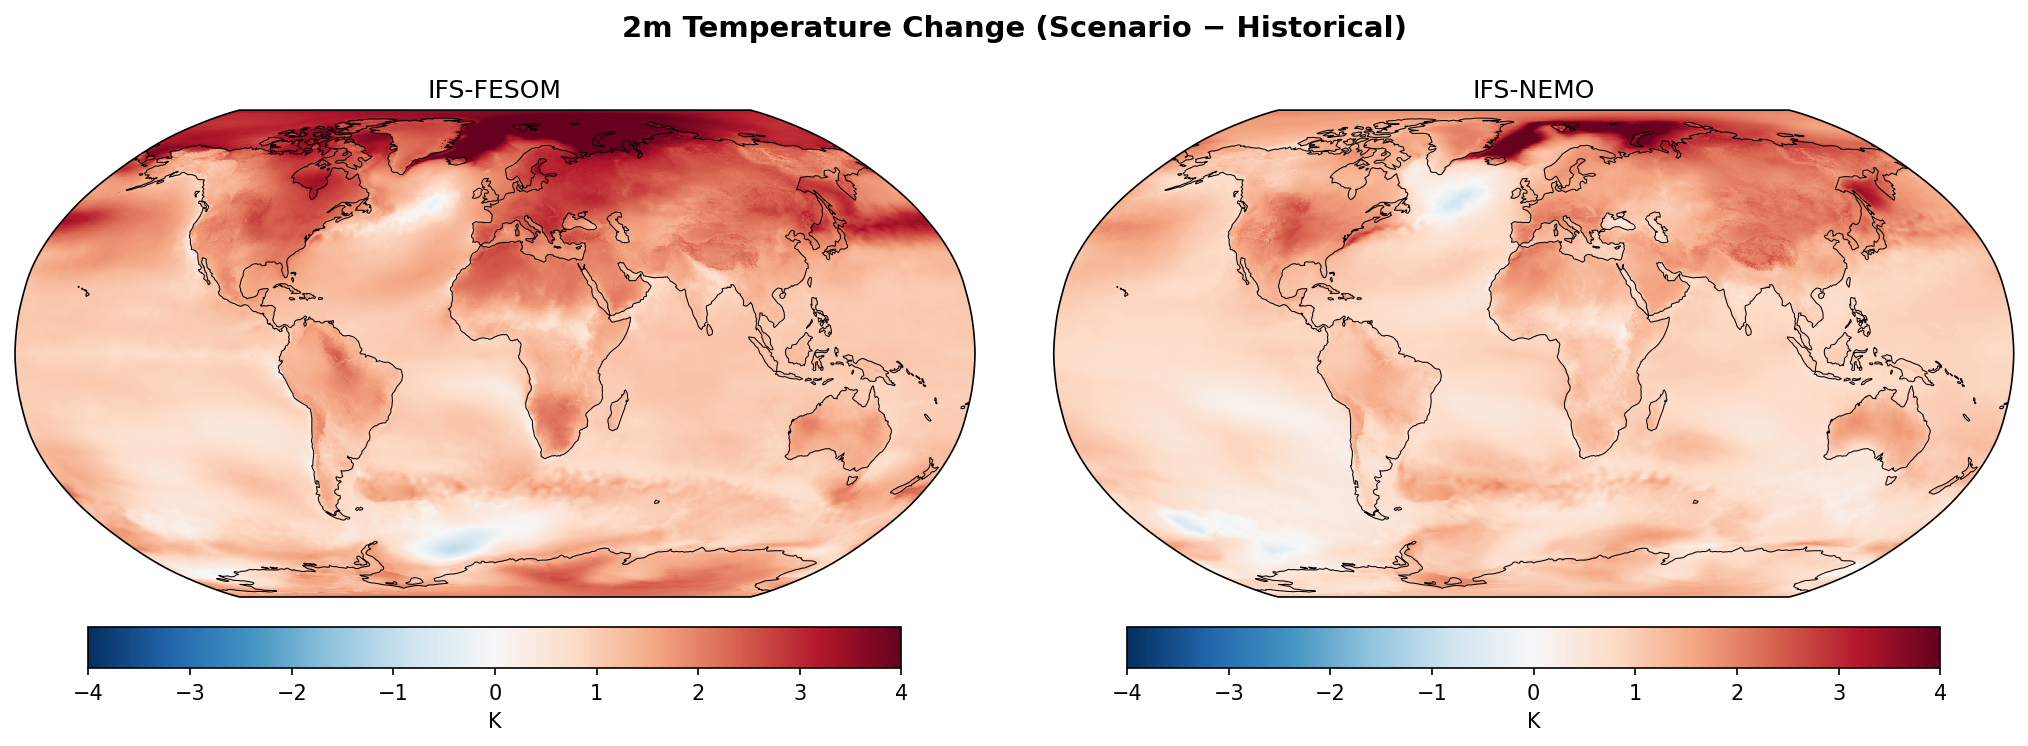
This figure compares projected near-term surface temperature changes (2040–2049 vs 1990–2014) from two high-resolution DestinE models (IFS-FESOM, IFS-NEMO) against the CMIP6 multi-model mean. While all panels show robust global warming, Arctic amplification, and land-sea contrast, the high-resolution models reveal distinct localized cooling features in the North Atlantic and Southern Ocean that are smoothed out in the CMIP6 mean.
Key Findings
- Arctic Amplification is the dominant feature in all models, with warming exceeding +4 K in the high northern latitudes.
- IFS-NEMO exhibits a pronounced 'warming hole' (absolute cooling) in the subpolar North Atlantic, which is stronger than in IFS-FESOM and appears only as reduced warming in the CMIP6-MMM.
- Both DestinE models show localized cooling patches in the Southern Ocean, but in different locations: IFS-FESOM in the Weddell Sea sector and IFS-NEMO in the Amundsen/Bellingshausen sector.
- Land-sea warming contrast is clearly resolved, with continents warming significantly faster (~1.5–3 K) than adjacent mid-latitude oceans (~0.5–1 K).
Spatial Patterns
The broad pattern is global warming intensifying from the equator to the poles. The IFS models show granular detail over land, resolving topographic effects on warming (e.g., over the Andes and Himalayas) absent in the smoother CMIP6-MMM. The most notable deviations are the blue cooling regions (~-1 to -2 K) in the high-latitude oceans of the IFS models, contrasting with the almost universally red/orange CMIP6 field.
Model Agreement
There is strong agreement on the large-scale thermodynamic response (general warming, polar amplification). Disagreement is focused on dynamic ocean features: the location and intensity of the North Atlantic warming hole and Southern Ocean convection sites vary significantly between the two ocean models (FESOM vs. NEMO) and are distinct from the smoother CMIP6 ensemble mean.
Physical Interpretation
The North Atlantic 'warming hole' is physically consistent with a slowdown of the Atlantic Meridional Overturning Circulation (AMOC), reducing northward heat transport. The high-resolution models may resolve this dynamic or associated gyre changes more sharply than the coarse CMIP6 mean. Southern Ocean cooling spots likely reflect deep vertical mixing or sea-ice dynamics specific to the ocean grid geometry (unstructured vs. structured) and heat uptake efficiency in those regions.
Caveats
- The IFS panels represent single realizations, including internal variability (weather noise), whereas CMIP6-MMM averages this out.
- Differences in Southern Ocean cooling locations may stem from different ocean grid structures (FESOM vs NEMO) affecting deep water formation sites.