Tier 1 Ocean Heat Content
Synthesis
Related diagnostics
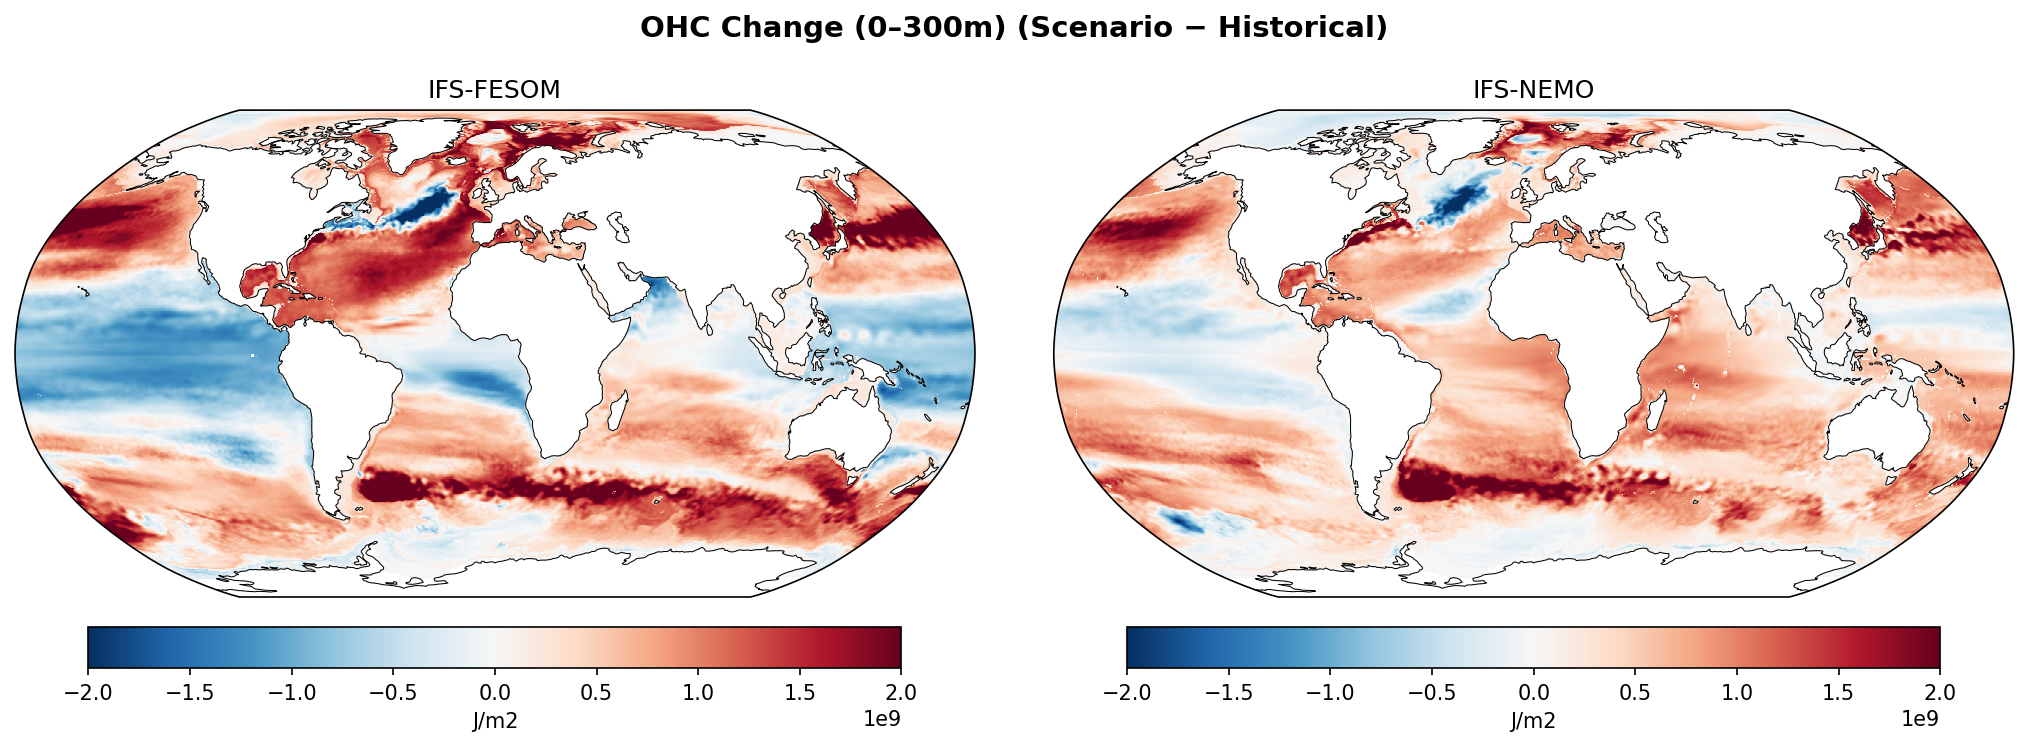
OHC Change (0–300m)
| Variables | avg_hc300m |
|---|---|
| Models | ifs-fesom, ifs-nemo |
| Units | J/m2 |
| Baseline | 1990-2014 |
| Future | 2040-2049 |
| Method | Future mean minus historical mean. |
Summary medium
This figure compares the projected change in upper-ocean heat content (0–300m) between the near-future (2040–2049) and historical baseline (1990–2014) for two high-resolution coupled models, IFS-FESOM and IFS-NEMO. While both models agree on high-latitude features, they exhibit a striking disagreement in the Tropical Pacific response.
Key Findings
- Both models exhibit a robust North Atlantic 'warming hole' (cooling trend south of Greenland), consistent with AMOC slowdown signatures.
- IFS-FESOM projects widespread cooling in the Tropical and Subtropical Pacific (La Niña-like pattern), whereas IFS-NEMO projects warming (El Niño-like pattern).
- Strong heat accumulation is evident in Western Boundary Current regions (Gulf Stream, Kuroshio) and the Southern Ocean in both models.
- IFS-FESOM generally displays sharper spatial gradients and more intense local extremes than IFS-NEMO, particularly in the eddy-rich Southern Ocean.
Spatial Patterns
The North Atlantic features a distinct dipole: cooling in the subpolar gyre and intense warming in the Gulf Stream extension. The Southern Ocean shows a band of high heat uptake, particularly in the Atlantic and Indian sectors, associated with the Antarctic Circumpolar Current. The most significant pattern difference is the broad tongue of negative OHC change (cooling) in the equatorial and off-equatorial Pacific in IFS-FESOM, contrasted with general warming in IFS-NEMO.
Model Agreement
There is high agreement in the extratropics, specifically regarding the North Atlantic warming hole and Southern Ocean heat uptake. There is low agreement in the tropics, particularly the Pacific basin. The disagreement in the Tropical Pacific—cooling in FESOM vs warming in NEMO—is significant.
Physical Interpretation
The North Atlantic cooling indicates a weakening Atlantic Meridional Overturning Circulation (AMOC), reducing northward heat transport. The Southern Ocean warming reflects efficient heat uptake due to wind-driven upwelling and eddy mixing, which is well-resolved at this resolution. The Tropical Pacific discrepancy likely stems from either structural differences in the 'dynamical thermostat' mechanism (upwelling of cold deep water counteracting radiative forcing) or, more likely given the short 10-year future window, unforced decadal variability (e.g., differing ENSO phase dominance in the 2040-2049 period).
Caveats
- The future averaging period (2040–2049) is only 10 years, making the analysis highly susceptible to internal variability (e.g., ENSO cycles) rather than purely forced climate trends.
- The strong cooling in the FESOM Pacific might differ from the long-term equilibrium response.
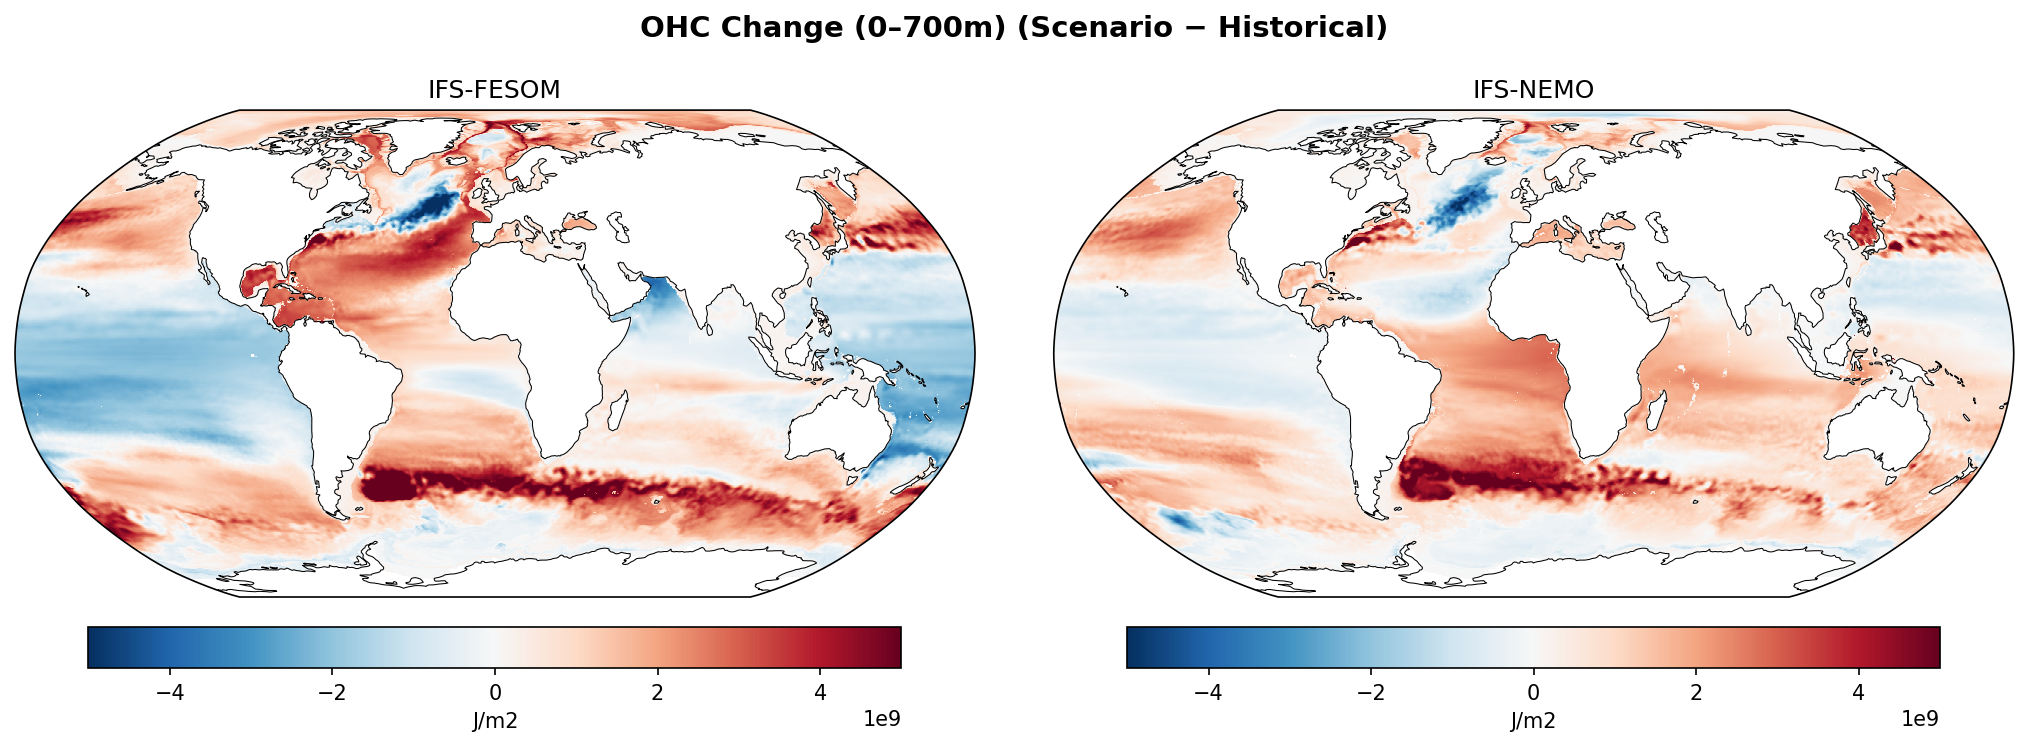
OHC Change (0–700m)
| Variables | avg_hc700m |
|---|---|
| Models | ifs-fesom, ifs-nemo |
| Units | J/m2 |
| Baseline | 1990-2014 |
| Future | 2040-2049 |
| Method | Future mean minus historical mean. |
Summary medium
Both models project upper-ocean heat content changes dominated by dynamic adjustments, including a North Atlantic warming hole and intense heat uptake along the Southern Ocean ACC. However, they diverge significantly in the Tropical Pacific, likely due to internal variability phases impacting the short 10-year future window.
Key Findings
- Both IFS-FESOM and IFS-NEMO display a prominent 'warming hole' (cooling signal) in the North Atlantic subpolar gyre, consistent with AMOC slowdown.
- Strong, filamentary heat uptake is observed along the Antarctic Circumpolar Current (ACC) and western boundary currents (Gulf Stream, Kuroshio) in both models.
- A major discrepancy exists in the Tropical Pacific: IFS-FESOM shows broad cooling (relative to baseline), suggesting a La Niña-like or negative IPO pattern, whereas IFS-NEMO shows widespread warming.
- IFS-NEMO projects widespread warming in the Indian Ocean, contrasting with the mixed/cooling signal seen in IFS-FESOM.
Spatial Patterns
The maps are characterized by fine-scale, eddy-rich structures rather than smooth diffusive patterns. Notable features include the dipole in the North Atlantic (cooling south of Greenland, warming in the Gulf Stream extension) and the zonal band of intense warming traversing the Southern Ocean.
Model Agreement
The models agree well on the structural response of the Atlantic (AMOC fingerprint) and the Southern Ocean (eddy-driven heat uptake). They disagree substantially in the tropics (Pacific and Indian Oceans), likely reflecting different realizations of internal variability (e.g., ENSO/IPO phase) rather than purely forced climate response.
Physical Interpretation
The North Atlantic cooling indicates a reduction in northward heat transport due to AMOC weakening. The intense Southern Ocean warming highlights the role of resolved mesoscale eddies in transferring heat into the interior under shifting westerly winds. The Pacific contrast implies IFS-FESOM may be in a cool IPO phase during the 2040s, dampening the anthropogenic warming signal there, while IFS-NEMO is not.
Caveats
- The future averaging period (2040–2049) is short (10 years), meaning decadal internal variability (IPO, AMOC fluctuations) can strongly overprint the forced climate change signal.
- Without a control run for drift correction, some trends (especially in the Southern Ocean) could partly include model drift, though the pattern is physically consistent with warming scenarios.
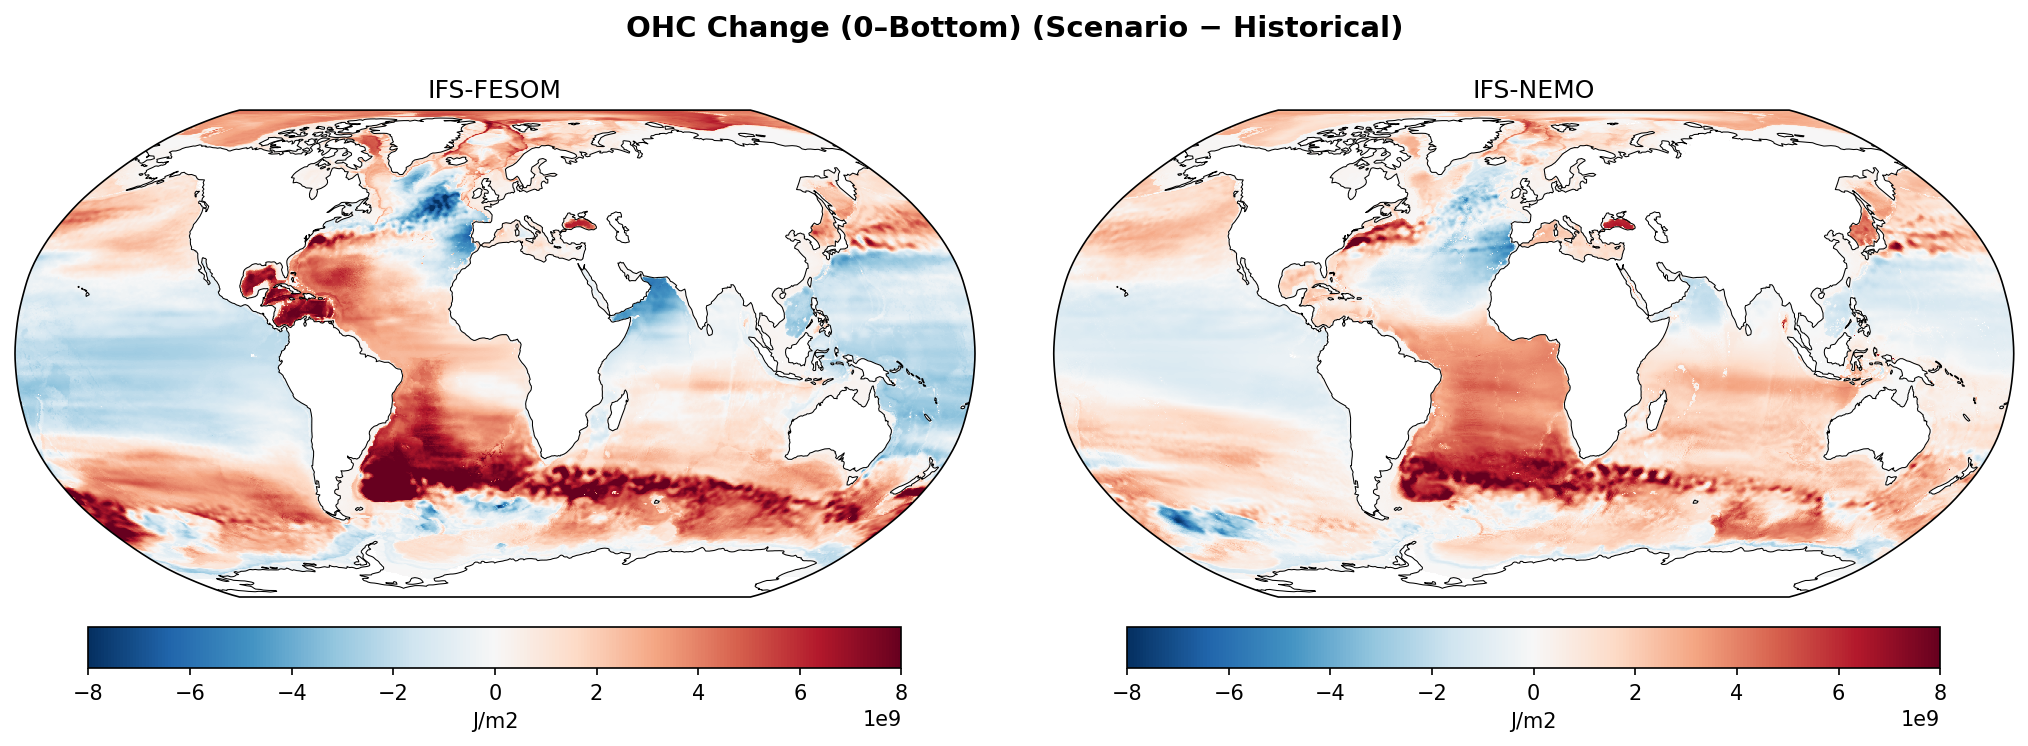
OHC Change (0–Bottom)
| Variables | avg_hcbtm |
|---|---|
| Models | ifs-fesom, ifs-nemo |
| Units | J/m2 |
| Baseline | 1990-2014 |
| Future | 2040-2049 |
| Method | Future mean minus historical mean. |
Summary high
Comparison of depth-integrated Ocean Heat Content (OHC) change (2040–2049 vs 1990–2014) between IFS-FESOM and IFS-NEMO, highlighting robust agreement on high-latitude dynamic responses but significant divergence in subtropical heat storage.
Key Findings
- Both models identify the Southern Ocean (40°S–60°S) as the primary global sink for ocean heat uptake, featuring intense, eddy-resolving warming bands.
- A distinct 'warming hole' (negative OHC change) is visible in the subpolar North Atlantic in both models, consistent with an AMOC slowdown signature, though spatially larger in IFS-FESOM.
- IFS-FESOM and IFS-NEMO diverge significantly in the subtropical Pacific and Indian Oceans; FESOM shows widespread heat loss (blue) while NEMO shows warming or neutral conditions.
- Western Boundary Currents (Gulf Stream, Kuroshio) exhibit concentrated heat accumulation hotspots in both simulations.
Spatial Patterns
The Southern Ocean is dominated by zonally oriented, high-magnitude warming streaks associated with the Antarctic Circumpolar Current. The North Atlantic exhibits a strong dipole: intense heat accumulation in the subtropical gyre/Gulf Stream versus heat loss in the subpolar gyre. A notable pattern difference appears in the subtropical gyres of the Pacific and Indian basins, where IFS-FESOM displays negative anomalies (cooling) contrasting with the positive anomalies (warming) in IFS-NEMO.
Model Agreement
Models agree on the dynamical responses in the Atlantic (AMOC decline) and Southern Ocean (ventilation). Disagreement is pronounced in the quiescent subtropical gyres of the Indo-Pacific, suggesting structural differences in vertical mixing, thermocline adjustment, or wind-stress coupling implementations between the finite-volume (FESOM) and finite-difference (NEMO) cores.
Physical Interpretation
The Southern Ocean uptake is likely driven by intensified westerlies and eddy fluxes subducting heat into mode waters. The North Atlantic cooling signal confirms reduced northward heat transport due to AMOC weakening. The discrepancy in the Pacific subtropics may result from differing responses to wind-driven Ekman pumping (isopycnal heave) or internal decadal variability phases (e.g., PDO) being realized differently in the two coupled systems.
Caveats
- The 10-year future window (2040–2049) makes the analysis susceptible to decadal internal variability, which may conflate with the forced signal, particularly in the Pacific.
- Without explicit drift correction information, it is unclear how much of the deep ocean signal (contributing to 0-Bottom OHC) is due to model drift versus forced response.