Tier 2 Seasonal Amplitude Change CMIP6 f_out 21.0%
CMIP6 Envelope Comparison
DestinE anomalies compared to the CMIP6 P5–P95 percentile envelope derived from 51 ensemble members across 11 models under SSP3-7.0.
Contributing models: ACCESS-ESM1-5, AWI-CM-1-1-MR, CNRM-CM6-1, CNRM-ESM2-1, EC-Earth3, FGOALS-g3, GISS-E2-1-G, INM-CM5-0, IPSL-CM6A-LR, MPI-ESM1-2-LR, MRI-ESM2-0
Outside CMIP6 does not mean wrong — it indicates an uncommon response within the CMIP6 distribution.
Synthesis
Related diagnostics
Seasonal Amplitude Change — IFS-FESOM vs CMIP6 Envelope f_out 21.0%
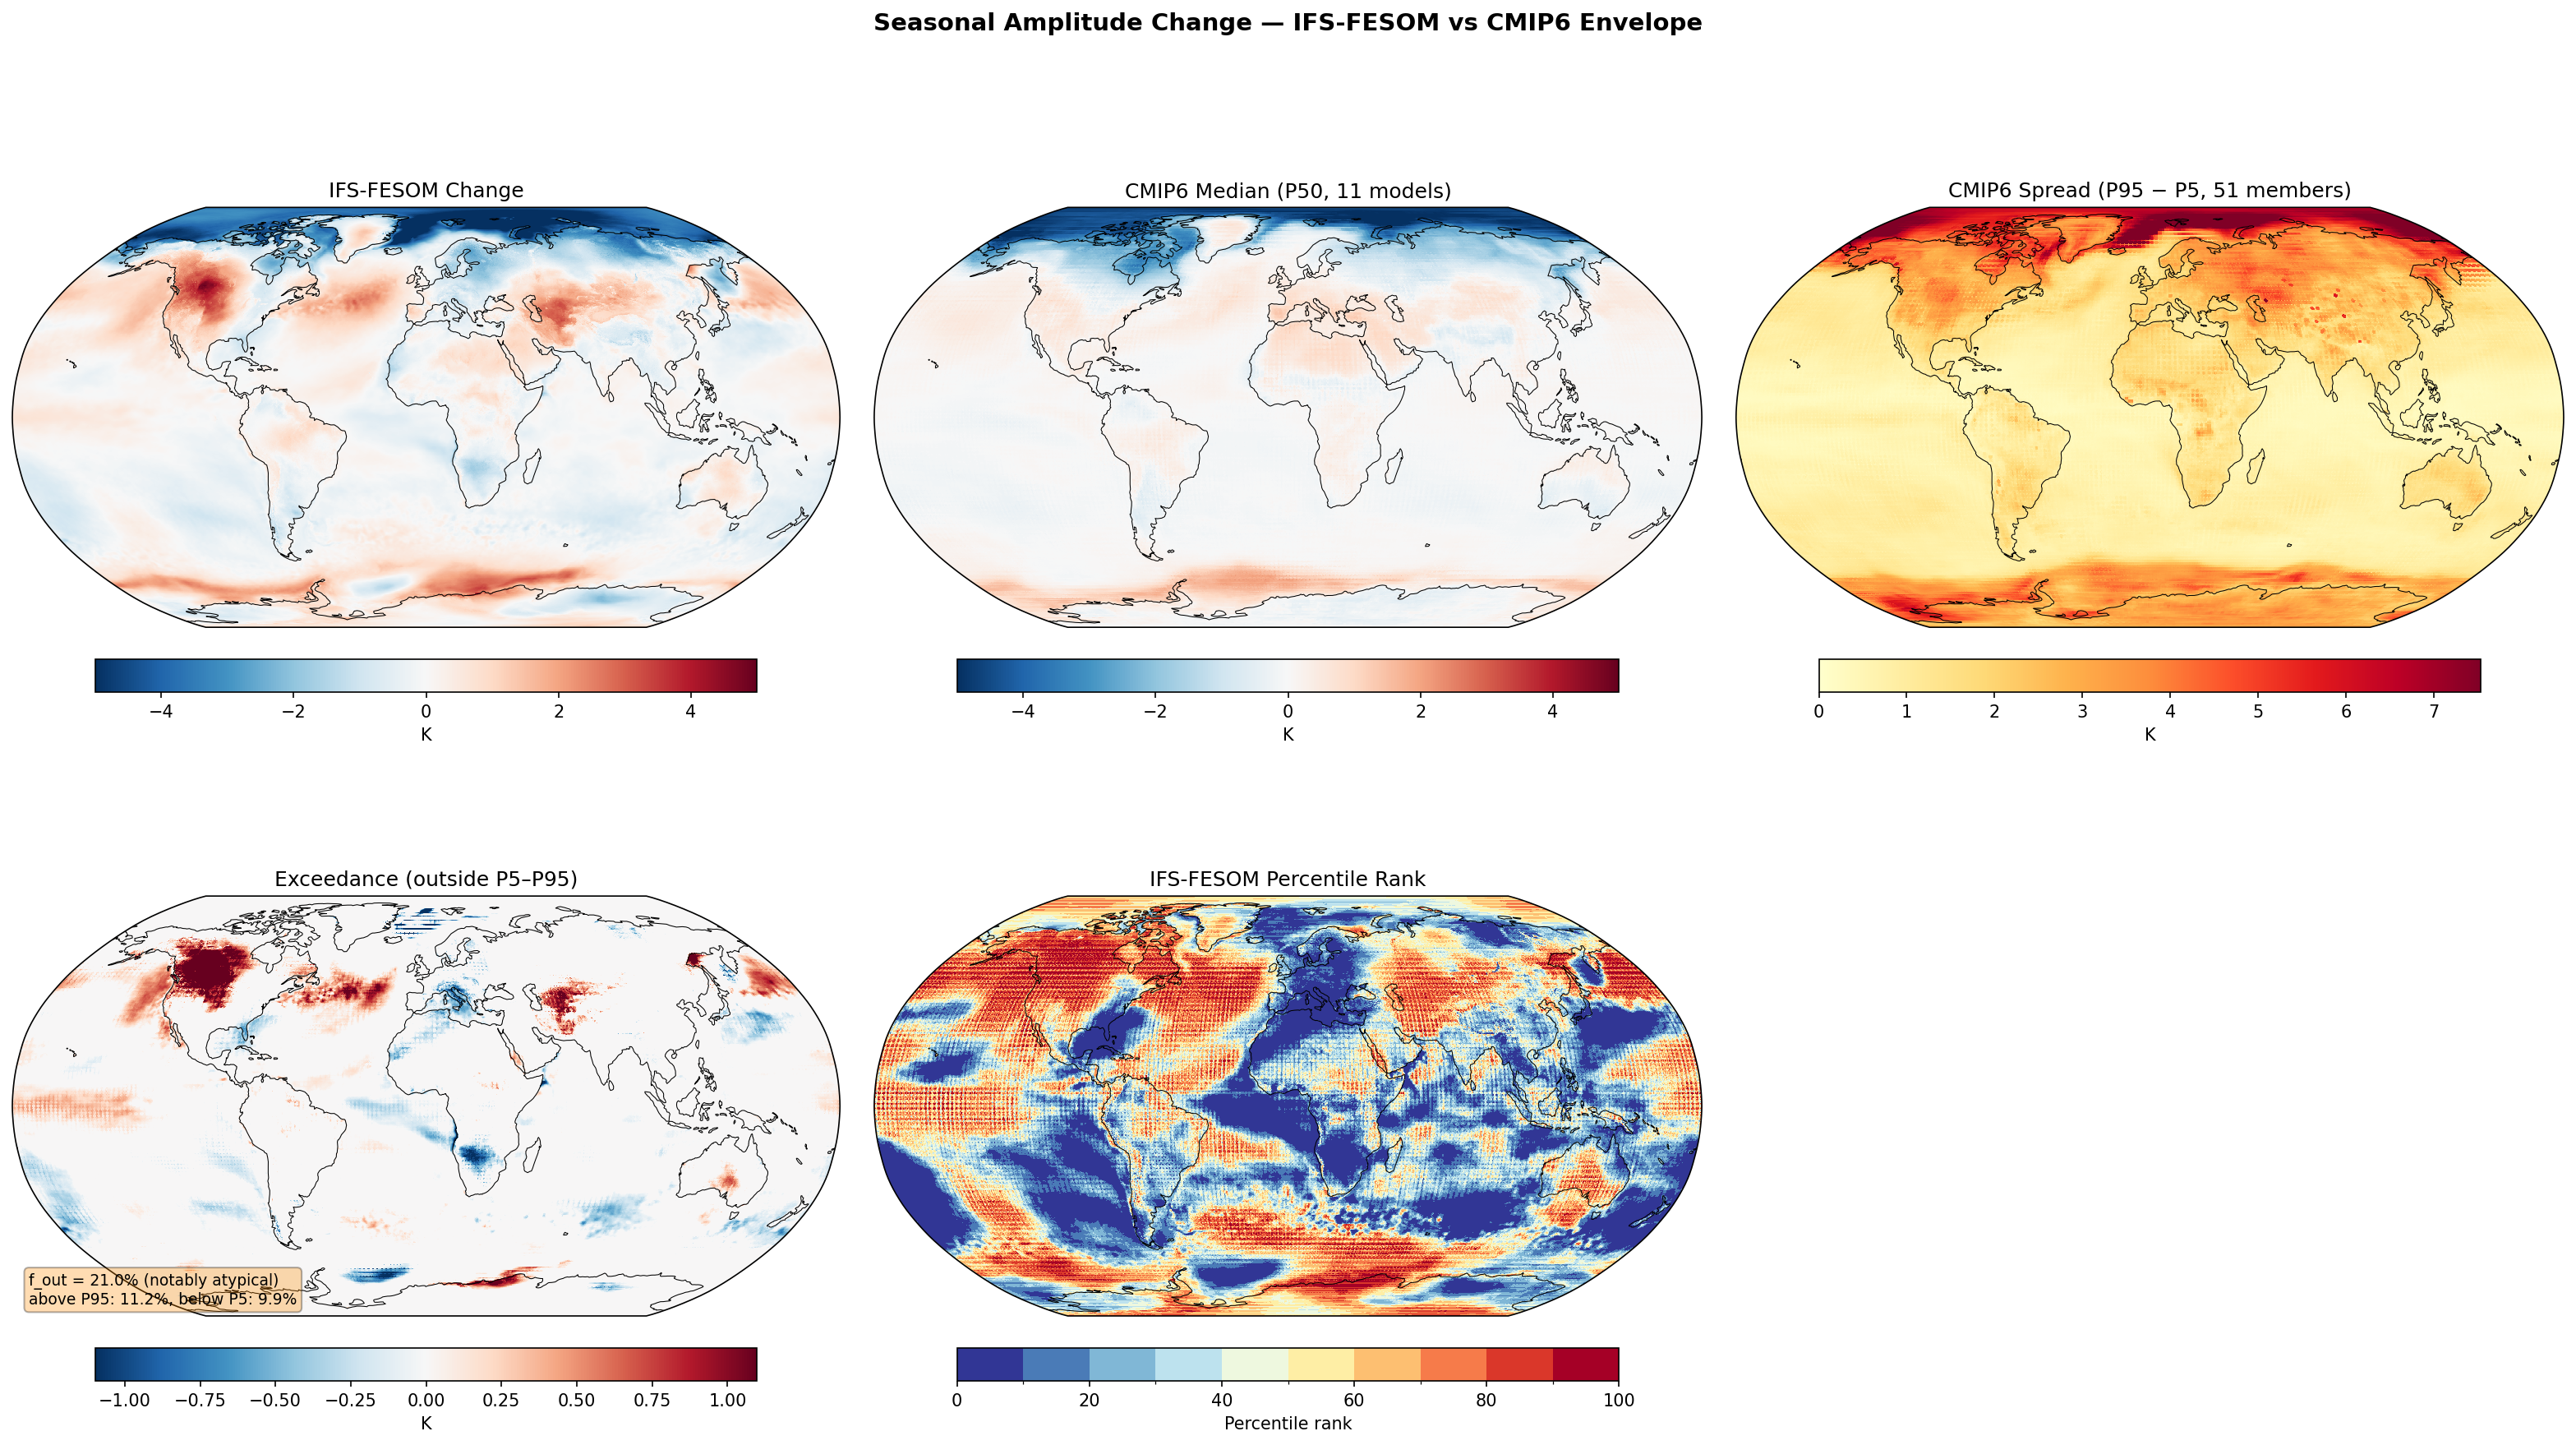
Envelope Metrics
| f_out (outside P5–P95) | 21.0% notably atypical |
|---|---|
| Above P95 | 11.2% |
| Below P5 | 9.9% |
| CMIP6 ensemble | 11 models, 51 members |
| Variables | avg_2t |
|---|---|
| Models | ifs-fesom |
| Units | K |
| Baseline | 1990-2014 |
| Future | 2040-2049 |
| Method | Amplitude = T_JJA − T_DJF; ΔAmplitude = amp_future − amp_hist. Compared to CMIP6 percentile envelope (P5, P50, P95). |
Summary high
IFS-FESOM projects a markedly stronger increase in seasonal temperature amplitude over Northern Hemisphere continents compared to the CMIP6 ensemble, resulting in a 'notably atypical' deviation ($f_{out} = 21.0\%$).
Key Findings
- IFS-FESOM predicts a substantial increase in seasonal amplitude ($T_{JJA} - T_{DJF}$) over North America and Eurasia, often exceeding the CMIP6 P95 percentile (red in Exceedance panel).
- In the Arctic Ocean, the model shows a strong decrease in seasonal amplitude, consistent with winter-dominant Arctic Amplification, though the spatial structure is sharper than the CMIP6 median.
- The model exhibits notable areas of reduced seasonality (blue in Exceedance) in the North Atlantic and parts of the Southern Ocean, falling below the CMIP6 P5 threshold.
- The global fraction of atypical points is 21.0%, with a balanced split between regions exceeding P95 (11.2%) and falling below P5 (9.9%).
Spatial Patterns
The dominant pattern is a contrast between Northern Hemisphere land masses (strong positive change/red) and high-latitude oceans (strong negative change/blue). Specifically, broad swathes of Canada, the US, Central Europe, and Russia show amplitude increases of >2-4 K. Conversely, the Arctic basin and North Atlantic warming hole region show amplitude decreases.
Model Agreement
IFS-FESOM diverges significantly from the CMIP6 median over mid-latitude land, where CMIP6 shows negligible or weak amplitude change while IFS-FESOM shows strong intensification. Agreement is better in the Arctic (sign agreement on reduction), though IFS-FESOM shows finer-scale features likely due to higher resolution sea-ice/ocean dynamics.
Physical Interpretation
The strong increase in seasonality over land likely reflects land-surface feedbacks (e.g., summer drying leading to enhanced JJA warming) being stronger in IFS-FESOM than the CMIP6 average. The decrease in the Arctic is a standard signature of Arctic Amplification (loss of sea ice insulation causes winters to warm faster than summers). The North Atlantic signal may relate to AMOC dynamics or local cooling (warming hole) affecting seasonal heat transport.
Caveats
- The 10-year window (2040-2049) may be influenced by internal decadal variability, potentially exaggerating the contrast with the smoothed CMIP6 envelope.
- The intense land signal warrants investigation into soil moisture-temperature coupling parameterizations to ensure summer warming is not excessive.
Seasonal Amplitude Change — IFS-NEMO vs CMIP6 Envelope f_out 12.5%
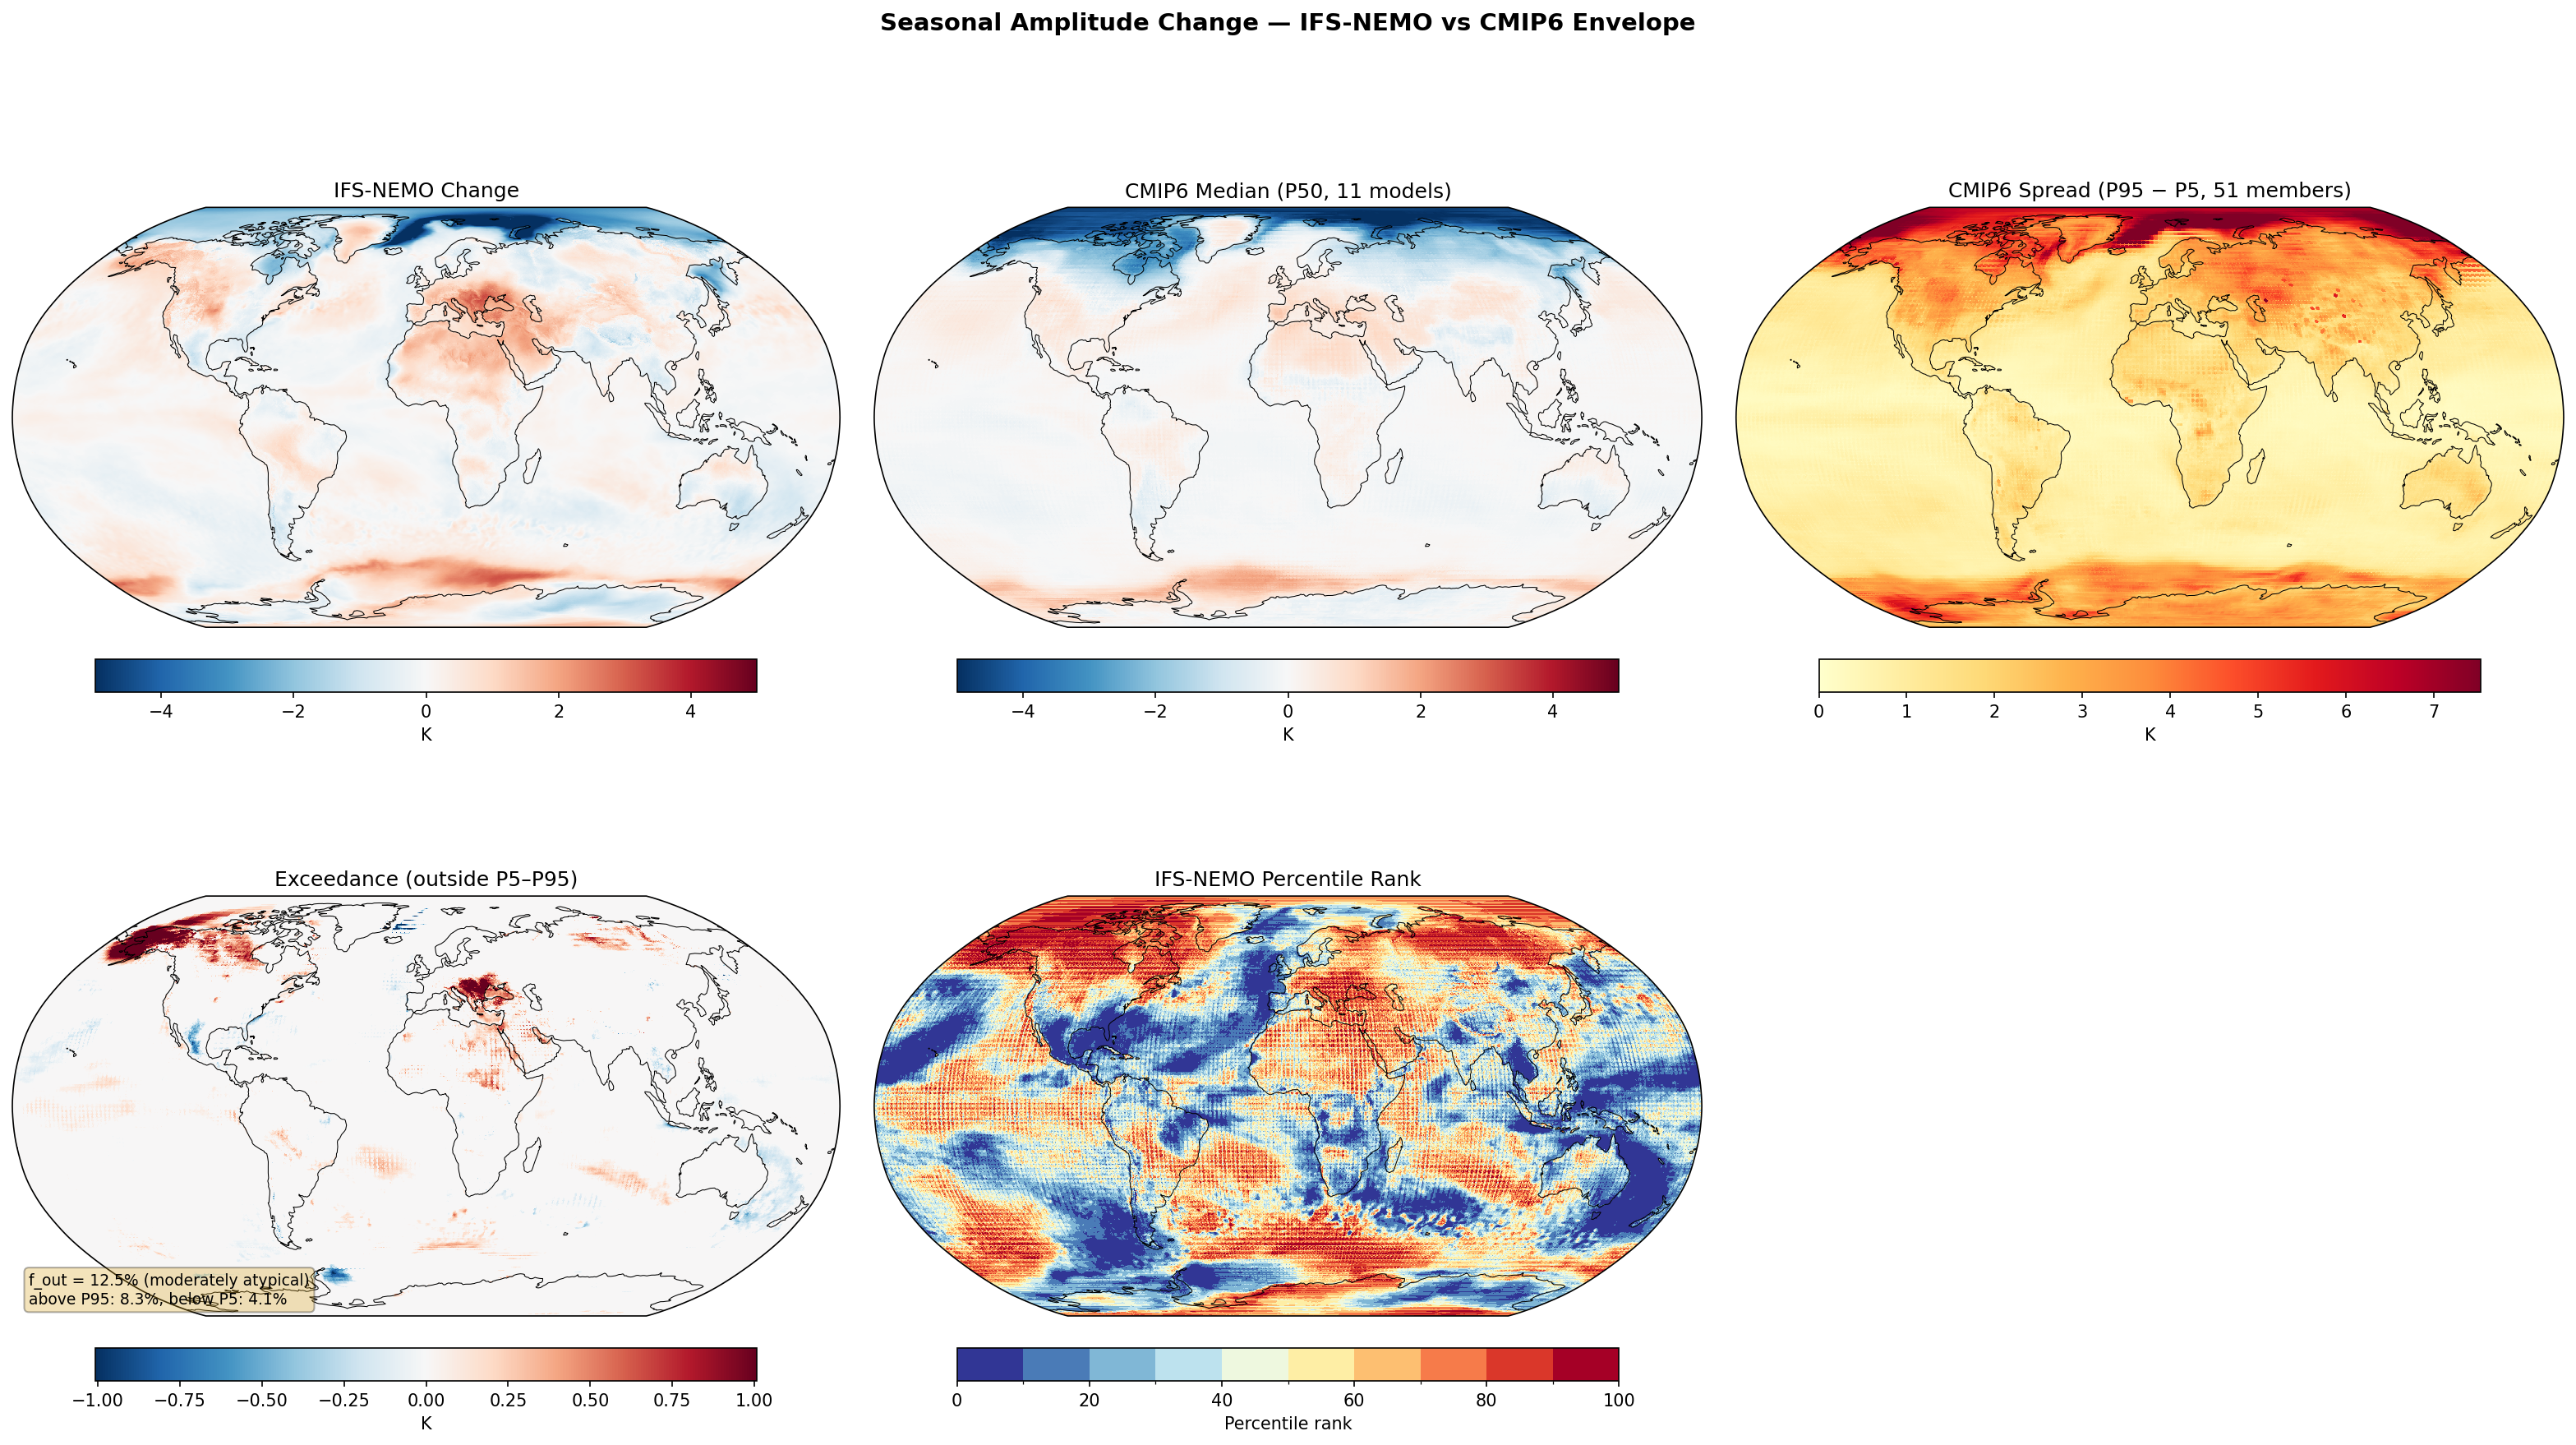
Envelope Metrics
| f_out (outside P5–P95) | 12.5% moderately atypical |
|---|---|
| Above P95 | 8.3% |
| Below P5 | 4.1% |
| CMIP6 ensemble | 11 models, 51 members |
| Variables | avg_2t |
|---|---|
| Models | ifs-nemo |
| Units | K |
| Baseline | 1990-2014 |
| Future | 2040-2049 |
| Method | Amplitude = T_JJA − T_DJF; ΔAmplitude = amp_future − amp_hist. Compared to CMIP6 percentile envelope (P5, P50, P95). |
Summary high
IFS-NEMO projects a reduction in seasonal amplitude at high latitudes (winter warming dominance) and an amplification over mid-latitude land (summer warming dominance), with a notably stronger amplification signal over Europe and North Africa compared to the CMIP6 ensemble.
Key Findings
- IFS-NEMO shows moderately atypical behaviour (f_out = 12.5%), with 8.3% of the global area showing changes above the CMIP6 P95 threshold.
- Strong exceedance (red) is observed over Europe, the Mediterranean, and North Africa, indicating IFS-NEMO projects significantly greater seasonal amplification (hotter summers relative to winters) than 95% of CMIP6 models.
- The Arctic Ocean exhibits strong negative amplitude change (reduced seasonality due to winter warming), consistent with the CMIP6 median but with localized differences in the sea-ice retreat zones.
- The Southern Ocean displays zonal bands of positive change (relative winter warming), where IFS-NEMO frequently exceeds the CMIP6 upper bound.
Spatial Patterns
The map is characterized by strong negative changes (blue) in the Arctic and parts of the North Atlantic, indicating winter warming outpacing summer warming. Conversely, land masses in the Northern Hemisphere, particularly Europe, North Africa, and Western North America, show positive changes (red), indicating summer warming outpacing winter warming. The Southern Ocean shows a distinct zonal band of positive change.
Model Agreement
IFS-NEMO agrees with the broad CMIP6 consensus on the sign of change: reduced seasonality in the Arctic (winter polar amplification) and increased seasonality over mid-latitude land. However, it disagrees on magnitude in the Euro-Mediterranean region, where IFS-NEMO lies above the P95 percentile (rank ~100), suggesting a more intense summer drying/warming feedback than the standard CMIP6 ensemble.
Physical Interpretation
The negative change in the Arctic results from sea-ice loss allowing ocean heat release in winter (warming DJF more than JJA). The positive change (amplification) over Europe is likely driven by soil moisture-temperature feedbacks, where summer drying leads to intensified peak temperatures; the high resolution of IFS-NEMO may better resolve these land-atmosphere coupling processes or simply exhibit a stronger drying trend. The Southern Ocean patterns likely reflect shifts in the Antarctic sea-ice edge affecting winter heat flux.
Caveats
- The strong exceedance in Europe could indicate realistic added value from high-resolution topography and land physics, or it could signal a 'hot model' bias in summer processes.
- The analysis period (2040-2049) is relatively short (10 years), so internal decadal variability may contribute to the differences compared to the larger CMIP6 ensemble.
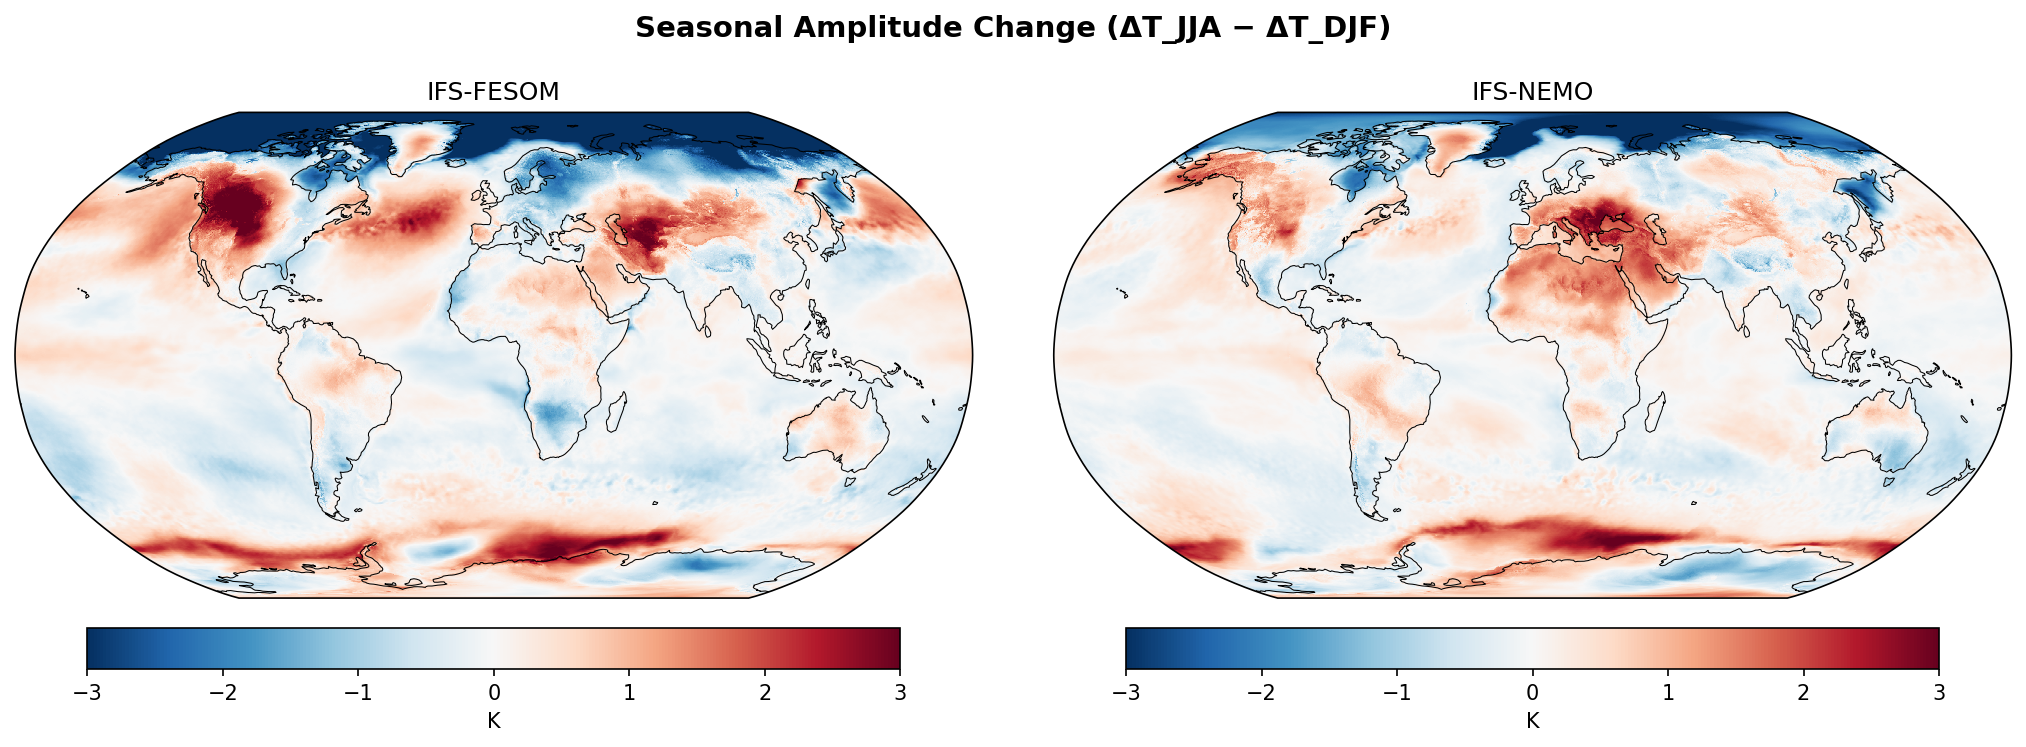
Seasonal Amplitude Change
| Variables | avg_2t |
|---|---|
| Models | ifs-fesom, ifs-nemo, CMIP6-MMM |
| Units | K |
| Baseline | 1990-2014 |
| Future | 2040-2049 |
| Method | Amplitude = T_JJA − T_DJF; ΔAmplitude = amp_future − amp_hist. |
Summary high
IFS-FESOM and IFS-NEMO project stronger shifts in seasonal temperature amplitude than the CMIP6 multi-model mean, particularly showing intensified summer warming over mid-latitude continents and dominant winter warming over polar oceans.
Key Findings
- All models show extensive negative values (blue) in the Arctic and positive values (red) in the Southern Ocean, both indicating that winter warming exceeds summer warming in polar regions (since JJA is Austral winter).
- IFS-NEMO exhibits a particularly intense 'hotspot' of summer warming dominance over Europe and the Mediterranean, saturating the scale (>3 K relative change), which is much weaker in IFS-FESOM and CMIP6-MMM.
- IFS-FESOM predicts stronger summer warming dominance over Western North America and Central Asia compared to IFS-NEMO.
- The high-resolution models resolve sharper regional gradients and higher magnitudes of change compared to the smoothed CMIP6 ensemble mean.
Spatial Patterns
The maps display a clear physical symmetry despite the color asymmetry: blue in the Northern Hemisphere high latitudes and red in the Southern Hemisphere high latitudes both represent winter amplification (DJF in NH, JJA in SH). Mid-latitude land masses (Europe, North America, Central Asia) show widespread red patches, indicating that summer warming rates exceed winter warming rates.
Model Agreement
The models agree on the broad zonal structures: polar winter amplification and mid-latitude continental summer amplification. They disagree significantly on regional magnitude and placement of extremes; IFS-NEMO places the strongest summer amplification over Europe, while IFS-FESOM places it over North America. CMIP6-MMM shows similar patterns but with much reduced amplitude and smoother spatial distribution.
Physical Interpretation
Polar signals are driven by the sea-ice albedo feedback and insulation effects, where sea-ice loss allows greater ocean heat release in winter (Arctic/Antarctic Amplification). The mid-latitude continental signals (red) are likely driven by soil moisture-temperature feedbacks: enhanced evaporation in a warmer climate leads to summer drying, which suppresses latent cooling and amplifies sensible heat/temperature rise during the summer season.
Caveats
- The CMIP6-MMM panel is an ensemble mean, which inherently smooths out internal variability, making the single-realization DestinE models appear more extreme by comparison.
- Regional discrepancies between IFS-NEMO and IFS-FESOM (e.g., the location of the strongest summer warming) may result from internal decadal variability (weather noise) rather than structural model differences, given the short analysis period (2040-2049).
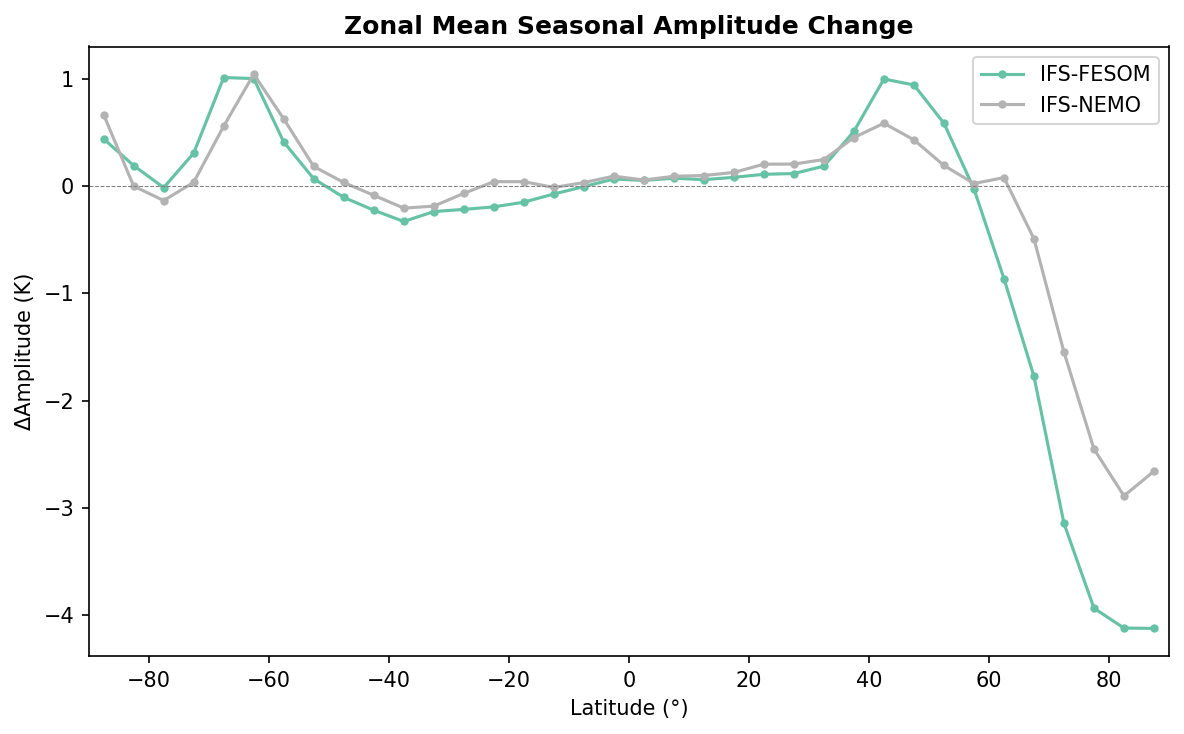
Zonal Seasonal Amplitude Change
| Variables | avg_2t |
|---|---|
| Models | ifs-fesom, ifs-nemo |
| Units | K |
| Baseline | 1990-2014 |
| Future | 2040-2049 |
| Method | 5° latitude bins; amplitude = T_JJA − T_DJF. |
Summary high
The figure illustrates the zonal mean change in seasonal temperature amplitude ($T_{JJA} - T_{DJF}$) between the future (2040–2049) and baseline (1990–2014) periods for the IFS-FESOM and IFS-NEMO models.
Key Findings
- High Northern Latitudes (>60°N) show a strong negative change (-2 to -4 K), indicating that winter (DJF) warming significantly exceeds summer (JJA) warming (reduced seasonality).
- Northern Mid-Latitudes (30°N–50°N) show a positive change (~+1 K), indicating summer (JJA) warming exceeds winter warming (enhanced seasonality).
- IFS-FESOM projects a much stronger reduction in Arctic seasonality (reaching -4.1 K) compared to IFS-NEMO (~-2.9 K) north of 70°N.
- Southern High Latitudes (~60°S) display a positive change peak (~+1 K), consistent with winter (JJA) warming exceeding summer (DJF) warming in the Southern Ocean.
Spatial Patterns
The profile is characterized by polar amplification signatures at both poles (winter warming > summer warming) leading to negative changes in the NH and positive changes in the SH (mathematically reducing the magnitude of the seasonal cycle in both). In contrast, the NH mid-latitudes show enhanced seasonality likely driven by continental summer warming.
Model Agreement
The models agree closely in the tropics (20°S–20°N) and Southern Hemisphere. The primary disagreement is in the Arctic (>65°N), where IFS-FESOM simulates significantly greater seasonal amplitude reduction than IFS-NEMO, suggesting differences in sea-ice retreat physics or ocean heat release between the unstructured FESOM and NEMO grids.
Physical Interpretation
The high-latitude signals are driven by the 'Arctic Amplification' mechanism (and its Antarctic equivalent): loss of sea ice allows the ocean to release immense heat in winter, warming winters faster than summers. The NH mid-latitude positive signal is likely driven by land-surface feedbacks (e.g., soil drying) causing intense summer warming over continents.
Caveats
- Zonal means obscure the contrast between land and ocean, particularly in NH mid-latitudes.
- The 10-year analysis period (2040-2049) is relatively short and may be influenced by internal decadal variability.
- Using fixed months (JJA/DJF) does not account for potential shifts in the phase of the seasonal cycle.