Tier 1 Arctic Amplification CMIP6 f_out 19.5%
CMIP6 Envelope Comparison
DestinE anomalies compared to the CMIP6 P5–P95 percentile envelope derived from 51 ensemble members across 11 models under SSP3-7.0.
Contributing models: ACCESS-ESM1-5, AWI-CM-1-1-MR, CNRM-CM6-1, CNRM-ESM2-1, EC-Earth3, FGOALS-g3, GISS-E2-1-G, INM-CM5-0, IPSL-CM6A-LR, MPI-ESM1-2-LR, MRI-ESM2-0
Outside CMIP6 does not mean wrong — it indicates an uncommon response within the CMIP6 distribution.
Arctic Amplification Factor
| Variables | avg_2t |
|---|---|
| Models | ifs-fesom, ifs-nemo |
| Units | K |
| Baseline | 1990-2014 |
| Future | 2040-2049 |
| Method | HealPix equal-area cells; .where(lat > 66.5).mean() for Arctic. |
Summary high
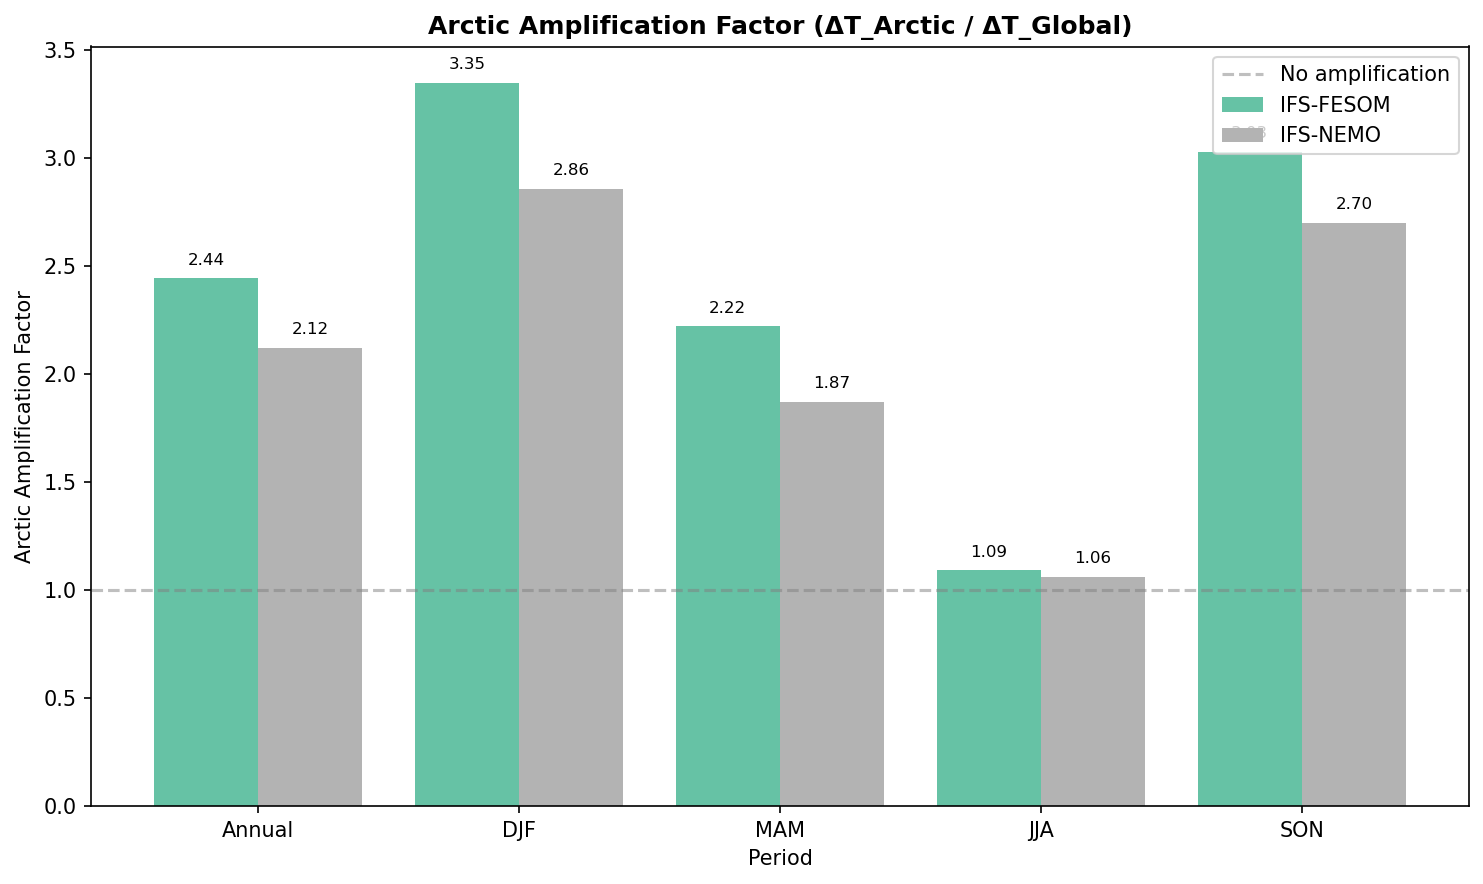
This diagnostic compares the Arctic Amplification Factor (AAF) of the IFS-FESOM and IFS-NEMO models against the CMIP6 ensemble median and spread for annual and seasonal periods (2040–2049 vs 1990–2014).
Key Findings
- Both DestinE models exhibit robust Arctic Amplification (AAF > 1) annually and in all seasons, consistent with the CMIP6 ensemble.
- IFS-FESOM consistently simulates a higher amplification factor (Annual: 2.44) than IFS-NEMO (Annual: 2.12), with IFS-FESOM aligning almost perfectly with the CMIP6 median (2.43).
- A strong seasonal cycle is evident: amplification is maximised in winter (DJF) and autumn (SON) with factors > 2.7, and minimised in summer (JJA) where factors drop to ~1.0–1.2.
- IFS-NEMO consistently tracks below the CMIP6 median across all periods but remains well within the P5–P95 envelope.
Spatial Patterns
While spatially aggregated, the seasonal pattern is distinct. Amplification is strongest in DJF (IFS-FESOM: 3.35) and SON (IFS-FESOM: 3.03), reflecting the 'wintertime amplification' signature. In contrast, JJA shows minimal amplification (1.06–1.09), indicating Arctic warming rates in summer are nearly identical to the global mean.
Model Agreement
Both IFS-FESOM and IFS-NEMO fall well within the CMIP6 P5–P95 envelope for all periods. IFS-FESOM is a near-median model (Annual/SON), while IFS-NEMO represents the lower quartile of the CMIP6 distribution (conservative amplification). The large CMIP6 spread in DJF (ranging approx. 1.5 to 4.4) easily encompasses the divergence between the two DestinE models.
Physical Interpretation
The seasonality is driven by sea-ice thermodynamics. In summer (JJA), excess energy is absorbed by melting sea ice (latent heat) rather than raising surface temperatures, pinning the AAF near 1. In autumn/winter (SON/DJF), reduced sea-ice cover exposes the relatively warm ocean to the cold atmosphere, leading to strong turbulent heat fluxes and pronounced warming (insulation feedback). The higher AAF in IFS-FESOM suggests stronger wintertime sea-ice loss or more efficient ocean-atmosphere heat exchange compared to IFS-NEMO.
Caveats
- Results cover a single decade (2040–2049), meaning internal variability could influence the precise amplification factors, especially in winter.
- The bulk Arctic average (>66.5°N) masks potential regional differences where amplification might be locally higher (e.g., Barents Sea).
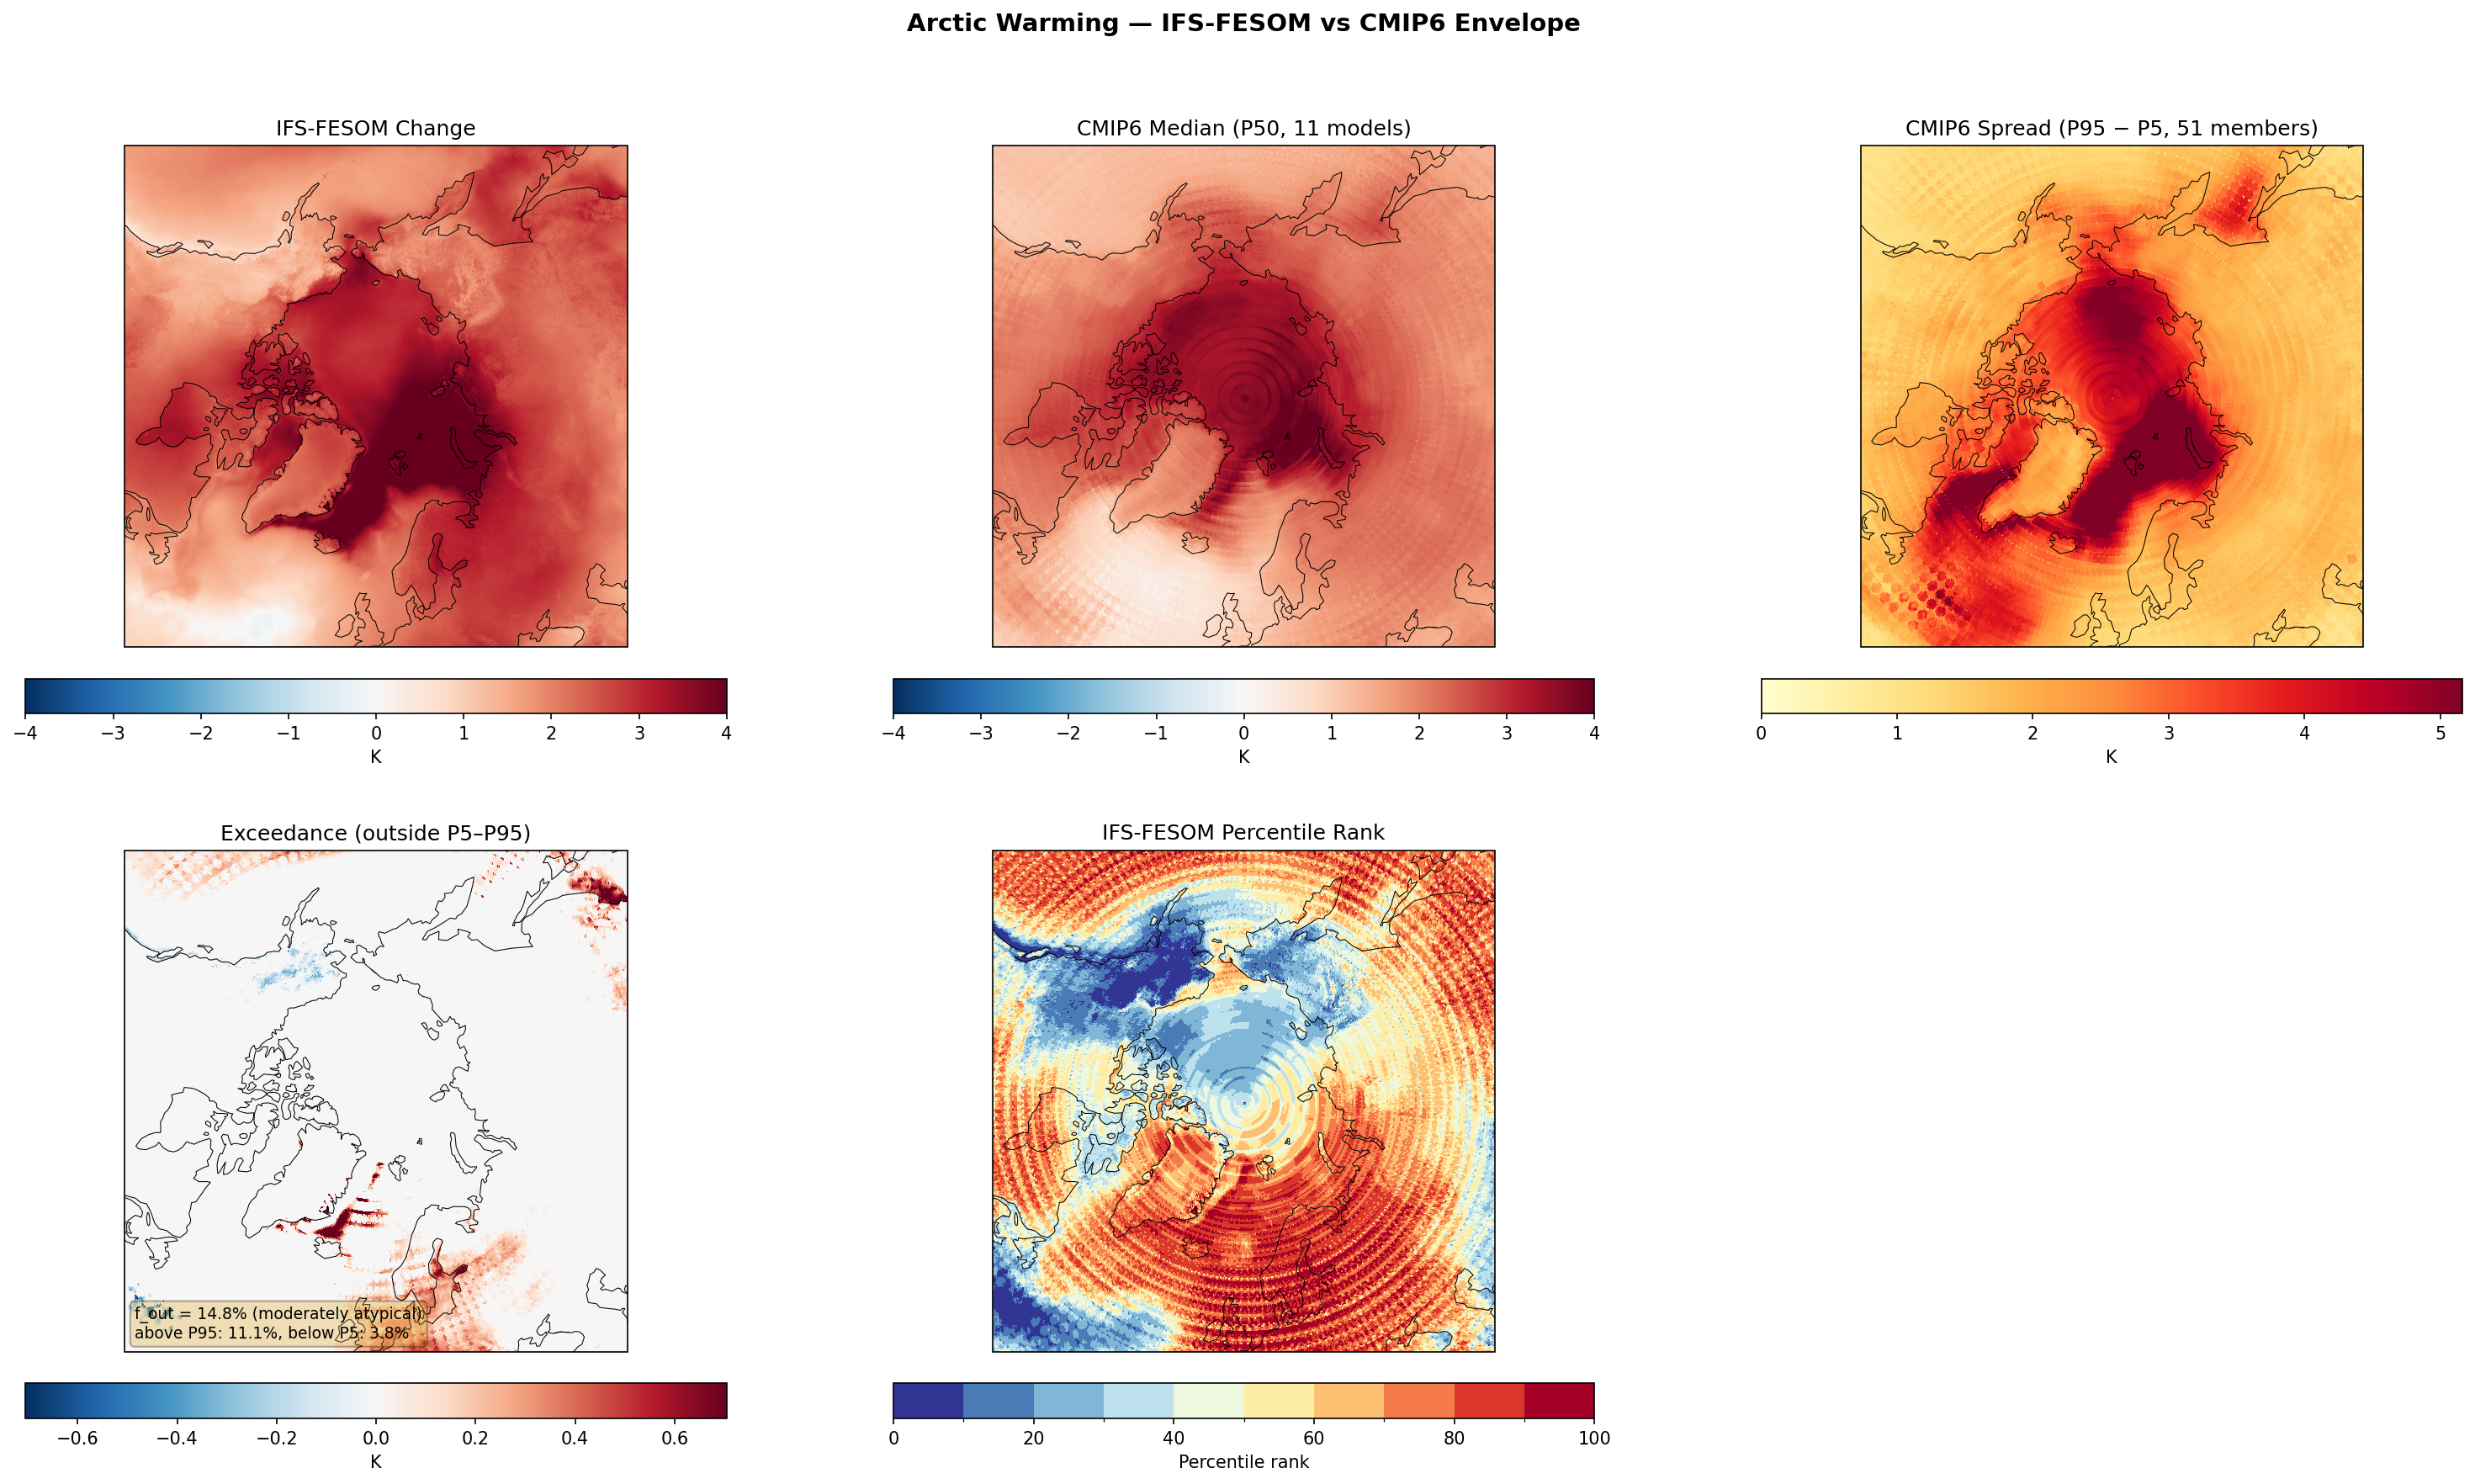
Arctic Warming — IFS-FESOM vs CMIP6 Envelope f_out 14.8%
Envelope Metrics
| f_out (outside P5–P95) | 14.8% moderately atypical |
|---|---|
| Above P95 | 11.1% |
| Below P5 | 3.8% |
| CMIP6 ensemble | 11 models, 51 members |
| Variables | avg_2t |
|---|---|
| Models | ifs-fesom |
| Units | K |
| Baseline | 1990-2014 |
| Future | 2040-2049 |
| Method | DestinE avg_2t change compared to CMIP6 percentile envelope (P5, P50, P95). North Polar projection. |
Summary high
IFS-FESOM projects enhanced Arctic Amplification relative to the CMIP6 median, characterised by intense warming in the Barents and Kara Seas and a pronounced 'warming hole' in the North Atlantic.
Key Findings
- IFS-FESOM is moderately atypical (f_out = 14.8%), with significant deviations in the Barents Sea (above P95) and North Atlantic (below P5).
- The model exhibits stronger warming than 95% of CMIP6 models in the Barents Sea and parts of the Baltic Sea (f_above_P95 = 11.1%).
- A distinct region of suppressed warming (or cooling) south of Greenland places IFS-FESOM below the CMIP6 5th percentile (f_below_P5 = 3.8%).
Spatial Patterns
The percentile rank map reveals a stark contrast: high ranks (>80) dominate the Arctic Ocean, particularly the Eurasian shelf seas, while low ranks (<10) characterise the North Atlantic subpolar gyre region. Notable localised warming exceedance is visible in the Baltic Sea.
Model Agreement
IFS-FESOM generally agrees with the broad CMIP6 pattern of Arctic Amplification but occupies the extreme tails of the distribution for key ocean features. It is 'hotter' than the ensemble in sea-ice loss regions and 'colder' in the North Atlantic deep water formation zones.
Physical Interpretation
The excessive Barents Sea warming suggests aggressive sea-ice retreat and potentially stronger 'Atlantification' (inflow of warm Atlantic water) in the high-resolution model. The deep 'warming hole' in the North Atlantic is consistent with a strong AMOC slowdown signal, which is often better resolved or more sensitive in eddy-permitting ocean models compared to coarse CMIP6 counterparts. The Baltic Sea exceedance likely results from improved topographic resolution compared to coarse CMIP6 grids.
Caveats
- The 10-year averaging period (2040-2049) may conflate forced trends with internal decadal variability (e.g., NAO phases), potentially exaggerating the warming hole contrast.
- Strong deviations in the Barents Sea could indicate sensitivity to initial sea-ice state or specific tuning of the sea-ice model.
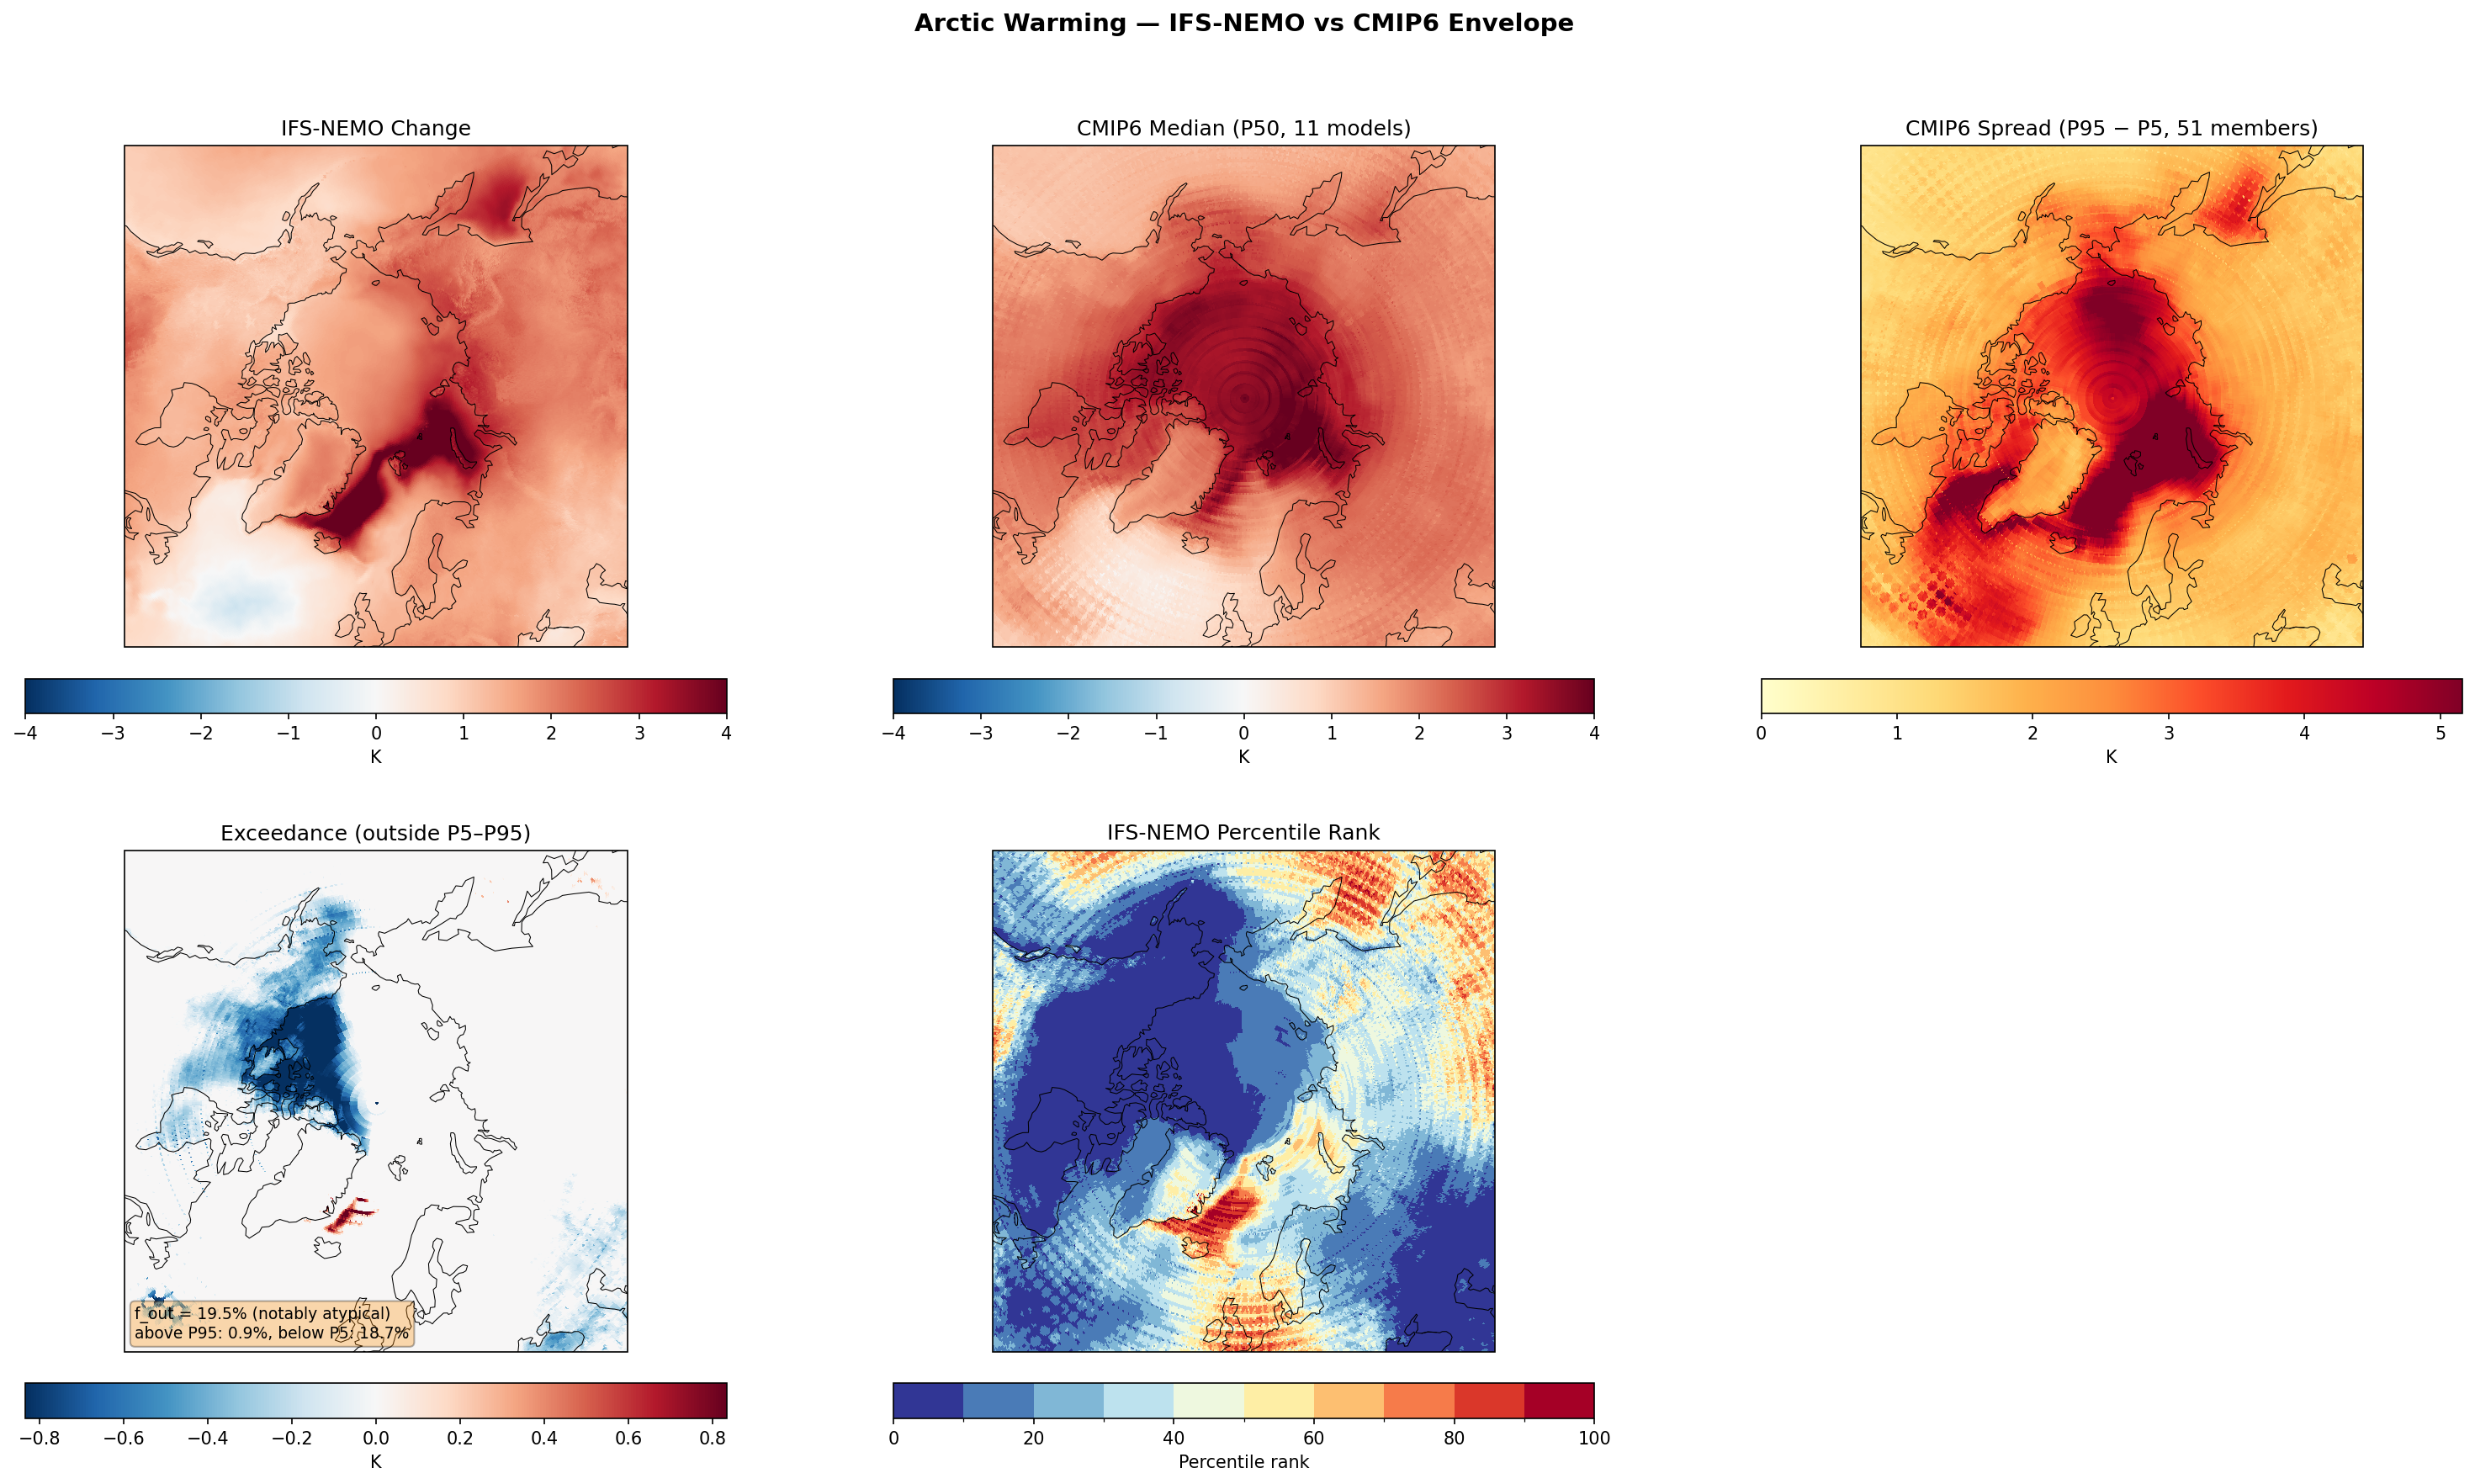
Arctic Warming — IFS-NEMO vs CMIP6 Envelope f_out 19.5%
Envelope Metrics
| f_out (outside P5–P95) | 19.5% notably atypical |
|---|---|
| Above P95 | 0.9% |
| Below P5 | 18.7% |
| CMIP6 ensemble | 11 models, 51 members |
| Variables | avg_2t |
|---|---|
| Models | ifs-nemo |
| Units | K |
| Baseline | 1990-2014 |
| Future | 2040-2049 |
| Method | DestinE avg_2t change compared to CMIP6 percentile envelope (P5, P50, P95). North Polar projection. |
Summary high
IFS-NEMO projects significantly weaker Arctic warming than the CMIP6 ensemble average for the 2040–2049 period, particularly over the Central Arctic Ocean and Greenland. The model exhibits a 'notably atypical' response with 19.5% of the domain falling outside the CMIP6 P5–P95 envelope, dominated almost entirely by regions warming less than the CMIP6 5th percentile.
Key Findings
- IFS-NEMO shows a pronounced 'warming hole' (absolute cooling) in the subpolar North Atlantic that is stronger and more distinct than the CMIP6 median.
- Warming in the Central Arctic Ocean is substantially muted compared to CMIP6, falling below the 5th percentile (blue in Exceedance/Percentile panels) across the deep basin and Greenland.
- Strong warming is geographically confined to the Barents and Kara Seas (Atlantification region), whereas CMIP6 projects broader amplification extending over the entire pole.
- The area-weighted fraction outside the envelope (f_out) is 19.5%, with 18.7% falling below the P5 threshold, indicating a systematic low-warming deviation relative to the multi-model ensemble.
Spatial Patterns
The Percentile Rank map reveals a stark dichotomy: the Barents/Kara Sea sector shows typical to high warming ranks (40–90th percentile), while the rest of the domain—including the Central Arctic, Canadian Archipelago, Greenland, and North Atlantic—is dominated by values below the 10th percentile. The Exceedance panel marks a vast contiguous area of the High Arctic and a localized patch in the North Atlantic as significantly cooler than the CMIP6 P5 boundary.
Model Agreement
IFS-NEMO diverges notably from the CMIP6 consensus in the High Arctic, showing much weaker polar amplification. Agreement is better in the Barents Sea inflow region, where the model captures the intense warming signal associated with sea ice loss, though the spatial gradients are sharper than the coarse-resolution CMIP6 mean.
Physical Interpretation
The strong North Atlantic cooling suggests a robust slowdown of the Atlantic Meridional Overturning Circulation (AMOC) or a specific phase of internal variability (e.g., NAO/AMO) not present in the ensemble mean. The muted central Arctic warming implies a more resilient sea-ice pack or weaker ice-albedo feedback in IFS-NEMO compared to standard SSP3-7.0 projections. High-resolution ocean coupling may be resolving heat transport pathways or vertical mixing (stratification) differently, limiting heat flux through the ice in the central basin.
Caveats
- The 10-year analysis window (2040–2049) is short, meaning decadal internal variability could heavily influence the comparison against the smoother 51-member CMIP6 envelope.
- The 'cooling' relative to CMIP6 does not imply no warming; outside the North Atlantic, the Arctic is warming, just at a slower rate than the aggressive CMIP6 median.
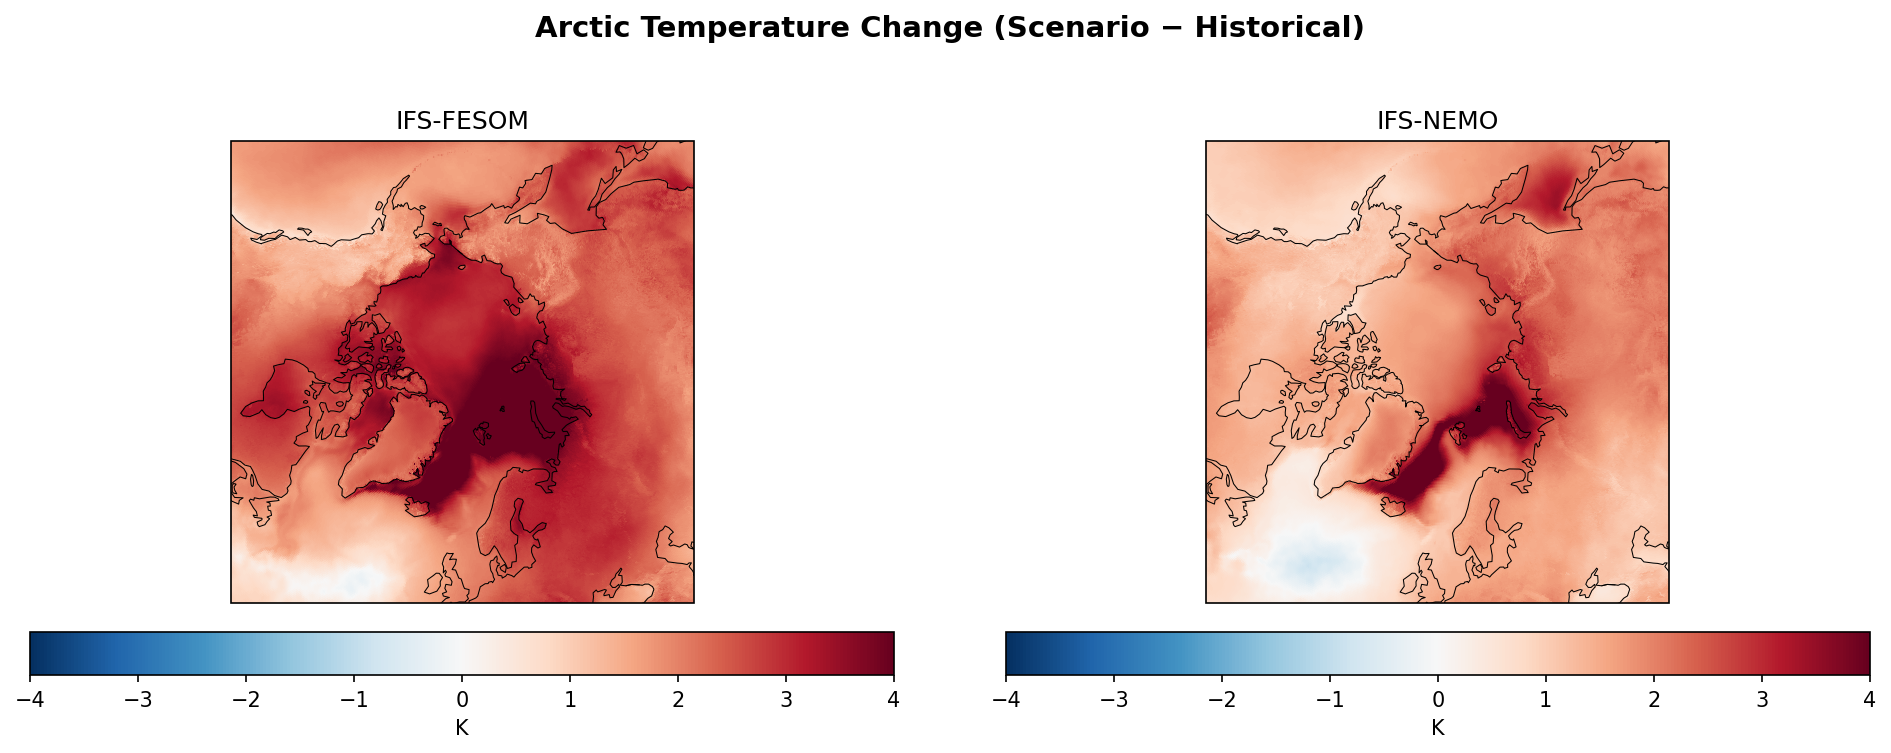
Arctic Warming Map
| Variables | avg_2t |
|---|---|
| Models | ifs-fesom, ifs-nemo, CMIP6-MMM |
| Units | K |
| Baseline | 1990-2014 |
| Future | 2040-2049 |
| Method | Future mean minus historical mean of avg_2t. |
Summary high
The figure illustrates projected Arctic near-surface temperature changes (2040-2049 vs 1990-2014), confirming robust Arctic Amplification across all datasets but revealing significant structural divergence in the North Atlantic between the high-resolution DestinE models and the CMIP6 multi-model mean.
Key Findings
- All three panels show intense Arctic Amplification, with warming exceeding 4 K over large parts of the Arctic Ocean, particularly in the Barents and Kara Seas.
- IFS-NEMO exhibits a prominent and intense 'warming hole' (absolute cooling of ~1–2 K) in the North Atlantic subpolar gyre, substantially stronger than the neutral signal in IFS-FESOM or the suppressed warming in CMIP6-MMM.
- CMIP6-MMM displays the most spatially coherent and widespread high-magnitude warming over the central Arctic basin, likely due to ensemble averaging smoothing out internal variability.
- IFS-NEMO shows somewhat less extensive peak warming over the central polar cap compared to IFS-FESOM and CMIP6-MMM.
Spatial Patterns
Maximum warming is concentrated over the Barents, Kara, and Laptev Seas regions, consistent with sea-ice loss patterns. Topographic features (Greenland Ice Sheet, Scandinavian mountains) imprint sharper gradients in the high-resolution models (IFS-FESOM, IFS-NEMO) compared to the smoother CMIP6 field. The North Atlantic presents a stark contrast: a distinct blue cooling blob in IFS-NEMO versus a region of reduced warming in CMIP6.
Model Agreement
Models agree on the primary pattern of polar amplification and land-sea warming contrast. Significant disagreement exists regarding the magnitude of the North Atlantic warming hole, with IFS-NEMO appearing as an outlier with strong cooling. IFS-FESOM aligns more closely with the CMIP6 mean pattern in the Arctic basin than IFS-NEMO does.
Physical Interpretation
The intense Arctic warming is driven by the sea-ice albedo feedback and enhanced air-sea heat fluxes as sea ice retreats. The North Atlantic 'warming hole' is physically linked to a slowdown of the Atlantic Meridional Overturning Circulation (AMOC) and reduced northward heat transport. The strong signal in IFS-NEMO suggests a more vigorous AMOC decline or a specific phase of decadal variability involving deep convection collapse in the Labrador/Irminger Seas compared to IFS-FESOM.
Caveats
- The analysis compares single realizations (DestinE models) against an ensemble mean (CMIP6), meaning internal variability may exaggerate differences, particularly in the North Atlantic.
- The future period (2040-2049) is only 10 years long, which may not fully separate forced trends from decadal variability.