Tier 2 Clausius–Clapeyron Test CMIP6
CMIP6 Multi-Model Mean Context
Comparison with CMIP6 conventional-resolution ensemble mean (up to 8 models under SSP3-7.0, regridded to 0.25°).
Synthesis
Related diagnostics
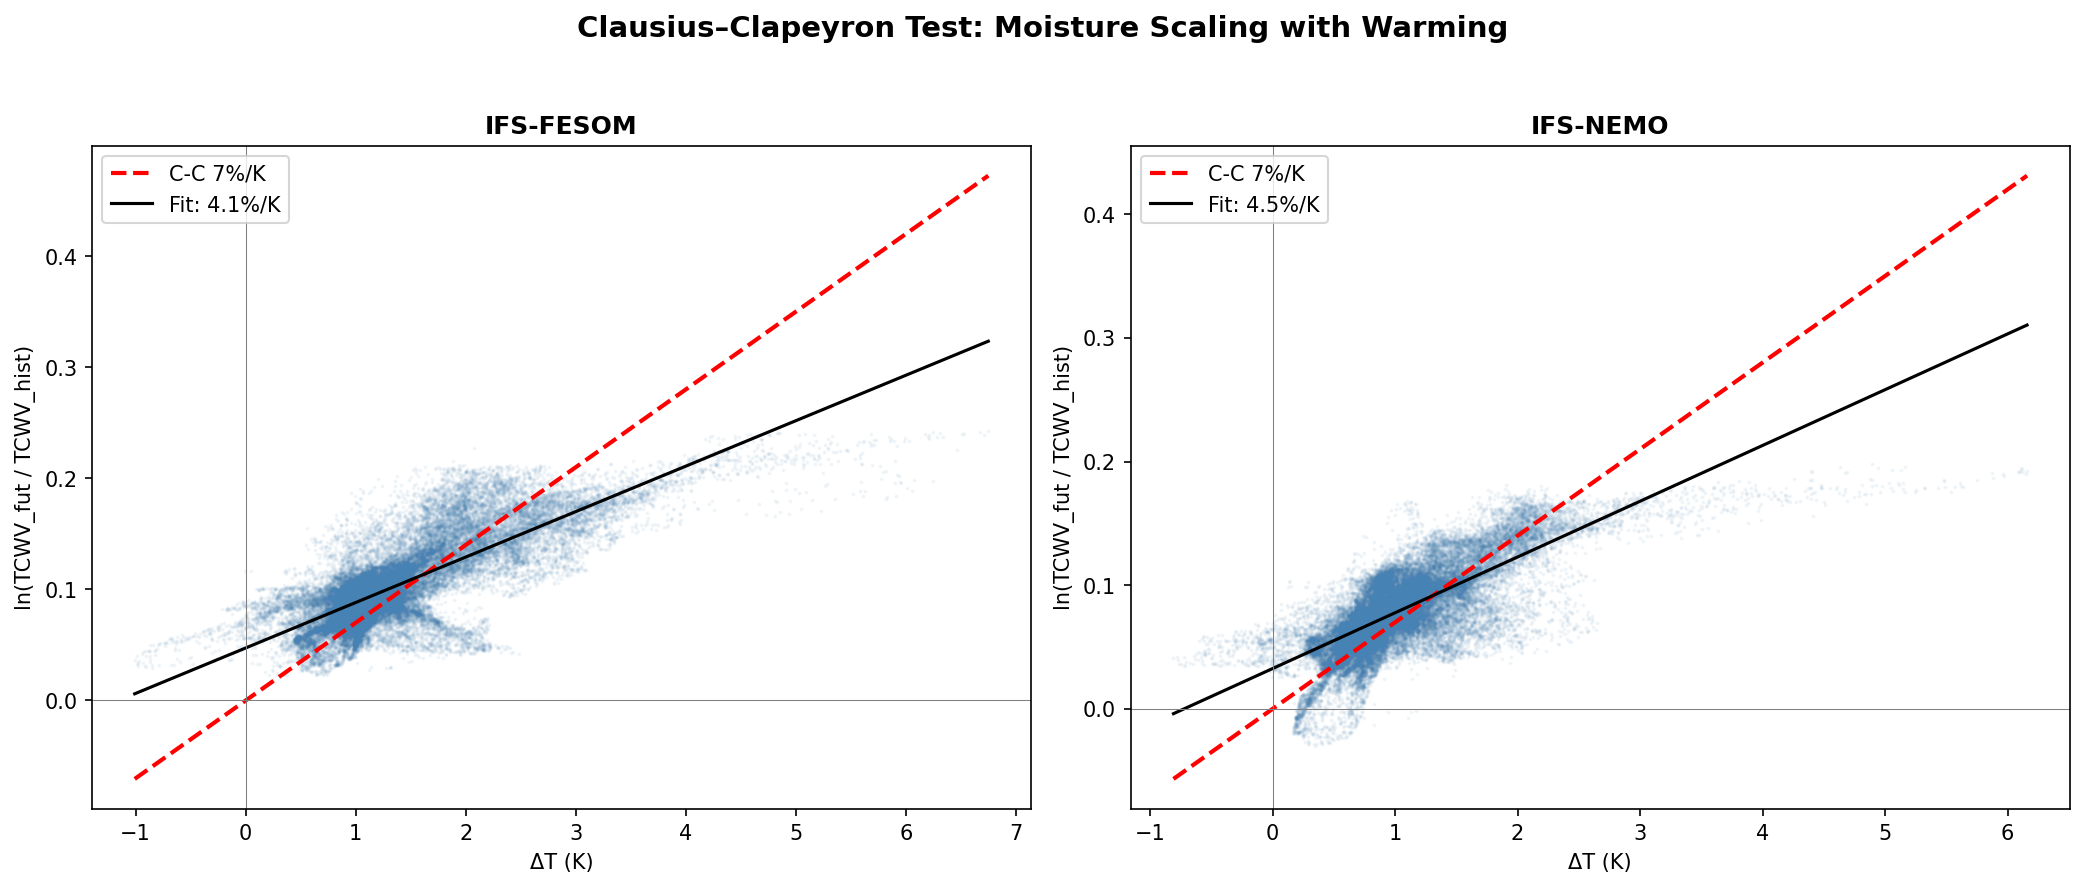
Clausius–Clapeyron Test
| Variables | avg_tcwv, avg_2t |
|---|---|
| Models | ifs-fesom, ifs-nemo |
| Units | kg/m2 |
| Baseline | 1990-2014 |
| Future | 2040-2049 |
| Method | δ_TCWV = ln(TCWV_future / TCWV_hist); ΔT = T_future − T_hist. Sub-sampled to 50k cells. |
Summary high
This diagnostic evaluates the hydrological sensitivity of IFS-FESOM and IFS-NEMO by correlating fractional Total Column Water Vapor (TCWV) change with surface warming (ΔT), comparing the results against theoretical Clausius-Clapeyron (C-C) scaling and the CMIP6 ensemble. Both DestinE models demonstrate a moisture scaling response (4.1%/K and 4.5%/K) that is significantly stronger than the CMIP6 median (3.3%/K) and exceeds the upper bound of the CMIP6 envelope.
Key Findings
- IFS-NEMO (4.5%/K) and IFS-FESOM (4.1%/K) exhibit moisture scaling rates notably higher than the CMIP6 multi-model median (3.3%/K) and outside the CMIP6 P5–P95 range (2.3–3.9%/K).
- Both models remain below the theoretical pure C-C rate of 7%/K, consistent with global constraints (e.g., land limited evaporation), but are closer to the theoretical limit than the standard resolution CMIP6 ensemble.
- IFS-NEMO shows a slightly steeper slope and wider scatter than IFS-FESOM, indicating a stronger hydrological sensitivity in this configuration.
Spatial Patterns
The scatter plots reveal two distinct regimes: a dense cluster at lower warming levels (0–2 K, likely dominated by oceans) which follows a steeper slope close to the C-C line, and a more diffuse distribution at higher warming levels (>3 K, likely land/high-latitudes) where the moisture response flattens, depressing the global regression slope.
Model Agreement
The two DestinE models qualitatively agree on a stronger-than-CMIP6 water vapor feedback. The divergence from CMIP6 suggests that the high-resolution coupled systems may maintain relative humidity more effectively or simulate stronger air-sea moisture fluxes, resulting in a 'moister' warming trajectory than coarser models.
Physical Interpretation
While the Clausius-Clapeyron relation predicts a ~7%/K increase in water vapor holding capacity, realized scaling is often lower due to relative humidity reductions (drying) over land and dynamic constraints. The fact that DestinE models exhibit slopes (4.1–4.5%/K) closer to the 7%/K limit than CMIP6 (3.3%/K) implies they simulate less reduction in relative humidity or stronger evaporation feedbacks, potentially due to better resolved mesoscale convective processes or ocean-atmosphere coupling.
Caveats
- The linear regression aggregates all grid points globally, conflating different physical regimes (e.g., moisture-limited land vs. energy-limited ocean).
- The CMIP6 reference slope (3.3%/K) is lower than typical global-mean scaling estimates (~6–7%/K), indicating that the local cell-by-cell regression method used here yields different sensitivities than analyzing global means.
- Internal variability over the short 10-year analysis period may introduce noise into the local ΔT vs ΔTCWV relationship.