Tier 1 SST Patterns CMIP6 f_out 20.9%
CMIP6 Envelope Comparison
DestinE anomalies compared to the CMIP6 P5–P95 percentile envelope derived from 43 ensemble members across 11 models under SSP3-7.0.
Contributing models: ACCESS-ESM1-5, AWI-CM-1-1-MR, CNRM-CM6-1, CNRM-ESM2-1, EC-Earth3, FGOALS-g3, GISS-E2-1-G, INM-CM5-0, IPSL-CM6A-LR, MPI-ESM1-2-LR, MRI-ESM2-0
Outside CMIP6 does not mean wrong — it indicates an uncommon response within the CMIP6 distribution.
Synthesis
Related diagnostics
SST Change (Annual)
| Variables | avg_tos |
|---|---|
| Models | ifs-fesom, ifs-nemo, CMIP6-MMM |
| Units | K |
| Baseline | 1990-2014 |
| Future | 2040-2049 |
| Method | Future mean minus historical mean of avg_tos. |
Summary high
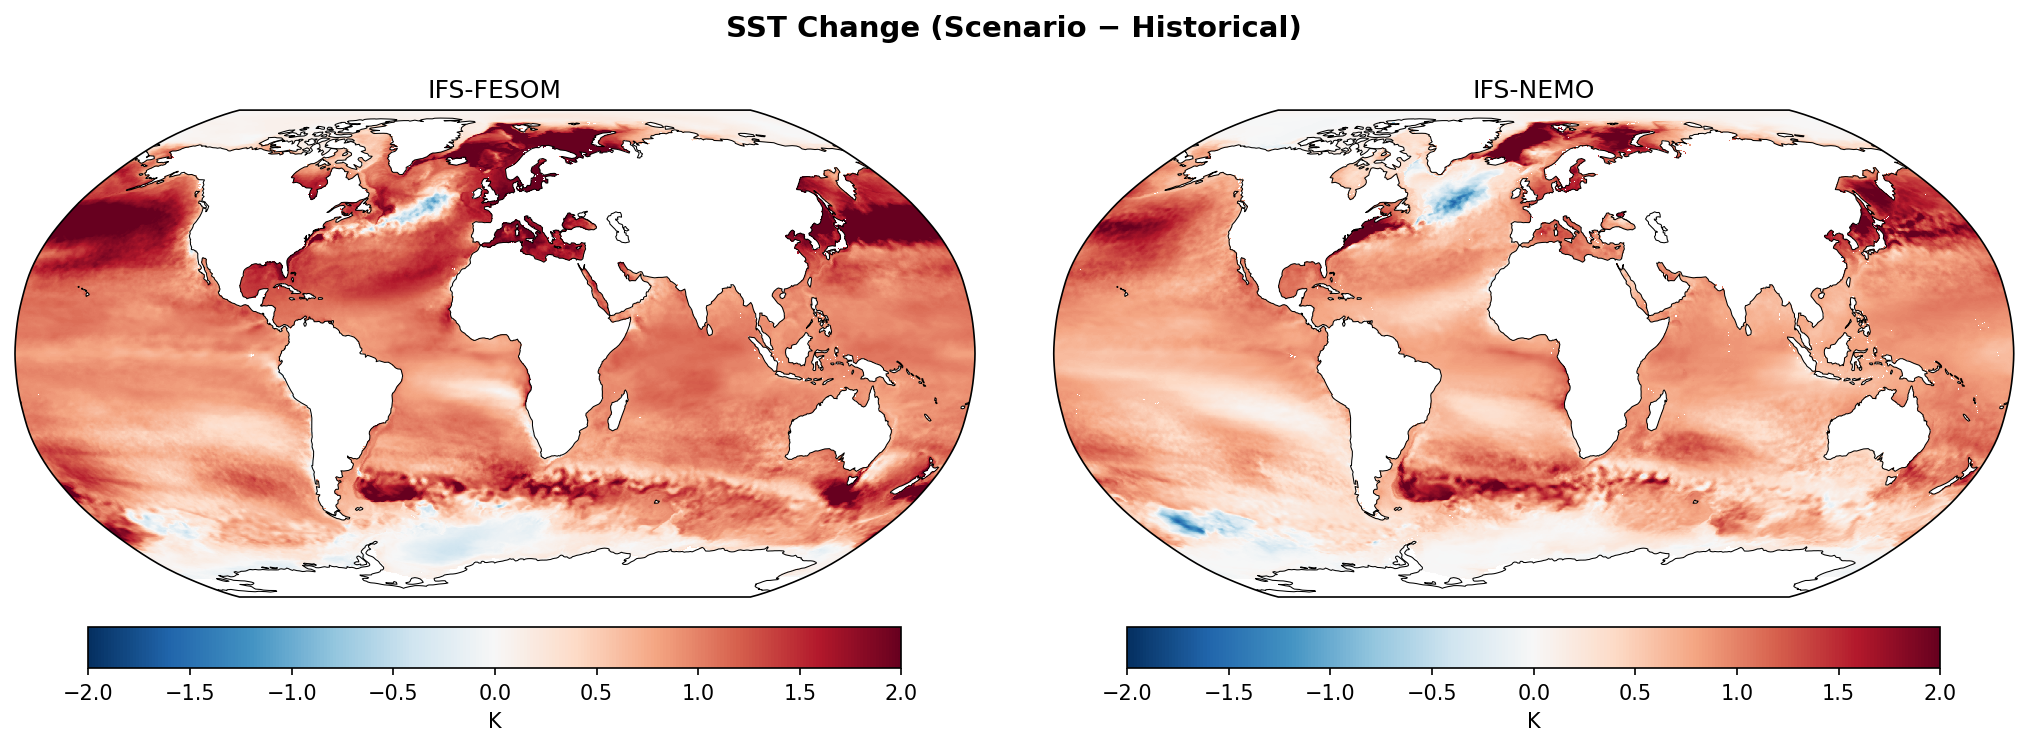
This figure compares annual Sea Surface Temperature (SST) changes (2040–2049 relative to 1990–2014) projected by two high-resolution DestinE models (IFS-FESOM, IFS-NEMO) against the CMIP6 multi-model mean (MMM). While all models agree on global-scale warming patterns and Arctic amplification, the high-resolution models exhibit significantly sharper dynamical features and distinct regional cooling anomalies not present in the smoothed CMIP6 average.
Key Findings
- Both DestinE models simulate a pronounced 'warming hole' (cooling of -0.5 to -1.5 K) in the North Atlantic subpolar gyre, significantly more intense and localized than the diffuse signal in the CMIP6 MMM.
- IFS-NEMO displays a prominent, localized cooling anomaly in the Pacific sector of the Southern Ocean, whereas IFS-FESOM shows more widespread, patchy cooling signals around Antarctica.
- The high-resolution models resolve sharp frontal gradients and filamentary warming structures along Western Boundary Currents (Gulf Stream, Kuroshio) that are smoothed out in the CMIP6 ensemble.
Spatial Patterns
The dominant pattern is global warming, intensified in the Arctic (Polar Amplification) and the Northern Hemisphere mid-latitudes. Exceptions include the North Atlantic subpolar gyre (cooling) and parts of the Southern Ocean (delayed warming or cooling). The DestinE models show granular, eddy-scale structures, particularly in the Southern Ocean and boundary currents, contrasting with the zonally smooth CMIP6 fields.
Model Agreement
There is broad agreement on the sign of change (warming) over most of the globe and the magnitude of Arctic Amplification. DestinE models diverge from CMIP6 by showing more extreme local values (both warming and cooling) due to resolved dynamics. Between the two DestinE models, IFS-FESOM and IFS-NEMO agree on the North Atlantic cooling but differ in the spatial distribution of Southern Ocean anomalies.
Physical Interpretation
The North Atlantic cooling is a signature of Atlantic Meridional Overturning Circulation (AMOC) slowdown; high-resolution models often simulate sharper deep convection responses, leading to a more defined warming hole than coarser models. The 'grainy' texture and localized anomalies in the DestinE panels likely reflect resolved mesoscale eddies and internal decadal variability (e.g., shifts in convection sites) which are preserved in a single-member 10-year mean but averaged out in the CMIP6 ensemble.
Caveats
- The 10-year future averaging period (2040–2049) is relatively short, meaning internal climate variability (e.g., ENSO, IPO) may significantly influence the spatial patterns in the single-realization DestinE models compared to the CMIP6 ensemble mean.
- Localized intense cooling spots, particularly in the Southern Ocean in IFS-NEMO, warrants investigation into potential model drift or initialization transients in deep water formation regions.
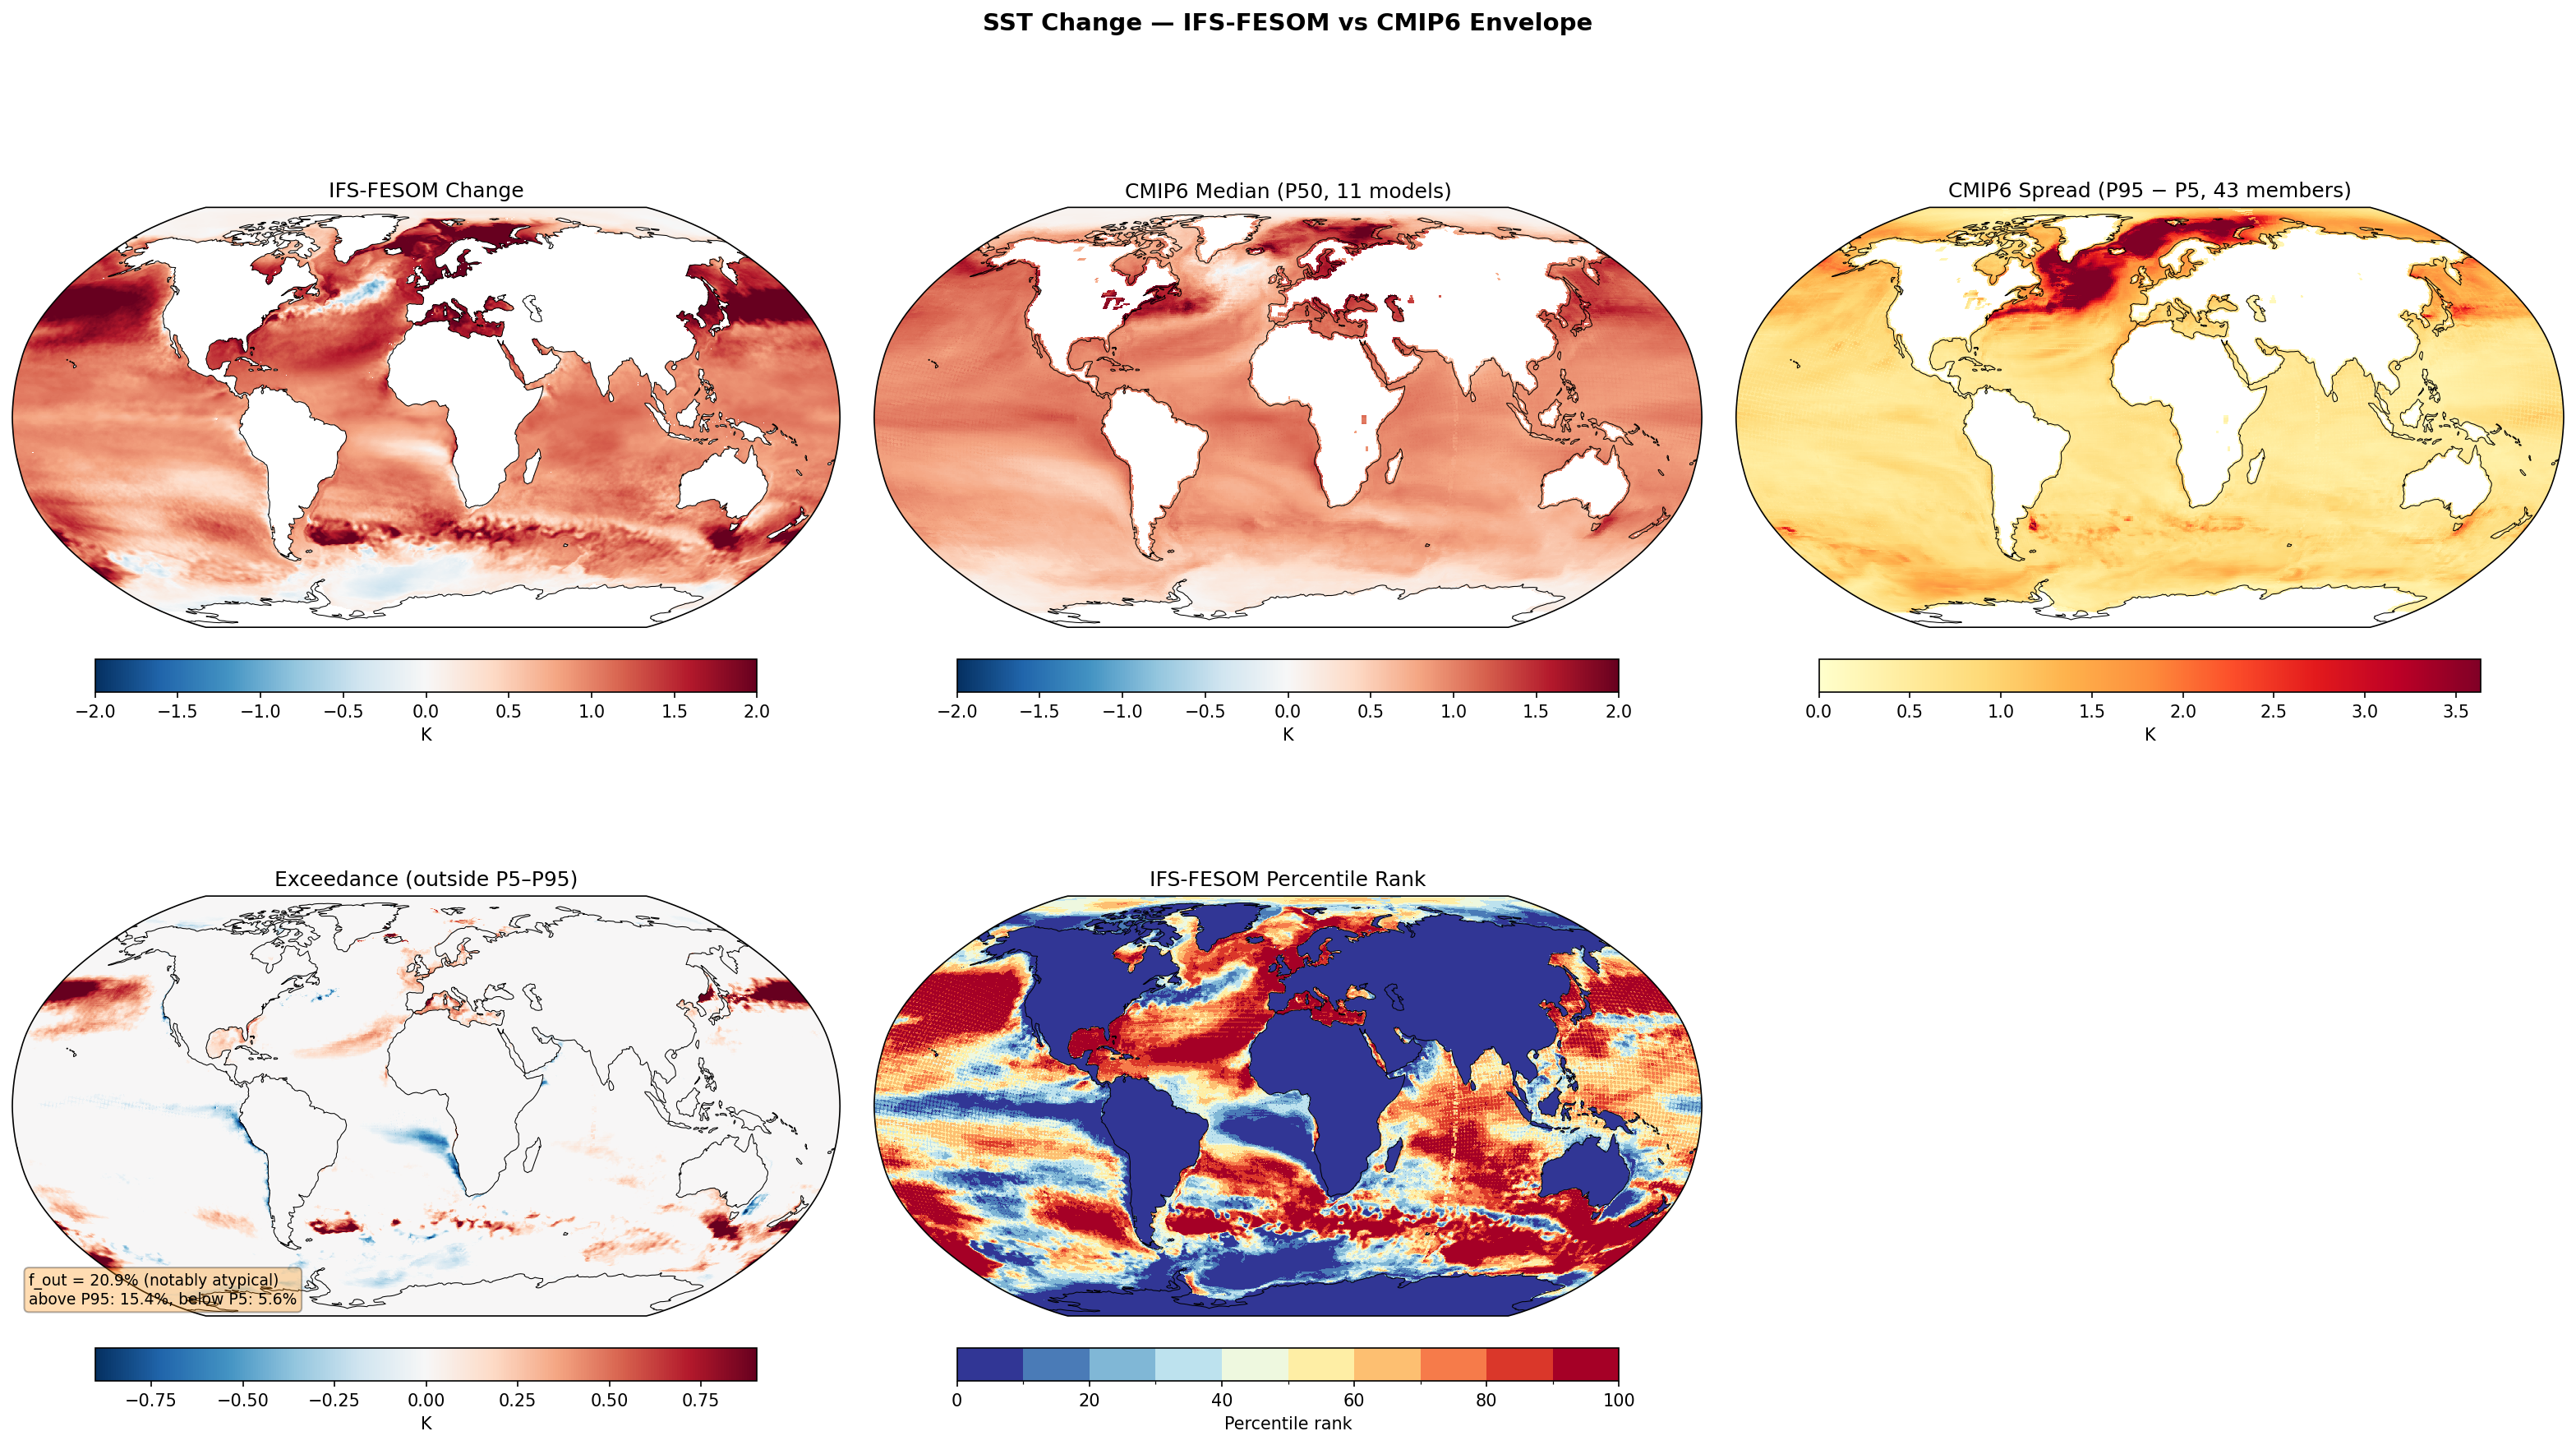
SST Change — IFS-FESOM vs CMIP6 Envelope f_out 20.9%
Envelope Metrics
| f_out (outside P5–P95) | 20.9% notably atypical |
|---|---|
| Above P95 | 15.4% |
| Below P5 | 5.6% |
| CMIP6 ensemble | 11 models, 43 members |
| Variables | avg_tos |
|---|---|
| Models | ifs-fesom |
| Units | K |
| Baseline | 1990-2014 |
| Future | 2040-2049 |
| Method | DestinE ΔSST compared to CMIP6 percentile envelope (P5, P50, P95). Exceedance shows where DestinE lies outside the P5–P95 range. |
Summary high
IFS-FESOM displays a notably atypical SST change pattern (f_out = 20.9%) compared to CMIP6, characterised by sharper gradients and distinct regional extremes, particularly a strong dipole in the North Atlantic and widespread relative cooling in the Southern Ocean.
Key Findings
- The North Atlantic exhibits a striking contrast: intense warming in the Nordic Seas and subpolar regions exceeds the CMIP6 P95, while a distinct 'warming hole' (absolute cooling) in the mid-latitude North Atlantic falls below the CMIP6 P5.
- IFS-FESOM projects significantly stronger warming than the CMIP6 upper bound (P95) across large swathes of the North Pacific and the Mediterranean Sea.
- Extensive regions of the Southern Ocean and South Atlantic show suppressed warming or cooling signals that fall below the CMIP6 P5 threshold.
- Tropical and subtropical basins largely align with the CMIP6 envelope (percentile ranks 20–80), indicating consensus on broad-scale thermal expansion and greenhouse forcing response in these latitudes.
Spatial Patterns
The most prominent pattern is the sharpened North Atlantic warming hole and associated high-latitude warming, much more spatially defined than the diffuse CMIP6 spread. The Southern Ocean exhibits zonally elongated bands of 'below P5' SST change, contrasting with 'above P95' patches near the sea-ice edge in the Indian/Pacific sectors.
Model Agreement
The model agrees well with the CMIP6 ensemble in the tropical Pacific, Atlantic, and Indian Oceans, where thermodynamic forcing dominates over dynamical changes. Disagreement is concentrated in dynamically active regions: western boundary current extensions, deep water formation sites (Labrador/Nordic Seas), and the Antarctic Circumpolar Current.
Physical Interpretation
The North Atlantic dipole suggests a potentially stronger or more spatially resolved Atlantic Meridional Overturning Circulation (AMOC) slowing signal (the 'cold blob') coupled with enhanced Atlantic Water heat transport into the Nordic Seas. The widespread lower SSTs in the Southern Ocean may result from more efficient vertical mixing of heat by resolved eddies (typical of high-resolution models) or differences in sea-ice melt feedbacks compared to the coarser CMIP6 mean.
Caveats
- The 10-year averaging period (2040-2049) may retain signatures of internal decadal variability (e.g., PDO, AMO phases) which are smoothed out in the multi-model CMIP6 envelope.
- High f_out (20.9%) is expected given the higher resolution of IFS-FESOM (~5-25km) compared to standard CMIP6 models (~100km), allowing it to resolve frontal features that appear as outliers against a smoother background.
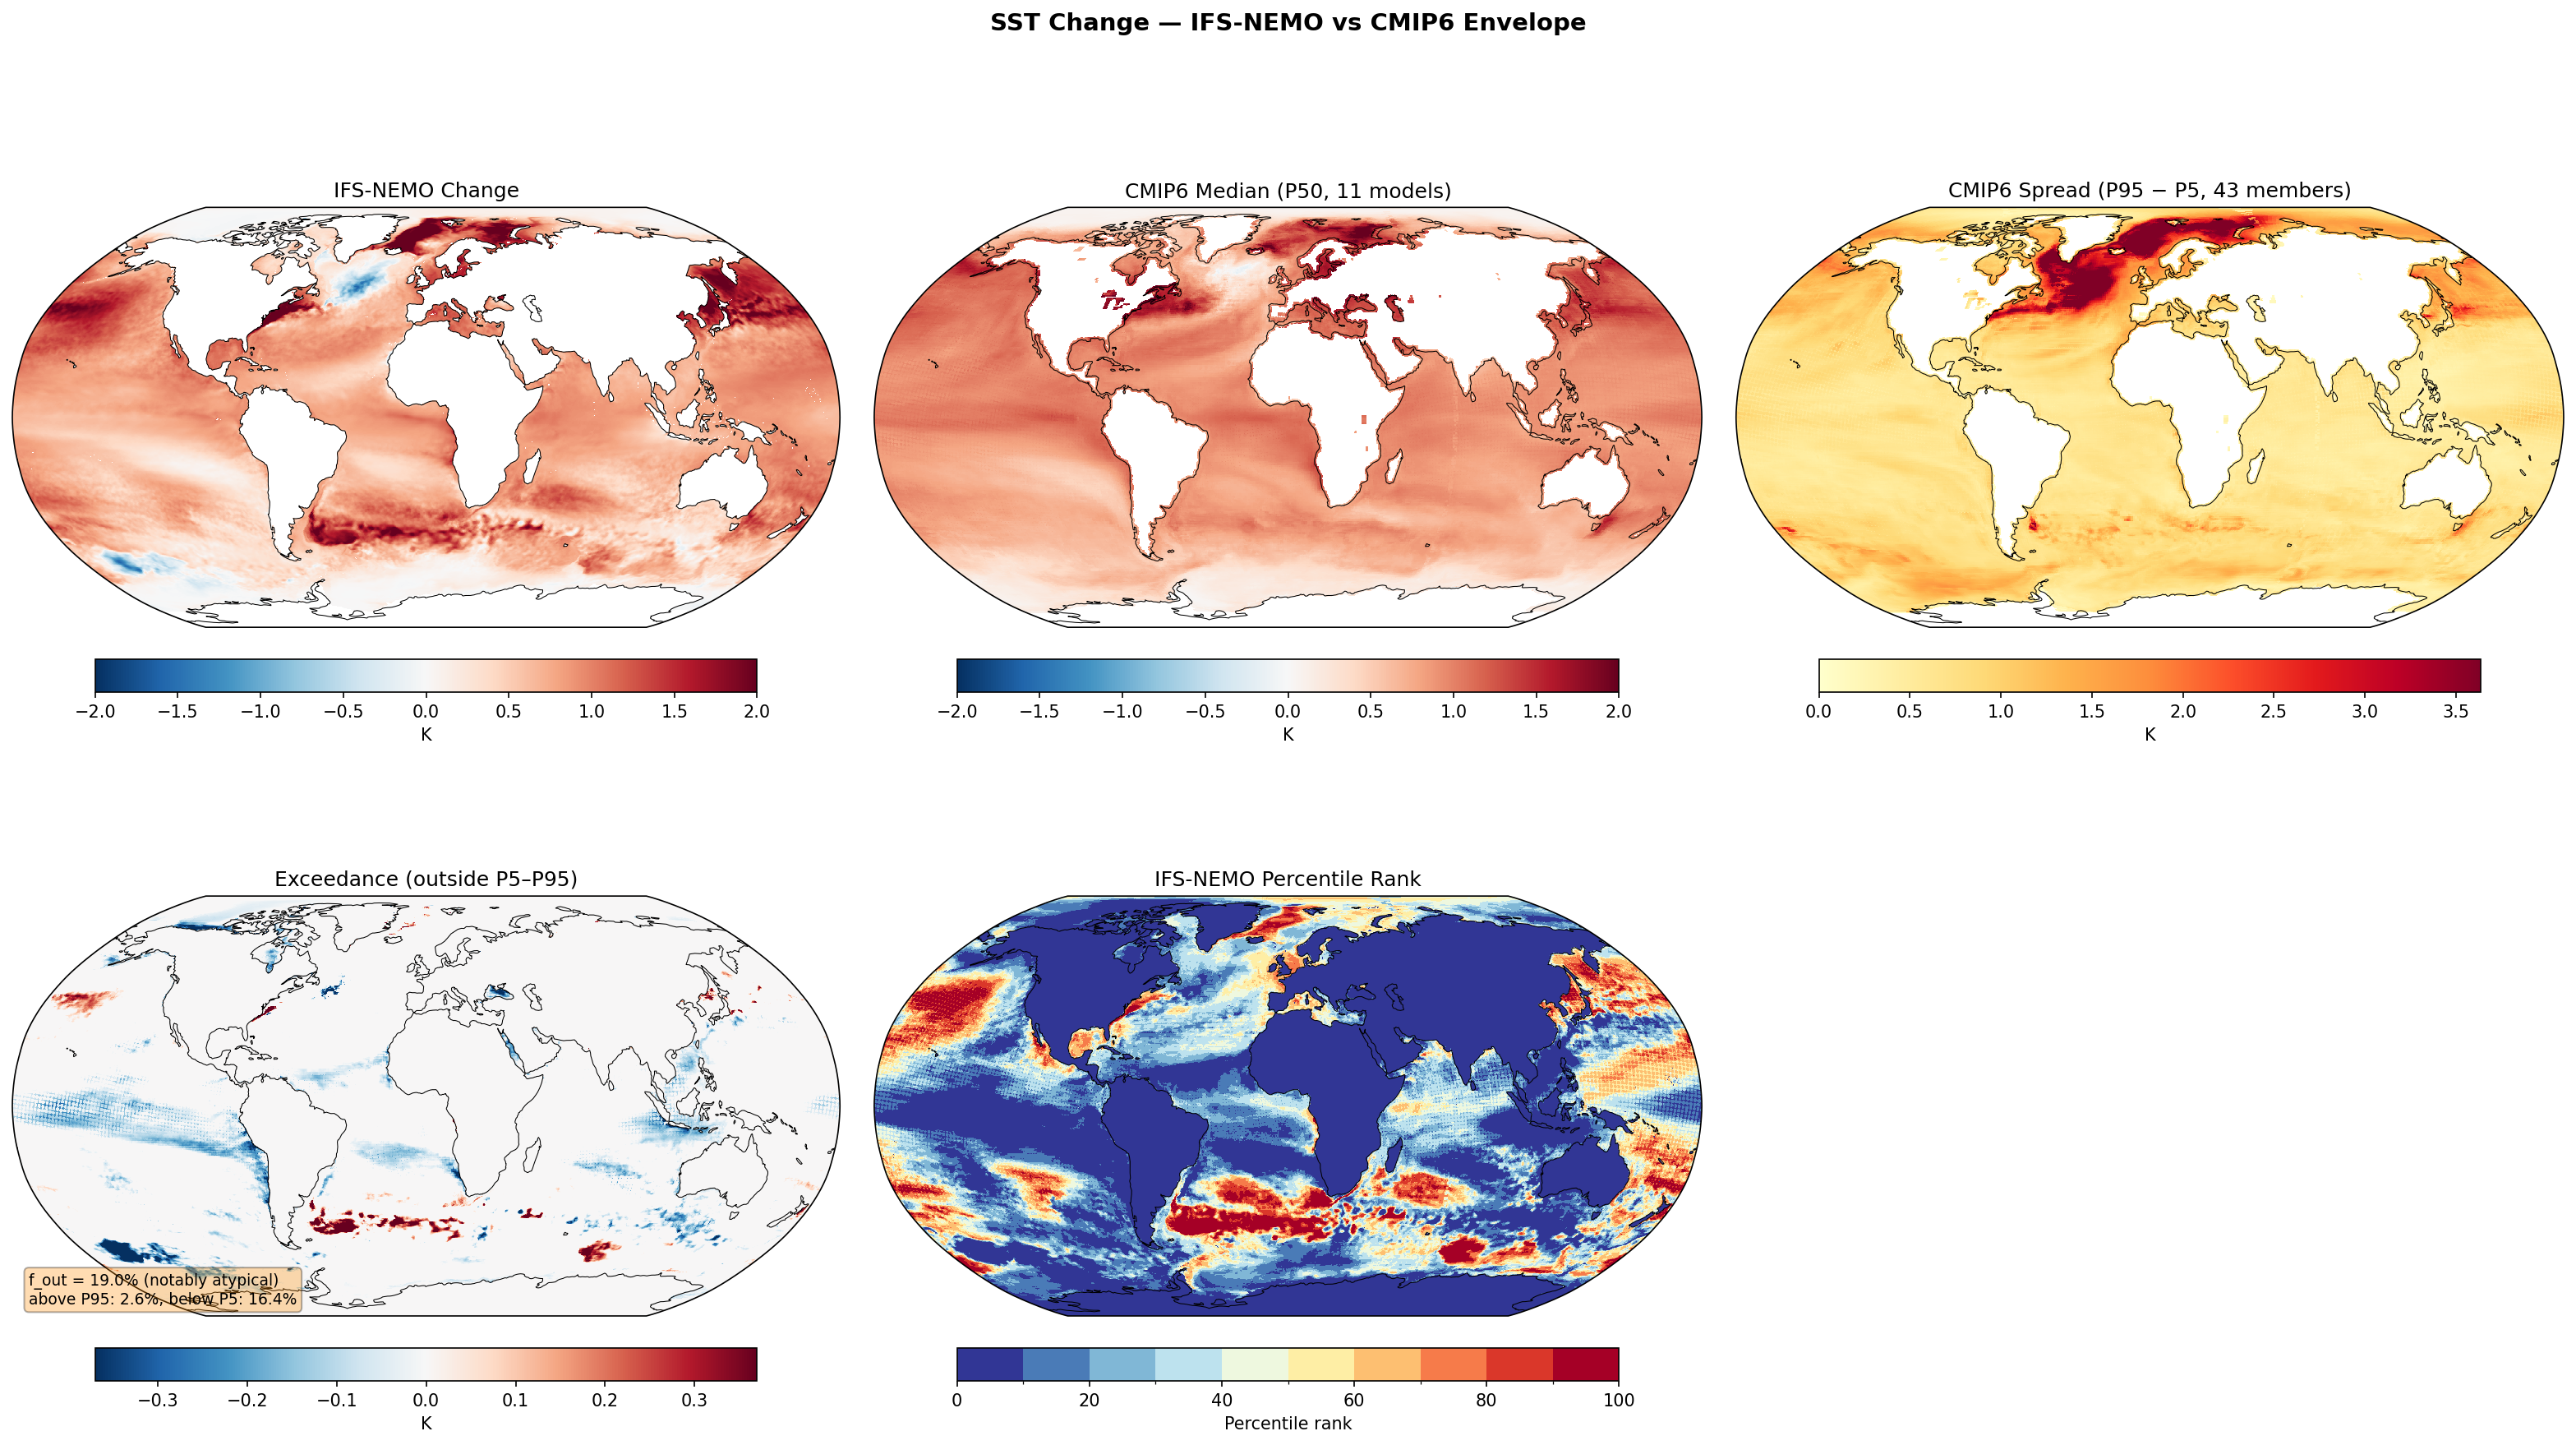
SST Change — IFS-NEMO vs CMIP6 Envelope f_out 19.0%
Envelope Metrics
| f_out (outside P5–P95) | 19.0% notably atypical |
|---|---|
| Above P95 | 2.6% |
| Below P5 | 16.4% |
| CMIP6 ensemble | 11 models, 43 members |
| Variables | avg_tos |
|---|---|
| Models | ifs-nemo |
| Units | K |
| Baseline | 1990-2014 |
| Future | 2040-2049 |
| Method | DestinE ΔSST compared to CMIP6 percentile envelope (P5, P50, P95). Exceedance shows where DestinE lies outside the P5–P95 range. |
Summary high
IFS-NEMO exhibits a notably atypical SST response (f_out = 19.0%) compared to the CMIP6 ensemble, primarily characterized by widespread areas of weaker warming or cooling (16.4% below P5), particularly in the North Atlantic and Southern Ocean.
Key Findings
- The North Atlantic warming hole is significantly deeper in IFS-NEMO than the CMIP6 P5 threshold, indicating a stronger local cooling response.
- IFS-NEMO shows widespread regions in the Southern Ocean and subtropical gyres where surface warming is significantly weaker than the CMIP6 ensemble range.
- Only 2.6% of the area exceeds the CMIP6 P95 upper bound, confirming the model's response is generally cooler than the multi-model consensus.
- Sharp, eddy-scale exceedance features appear along western boundary currents (e.g., Gulf Stream extension), reflecting resolution-driven dynamical differences.
Spatial Patterns
The most prominent feature is the intense cold anomaly (blue in Exceedance/Rank panels) in the North Atlantic subpolar gyre. Similarly, the Southern Ocean and parts of the South Pacific and Indian Ocean show percentile ranks consistently below 10. In contrast, the tropical basins and North Pacific generally fall within the CMIP6 interquartile range (ranks 25-75), though often leaning towards the cooler side of the distribution.
Model Agreement
IFS-NEMO agrees with the CMIP6 ensemble on the sign of warming in the tropics and North Pacific but disagrees on magnitude in deep convection regions. The model is within the CMIP6 envelope for most of the equatorial bands but falls outside (below P5) in high-latitude oceans.
Physical Interpretation
The deeper North Atlantic warming hole likely reflects a stronger or more localized AMOC slowdown and reduced northward heat transport, which is often better resolved in eddy-permitting ocean models like NEMO compared to coarse CMIP6 models. The muted warming in the Southern Ocean suggests efficient vertical heat uptake or distinct sea-ice dynamics typical of high-resolution coupled simulations, preventing the surface from warming as fast as the CMIP6 median.
Caveats
- The strong cooling signals could partially result from internal variability (e.g., phasing of multidecadal oscillations) differing from the CMIP6 ensemble mean.
- Differences in background state (baseline biases) between IFS-NEMO and CMIP6 could influence the calculated change anomalies.
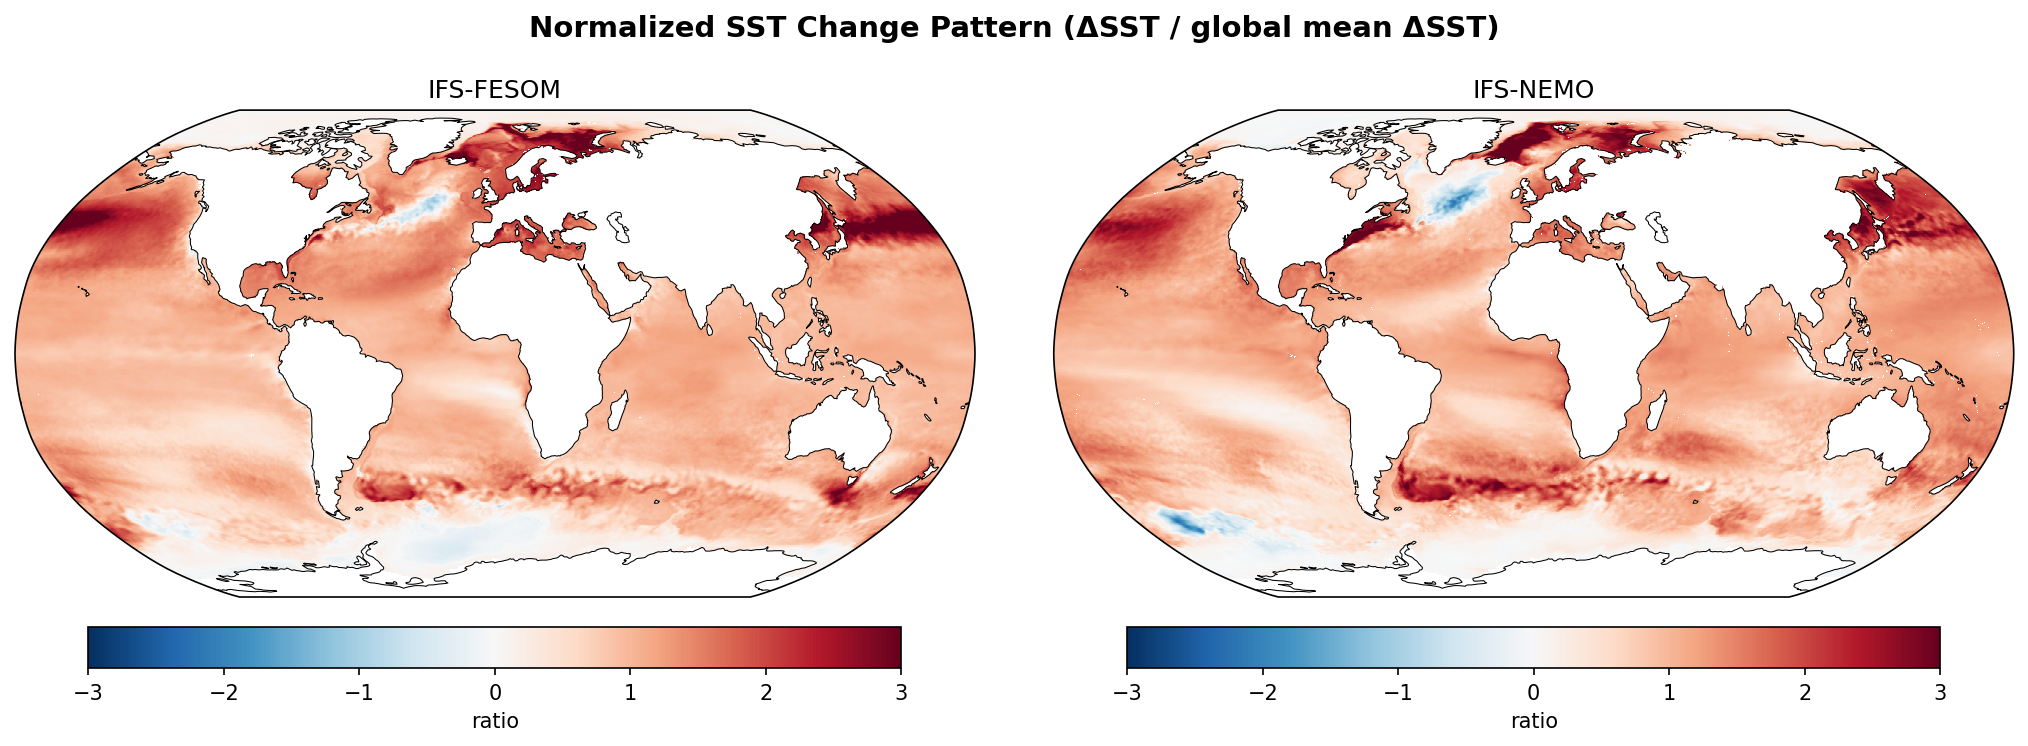
Normalized SST Pattern
| Variables | avg_tos |
|---|---|
| Models | ifs-fesom, ifs-nemo |
| Units | K |
| Baseline | 1990-2014 |
| Future | 2040-2049 |
| Method | ΔSST / mean(ΔSST). HealPix equal-area cells, simple .mean() is used. |
Summary high
The figure illustrates the normalized Sea Surface Temperature (SST) change pattern (2040–2049 relative to 1990–2014) for two high-resolution models, IFS-FESOM and IFS-NEMO. Both models consistently display strong Arctic amplification, western boundary current warming hotspots, and a distinct North Atlantic warming hole.
Key Findings
- Both models exhibit a pronounced 'warming hole' in the subpolar North Atlantic (blue colors), indicating local cooling or suppressed warming relative to the global mean.
- Regions of intense relative warming (ratio > 2) are found along the extensions of the Gulf Stream and Kuroshio currents, suggesting poleward shifts of these boundary currents.
- IFS-NEMO resolves sharp, frontal-scale warming features in the Southern Ocean (e.g., Agulhas Return Current) that are smoother in IFS-FESOM.
- Arctic amplification is a dominant feature, with surface warming rates exceeding 3 times the global average in marginal sea ice zones.
Spatial Patterns
The global pattern is characterized by inter-hemispheric asymmetry, with the Northern Hemisphere warming faster. Notable features include the North Atlantic warming hole south of Greenland, enhanced warming bands along the western boundaries of the Atlantic and Pacific basins (30°N–50°N), and broad areas of slower-than-average warming (ratios < 1) in the Southern Ocean and eastern subtropical Pacific.
Model Agreement
There is high agreement between IFS-FESOM and IFS-NEMO on the large-scale structure of SST change, particularly the location of the North Atlantic warming hole and the intensification of western boundary currents. Disagreement is primarily morphological: IFS-NEMO displays sharper, more filamentary structures in the Southern Ocean and a slightly more concentrated cooling signal in the North Atlantic compared to the smoother fields of IFS-FESOM.
Physical Interpretation
The North Atlantic warming hole is a fingerprint of AMOC slowdown, reducing northward heat transport. The localized warming along the Gulf Stream and Kuroshio extensions is likely driven by the poleward shift of subtropical gyres and boundary currents under warming. High values in the Arctic reflect the sea-ice albedo feedback. The finer-scale structures in IFS-NEMO in the Southern Ocean likely reflect better-resolved mesoscale eddy dynamics and frontal shifts compared to the unstructured mesh approach or effective resolution of IFS-FESOM in that region.
Caveats
- The analysis is based on a relatively short 10-year future window (2040–2049), meaning internal decadal variability (e.g., IPO, AMO phases) could significantly modulate the forced climate change signal.
- The 'cooling' in the North Atlantic (negative ratio) implies absolute temperature drop only if the magnitude exceeds the global mean warming; otherwise it represents suppressed warming.