Tier 1 Surface Albedo CMIP6
Synthesis
Related diagnostics
Surface Albedo Change (Global)
| Variables | avg_snswrf, avg_sdswrf |
|---|---|
| Models | ifs-fesom, ifs-nemo |
| Units | W/m2 |
| Baseline | 1990-2014 |
| Future | 2040-2049 |
| Method | α = 1 − (net_SW / down_SW). Δα = α_future − α_historical. |
Summary high
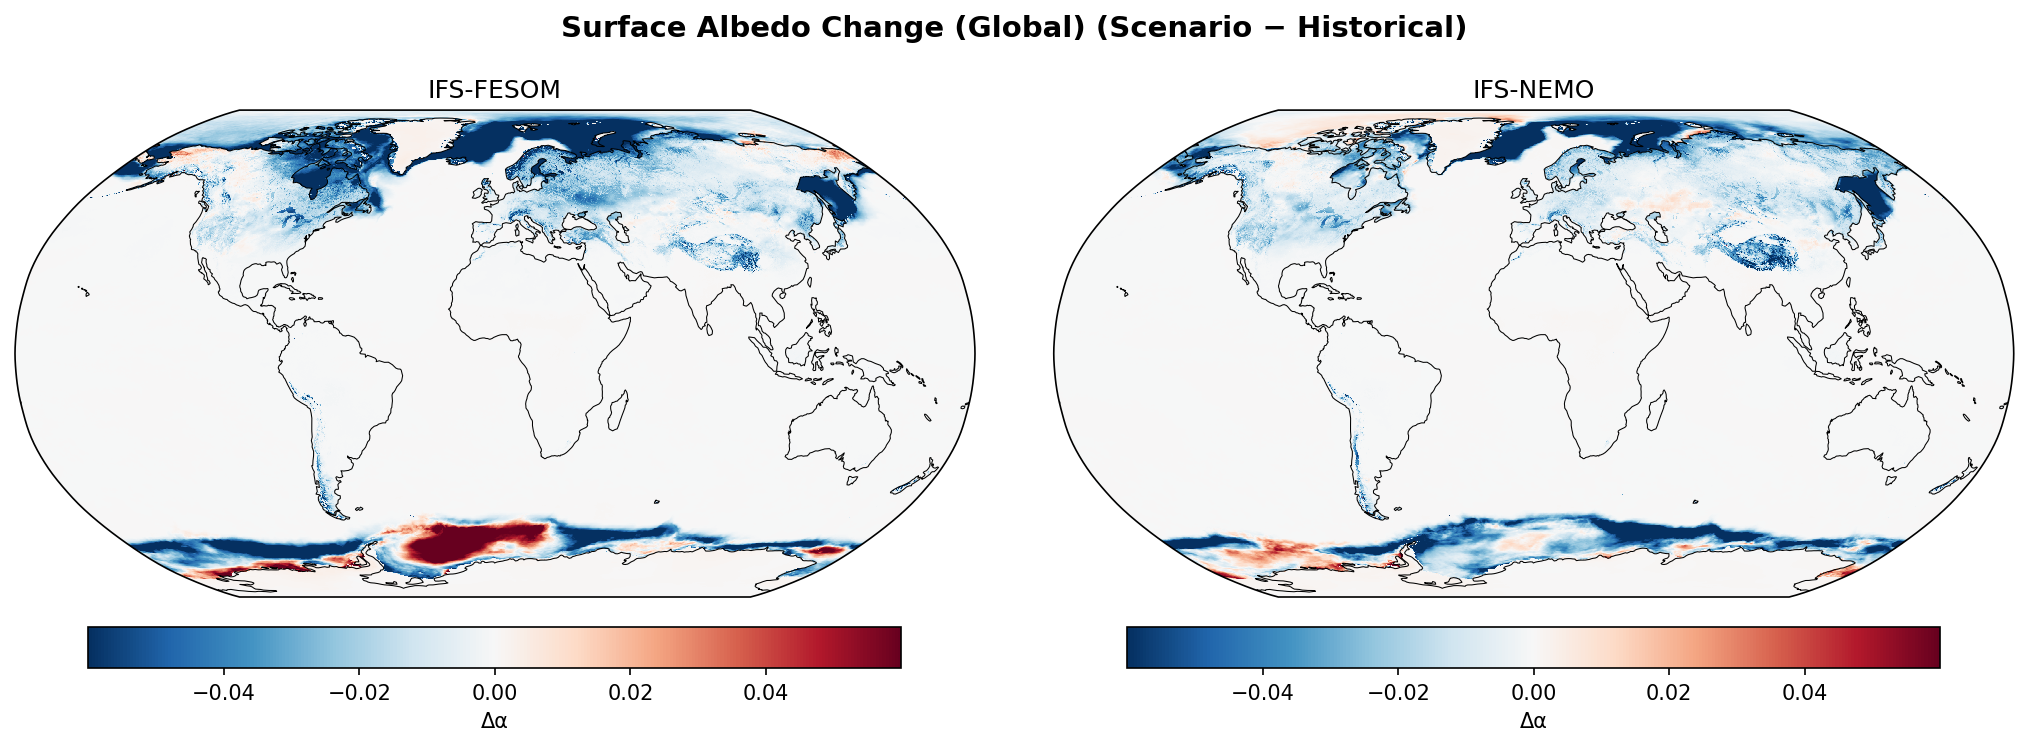
The figure illustrates global surface albedo changes between the future (2040–2049) and historical baseline (1990–2014) for IFS-FESOM and IFS-NEMO. Both models exhibit the expected darkening signal (albedo reduction) at high latitudes due to melting snow and sea ice, though IFS-FESOM displays a distinct positive anomaly in the Weddell Sea.
Key Findings
- Widespread darkening (negative albedo change) is observed in the Northern Hemisphere high latitudes, corresponding to reductions in Arctic sea ice and continental snow cover.
- IFS-FESOM and IFS-NEMO show consistent darkening over Northern Hemisphere land areas (Scandinavia, Siberia, Canada) and the Tibetan Plateau.
- A significant divergence occurs in the Southern Hemisphere Weddell Sea: IFS-NEMO shows darkening consistent with sea ice loss, whereas IFS-FESOM shows a strong regional albedo increase (brightening).
- IFS-FESOM predicts more intense darkening in Hudson Bay and parts of the Canadian Archipelago compared to IFS-NEMO.
Spatial Patterns
The dominant pattern is polar amplification of albedo reduction. In the Northern Hemisphere, darkening is continuous across the Arctic Ocean margin and sub-arctic land masses. In the Southern Hemisphere, darkening is focused along the Antarctic sea ice edge. Tropical and mid-latitude regions show negligible change (white), as surface albedo is relatively static outside the cryosphere on these timescales.
Model Agreement
The models agree well on the sign and spatial distribution of changes in the Northern Hemisphere (Arctic amplification/snow-albedo feedback). Disagreement is prominent in the Southern Ocean, specifically the Weddell Sea, where IFS-FESOM indicates an albedo increase while IFS-NEMO indicates a decrease.
Physical Interpretation
The primary driver is the surface albedo feedback: warming temperatures melt high-albedo snow and sea ice, exposing darker land or ocean surfaces. The anomalous albedo increase in the Weddell Sea in IFS-FESOM suggests a local increase in sea ice concentration or extent relative to the baseline. This could result from significant internal variability (e.g., the closing of a baseline open-ocean polynya or a phase shift in Southern Ocean convection) rather than a forced climate response, especially given the short 10-year averaging period.
Caveats
- The 10-year averaging period (2040-2049) is relatively short, making the results sensitive to decadal internal variability, particularly in the Southern Ocean sea ice dynamics.
- The positive albedo change in IFS-FESOM is counter-intuitive for a warming scenario and likely reflects variability rather than a forced trend.
Surface Albedo Change (North Polar)
| Variables | avg_snswrf, avg_sdswrf |
|---|---|
| Models | ifs-fesom, ifs-nemo |
| Units | W/m2 |
| Baseline | 1990-2014 |
| Future | 2040-2049 |
| Method | α = 1 − (net_SW / down_SW). Δα = α_future − α_historical. |
Summary high
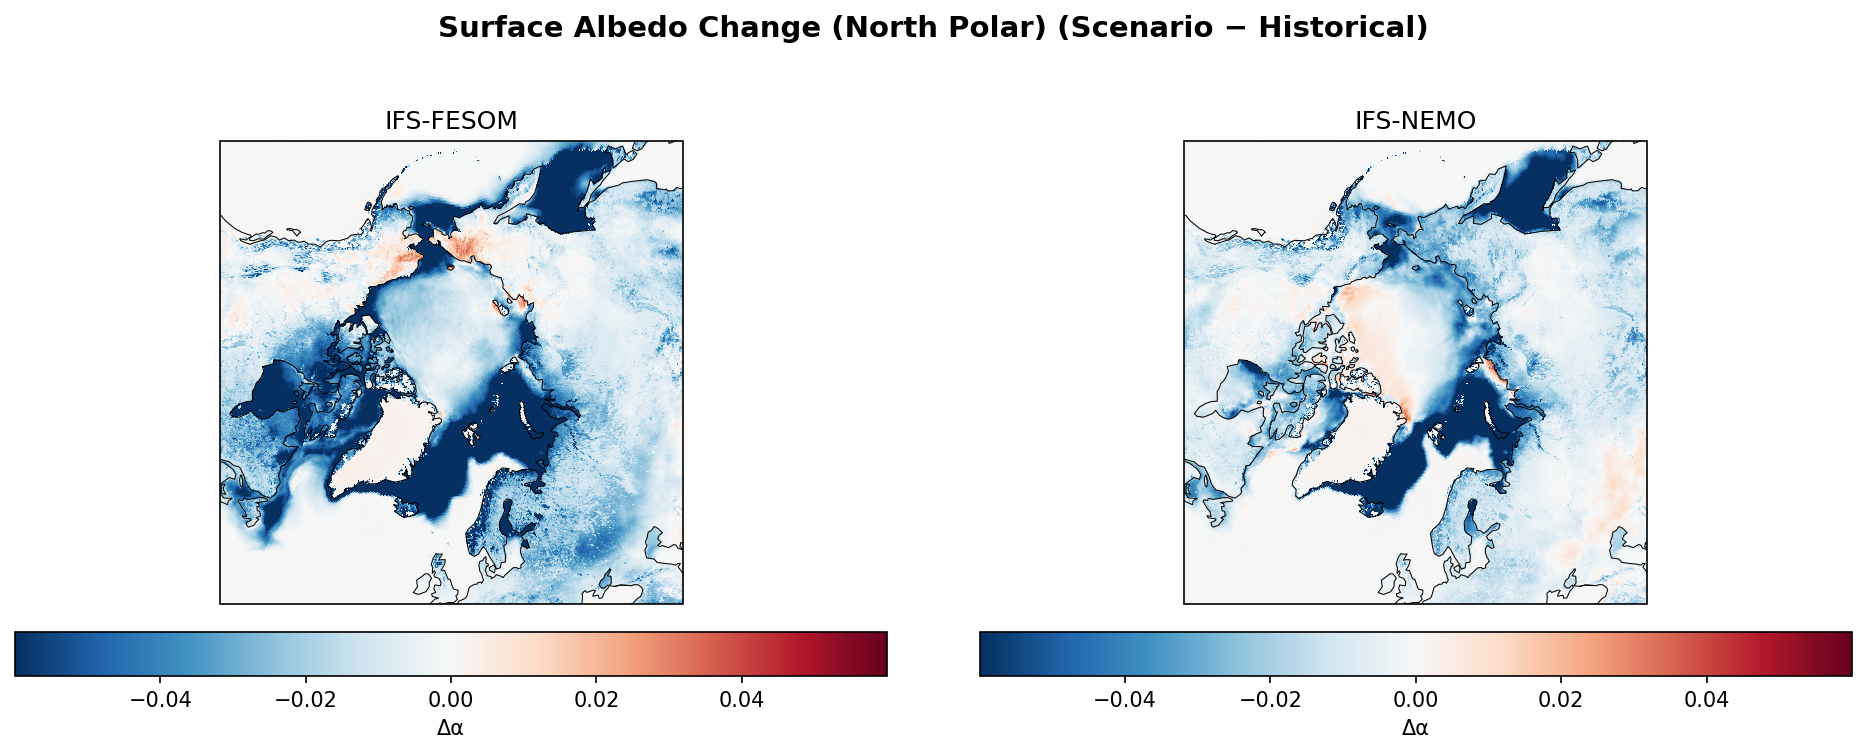
The figure displays projected surface albedo changes in the North Polar region for the 2040s (SSP3-7.0) relative to a 1990-2014 baseline for two high-resolution coupled models, IFS-FESOM and IFS-NEMO. Both models predict widespread albedo reductions driven by cryospheric retreat, though they diverge notably in the response of the central Arctic pack ice.
Key Findings
- Widespread darkening (negative albedo change) is observed over the marginal Arctic seas (Barents, Kara, Chukchi), Hudson Bay, and high-latitude land areas.
- A counter-intuitive region of increased albedo (positive change) appears in the Central Arctic/Beaufort Gyre, significantly more pronounced and spatially extensive in IFS-NEMO than in IFS-FESOM.
- The strongest reductions in albedo occur in the Barents Sea and Hudson Bay, indicative of substantial sea ice loss in these regions.
Spatial Patterns
The spatial distribution is characterized by a strong negative signal along the marginal ice zones and continental snow lines. Specifically, the Barents-Kara sector and Hudson Bay show deep blue anomalies (strong darkening). Over land, Northern Canada, Scandinavia, and Siberia show widespread moderate darkening. In contrast, the Central Arctic Ocean north of the Canadian Archipelago shows a localized patch of brightening (red), which is the primary area of model divergence.
Model Agreement
IFS-FESOM and IFS-NEMO agree strongly on the pattern and magnitude of albedo reduction due to sea ice and snow loss in peripheral regions. However, they disagree on the magnitude of the positive anomaly in the central Arctic; IFS-NEMO simulates a broad, intense region of brightening, whereas IFS-FESOM shows a much smaller, fragmented feature.
Physical Interpretation
The widespread negative albedo change is driven by the snow-and-ice albedo feedback: warming causes sea ice melt and terrestrial snow retreat, exposing darker ocean and land surfaces. The localized positive albedo change in the central Arctic likely results from either increased snowfall on top of the sea ice (due to enhanced evaporation/precipitation in a warmer Arctic) or dynamical ice convergence in the Beaufort Gyre, which may thicken the ice or increase concentration locally relative to the baseline.
Caveats
- The 10-year averaging period (2040-2049 vs 1990-2014) is relatively short, meaning the positive albedo anomaly in the central Arctic could be influenced by decadal internal variability (e.g., wind-driven ice drift patterns) rather than a long-term forced trend.
- Differences in sea ice physics and coupling between FESOM (unstructured grid) and NEMO likely contribute to the discrepancy in the central Arctic response.
Surface Albedo Change (South Polar)
| Variables | avg_snswrf, avg_sdswrf |
|---|---|
| Models | ifs-fesom, ifs-nemo |
| Units | W/m2 |
| Baseline | 1990-2014 |
| Future | 2040-2049 |
| Method | α = 1 − (net_SW / down_SW). Δα = α_future − α_historical. |
Summary high
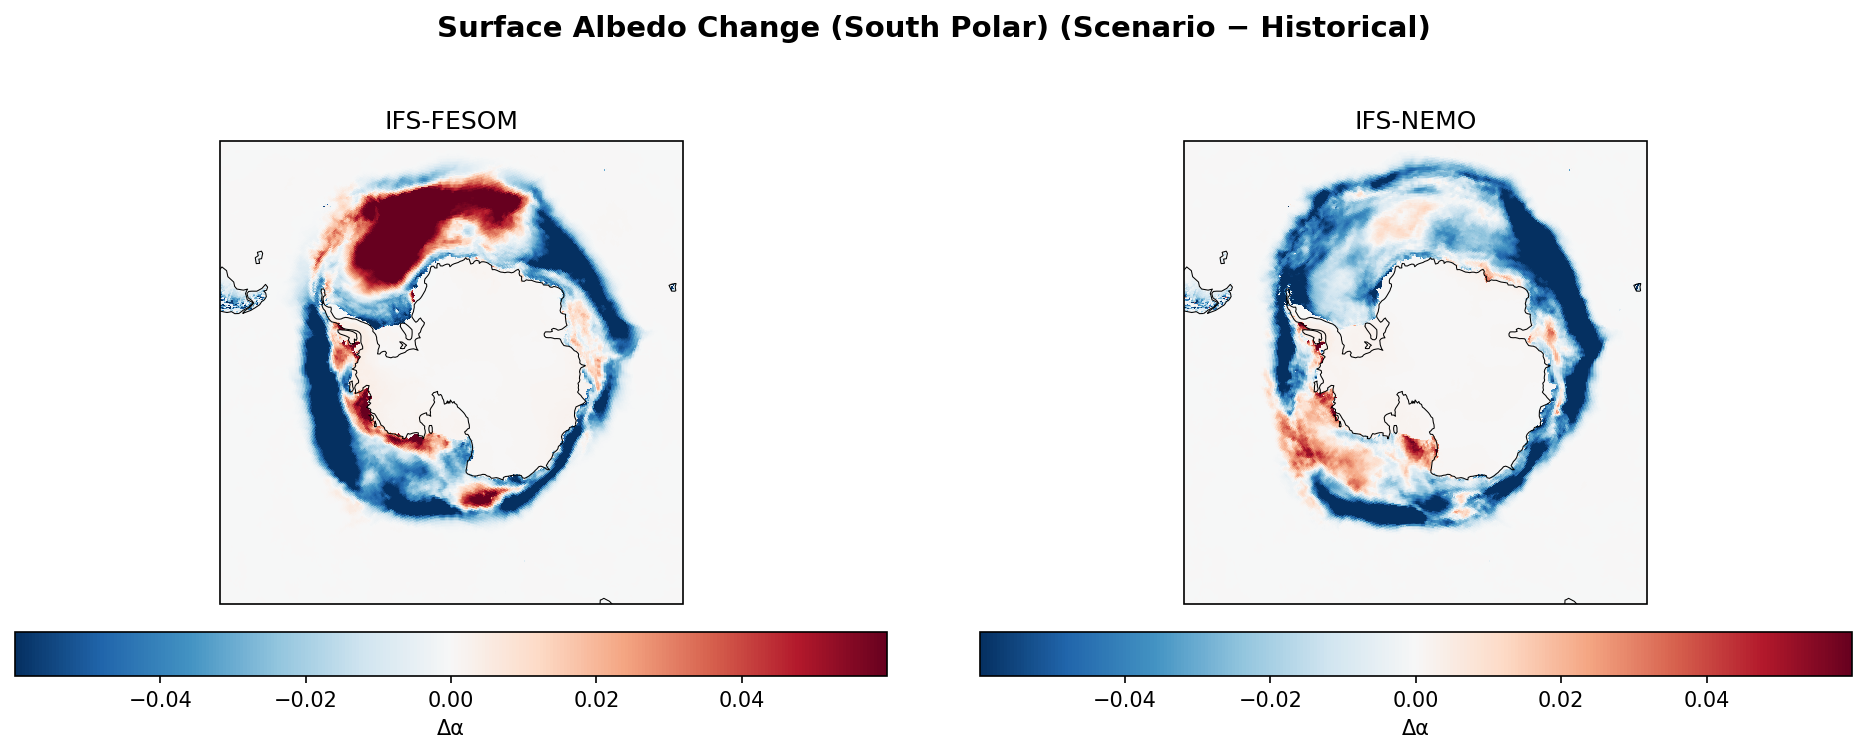
The figure displays the change in surface albedo over the South Polar region (2040–2049 vs 1990–2014) for two high-resolution coupled models. While IFS-NEMO shows a consistent, zonally symmetric reduction in albedo due to sea ice loss, IFS-FESOM exhibits a highly heterogeneous response with a prominent region of albedo increase in the Atlantic sector.
Key Findings
- IFS-NEMO depicts a classic sea-ice albedo feedback pattern: a ring of decreased albedo (dark blue, Δα < -0.04) surrounding Antarctica, indicating widespread sea ice retreat.
- IFS-FESOM displays a contrasting dipole in the Weddell Sea/Atlantic sector: while coastal areas darken (ice loss), a large offshore region (approx. 0–60°E, 55–65°S) shows a strong increase in albedo (dark red, Δα > +0.04).
- Both models show albedo reductions in the Bellingshausen and Amundsen Seas, though the spatial extent is broader in IFS-NEMO.
- The background ocean albedo (open water) remains unchanged (near zero Δα), confirming the signals are confined to the cryosphere-ocean interface.
Spatial Patterns
IFS-NEMO presents a relatively annular structure of albedo decrease corresponding to the marginal ice zone. In contrast, IFS-FESOM is dominated by a massive positive anomaly in the Atlantic sector of the Southern Ocean and a more complex, less zonally symmetric pattern of decreases elsewhere.
Model Agreement
The models agree on the sign of change (darkening) in the Pacific and Indian sectors close to the continent, consistent with thermodynamic sea ice loss. They disagree fundamentally in the Atlantic sector, where IFS-NEMO simulates retreat while IFS-FESOM simulates a signal consistent with substantial sea ice expansion or increased persistence.
Physical Interpretation
The widespread negative albedo change (blue) is driven by the retreat of sea ice and snow cover, exposing lower-albedo ocean water (sea-ice albedo feedback). The anomalous positive change (red) in IFS-FESOM is likely due to internal variability rather than a forced response to SSP3-7.0. Specifically, this pattern is characteristic of the presence of an open-ocean polynya (e.g., Weddell Polynya) in the historical baseline that is absent or smaller in the future period, or a significant decadal fluctuation in sea ice export/extent in the FESOM simulation.
Caveats
- The relatively short 10-year averaging periods (2040-2049 vs 1990-2014) make the analysis highly sensitive to decadal internal variability (e.g., Southern Ocean convection events/polynyas), particularly in eddy-resolving models like IFS-FESOM.
- The strong positive anomaly in IFS-FESOM should not be interpreted as a robust climate change signal without inspecting longer time series.