Tier 1 Seasonal Decomposition CMIP6 f_out 21.6%
CMIP6 Envelope Comparison
DestinE anomalies compared to the CMIP6 P5–P95 percentile envelope derived from 51 ensemble members across 11 models under SSP3-7.0.
Contributing models: ACCESS-ESM1-5, AWI-CM-1-1-MR, CNRM-CM6-1, CNRM-ESM2-1, EC-Earth3, FGOALS-g3, GISS-E2-1-G, INM-CM5-0, IPSL-CM6A-LR, MPI-ESM1-2-LR, MRI-ESM2-0
Outside CMIP6 does not mean wrong — it indicates an uncommon response within the CMIP6 distribution.
Synthesis
Related diagnostics
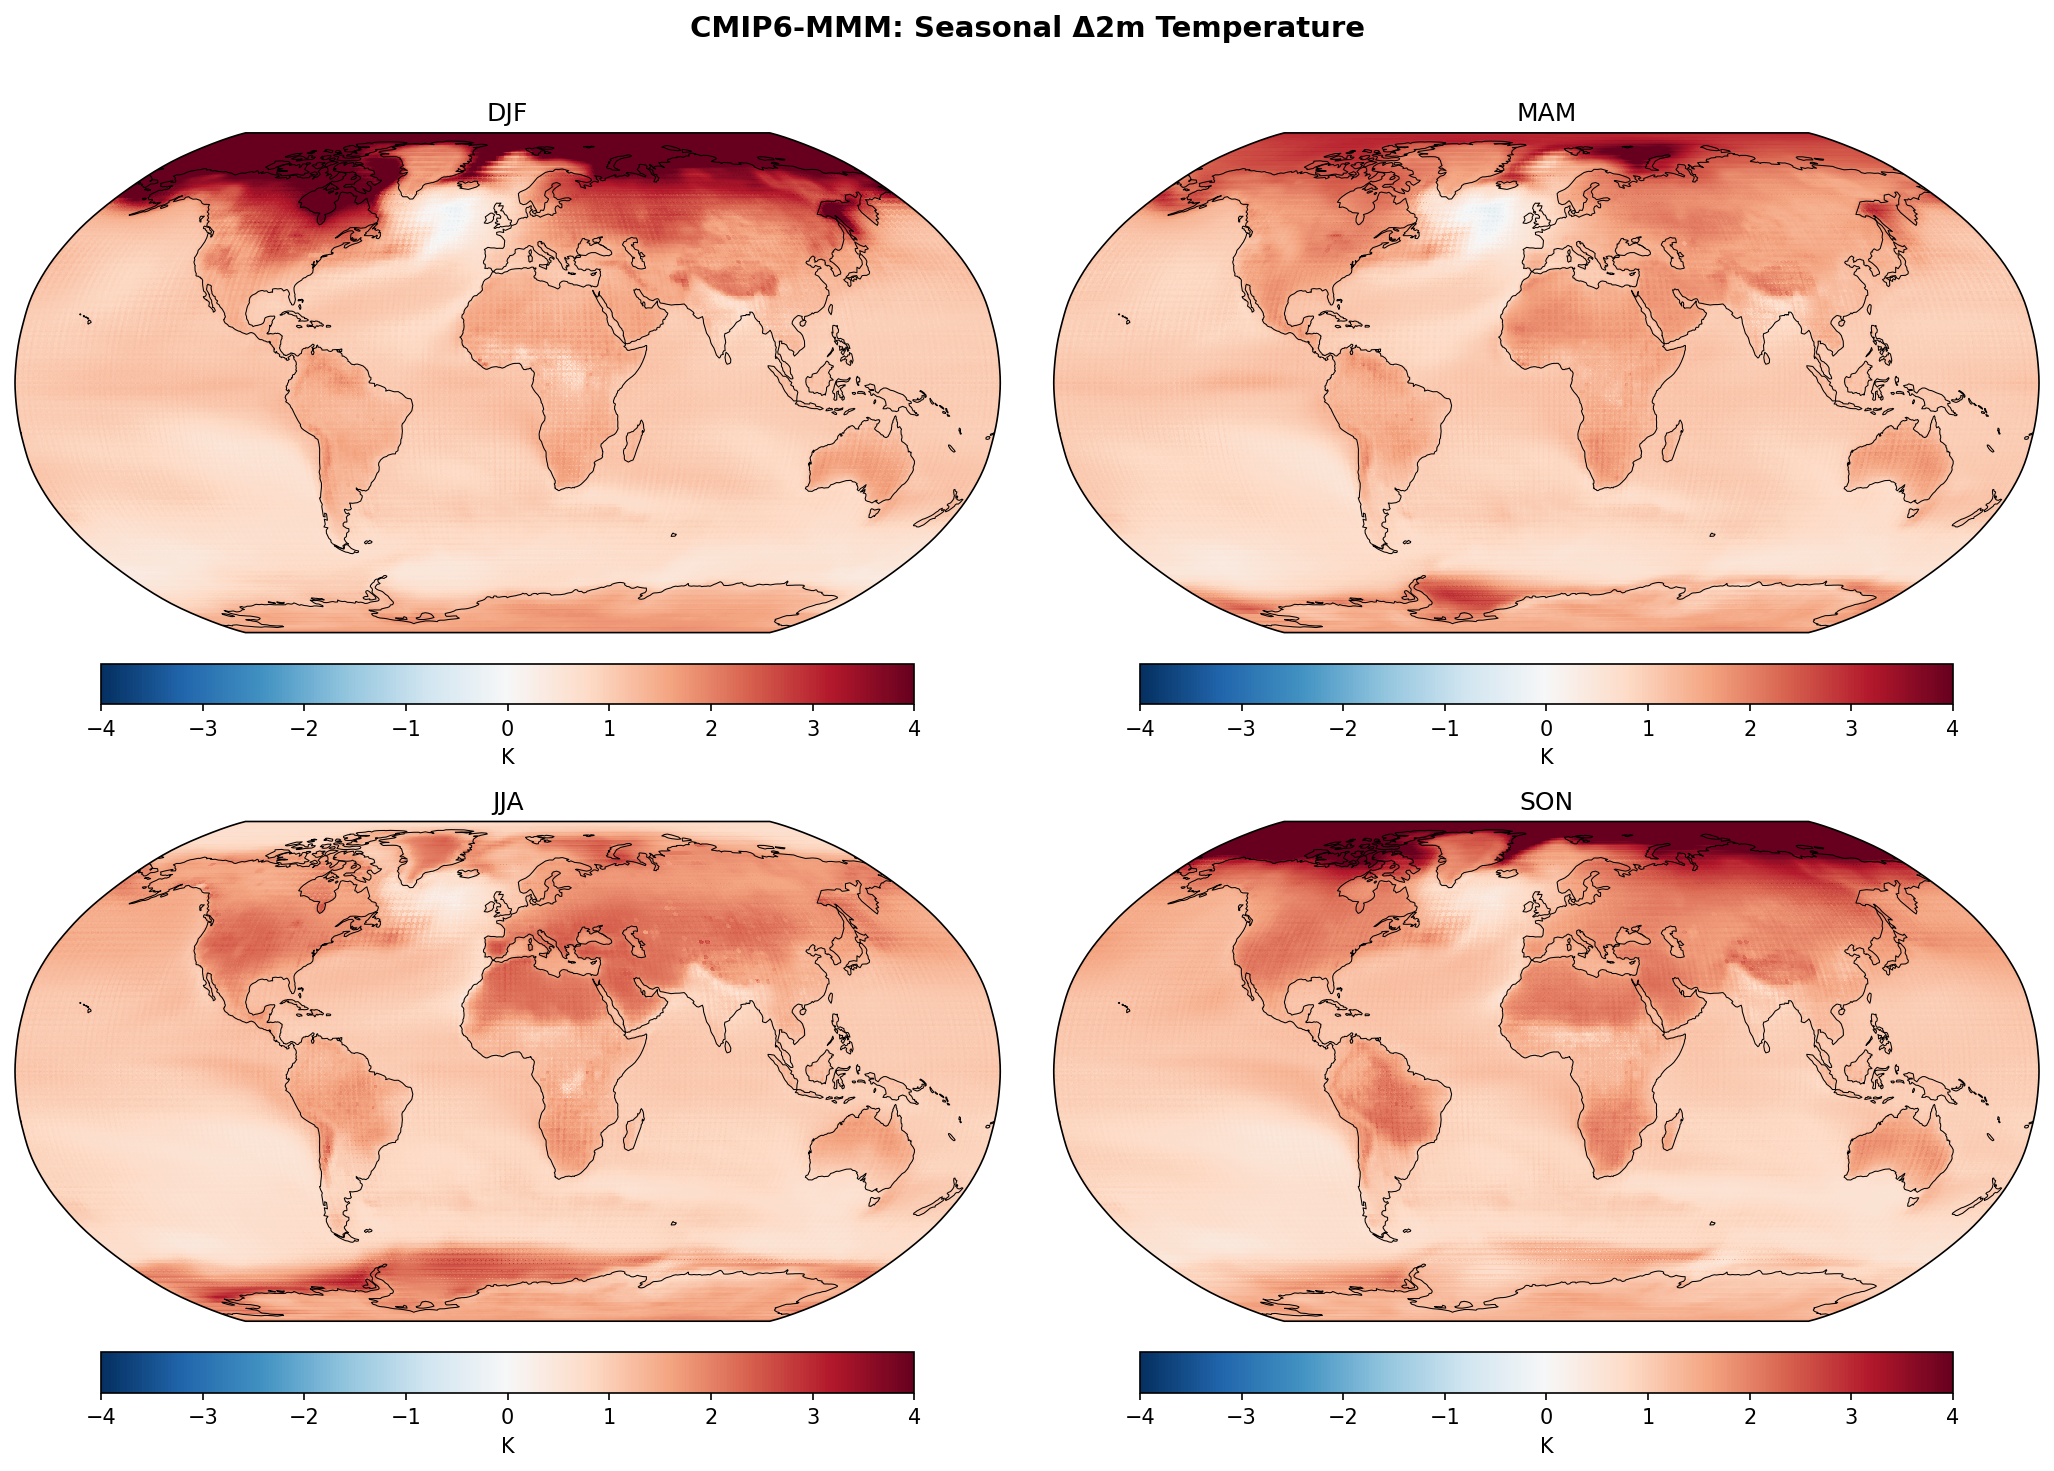
Seasonal 2m Temperature Change — CMIP6-MMM
| Variables | avg_2t |
|---|---|
| Models | CMIP6-MMM |
| Units | K |
| Baseline | 1990-2014 |
| Future | 2040-2049 |
| Method | Per-season future mean minus historical mean. Shared colorbar across all models. |
Summary high
This figure illustrates the seasonal evolution of 2m temperature changes for the 2040–2049 period relative to 1990–2014 under the SSP3-7.0 scenario, derived from the CMIP6 Multi-Model Mean (MMM). The plots reveal robust global warming characterized by distinct seasonal variations in polar amplification and land-sea contrasts.
Key Findings
- Arctic amplification is the dominant feature in DJF and SON, with warming exceeding the 4 K saturation limit of the color scale.
- A persistent 'warming hole' (neutral to slightly negative change) is visible in the subpolar North Atlantic across all seasons, indicative of AMOC weakening.
- Boreal summer (JJA) exhibits the weakest Arctic warming (~1 K) but strong continental warming over Northern Hemisphere landmasses (2–3 K), particularly in the Mediterranean and North America.
- Land areas consistently warm faster than oceans, with global oceans generally showing moderate warming of 0.5–1.5 K.
Spatial Patterns
The spatial distribution shows a strong meridional gradient in the Northern Hemisphere during winter (DJF) and autumn (SON), driven by polar amplification. In contrast, the Southern Hemisphere shows more zonal uniformity, with Antarctica warming significantly in its winter (JJA) and spring (SON). The North Atlantic warming hole is spatially coherent south of Greenland. Continental interiors, especially in Central Asia and North America, show enhanced warming relative to coastal zones.
Model Agreement
As a mean of 51 models, this figure represents the high-confidence consensus of the CMIP6 ensemble. The smoothness of the fields suggests that internal variability has been effectively averaged out, isolating the forced response. The presence of the North Atlantic warming hole in the mean indicates this is a robust structural feature across the CMIP6 generation.
Physical Interpretation
The extreme Arctic warming in DJF/SON is driven by the sea-ice albedo feedback and the release of heat stored in the newly open ocean during autumn/winter. In JJA, energy is consumed by sea-ice melting (latent heat) rather than surface warming, clamping temperatures near freezing. The North Atlantic warming hole is physically consistent with a slowdown of the Atlantic Meridional Overturning Circulation (AMOC), reducing northward heat transport. The enhanced land warming arises from the lower thermal inertia of land compared to the ocean and potential soil-moisture feedbacks in summer.
Caveats
- The Multi-Model Mean smooths out extreme responses found in individual models, potentially underestimating tail risks.
- The 10-year averaging period (2040-2049) is relatively short, though the large ensemble size (51 models) compensates for internal variability.
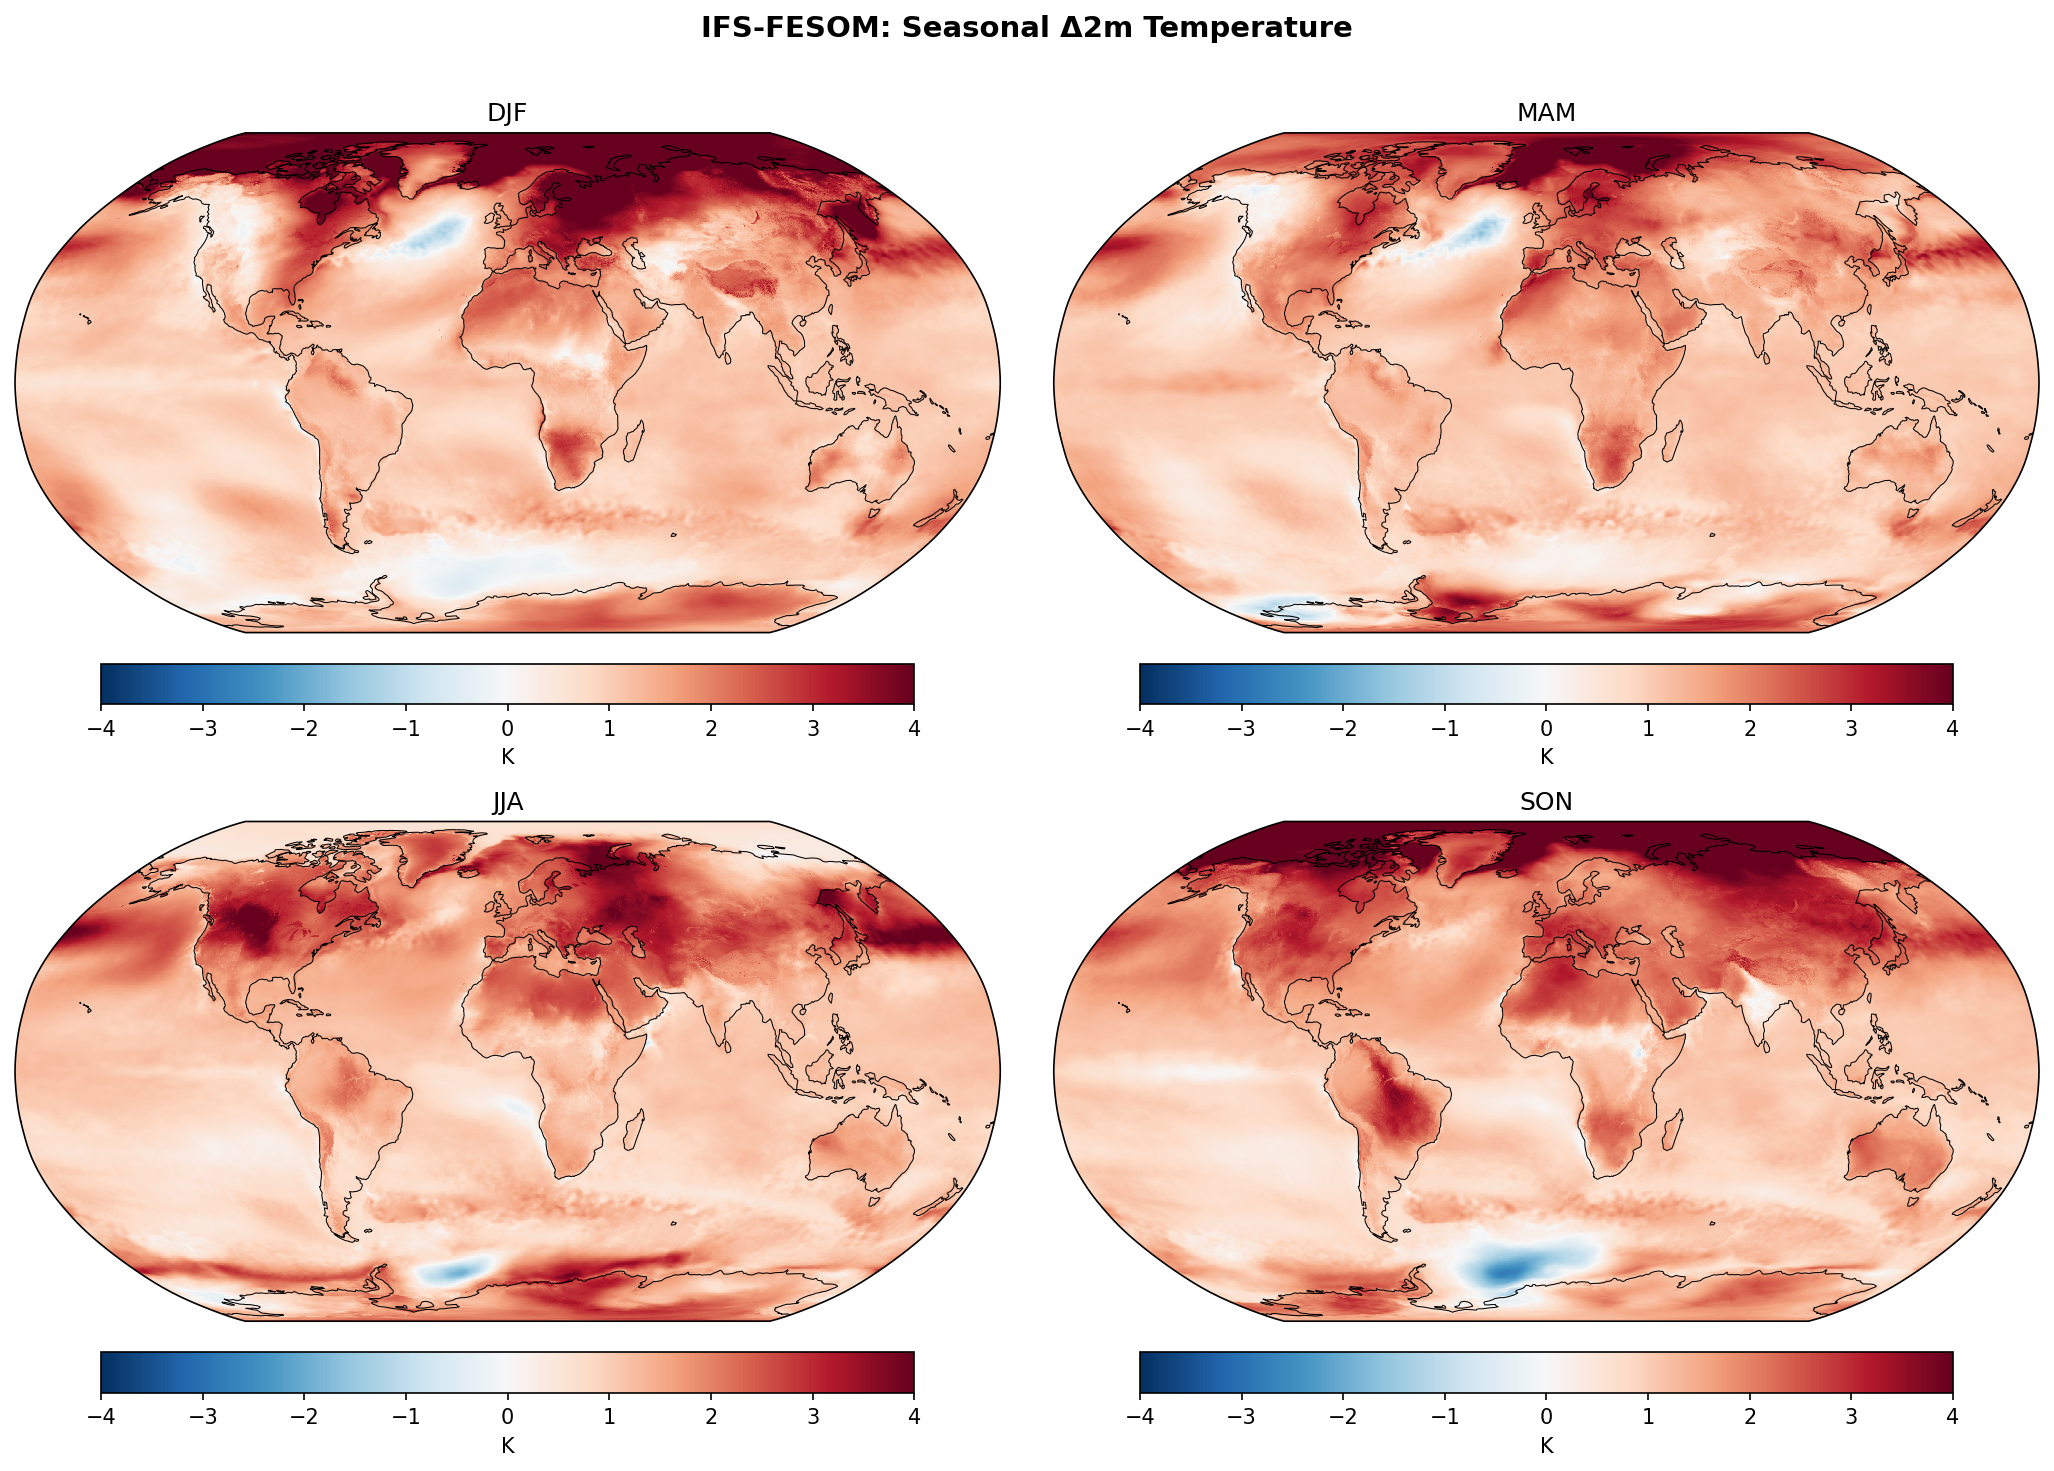
Seasonal 2m Temperature Change — IFS-FESOM
| Variables | avg_2t |
|---|---|
| Models | ifs-fesom |
| Units | K |
| Baseline | 1990-2014 |
| Future | 2040-2049 |
| Method | Per-season future mean minus historical mean. Shared colorbar across all models. |
Summary high
IFS-FESOM projects global warming with distinct seasonal asymmetries, featuring intense Arctic amplification in boreal winter and strong continental warming in boreal summer, punctuated by localized cooling signals in the North Atlantic and Weddell Sea.
Key Findings
- Arctic Amplification is highly seasonal, exceeding 4 K in DJF and SON (boreal winter/autumn), while being less pronounced in JJA.
- A North Atlantic 'warming hole' (regional cooling) is clearly visible, particularly in DJF and MAM, indicating potential AMOC sensitivity.
- The Weddell Sea exhibits a prominent cooling signal (~-2 K to -3 K), which is most intense in SON and JJA.
- South America (Amazon basin) shows extreme warming in SON, likely driven by land-atmosphere feedbacks during the dry-to-wet transition.
Spatial Patterns
The model displays a classic land-sea warming contrast, with continents warming faster than oceans. Northern Hemisphere high latitudes dominate the warming signal in winter (DJF), while mid-latitude landmasses (Eurasia, North America) show peak warming in summer (JJA). Distinct oceanic cooling features break this pattern in the subpolar North Atlantic and the Southern Ocean.
Model Agreement
The broad patterns of Arctic amplification and land-sea contrast align with the CMIP6 ensemble. However, the sharp definition and magnitude of the North Atlantic warming hole and the specific cooling in the Weddell Sea are likely more pronounced in IFS-FESOM due to its higher resolution and specific ocean physics (unstructured grid) compared to the smoother CMIP6 multi-model mean.
Physical Interpretation
The North Atlantic cooling suggests a slowdown of the Atlantic Meridional Overturning Circulation (AMOC) or reduced northward heat transport. The Weddell Sea cooling in SON/JJA is likely associated with a shutdown of deep convection or changes in sea-ice dynamics in the FESOM ocean model. The intense continental warming in summer (JJA in NH, SON in Amazon) points to soil moisture depletion amplifying temperature responses.
Caveats
- The strong cooling in the Weddell Sea may be sensitive to model initialization or drift in deep water formation processes specific to the FESOM grid.
- Without a direct CMIP6 difference panel, the magnitude of deviation from the standard ensemble in these specific cooling regions is qualitative.
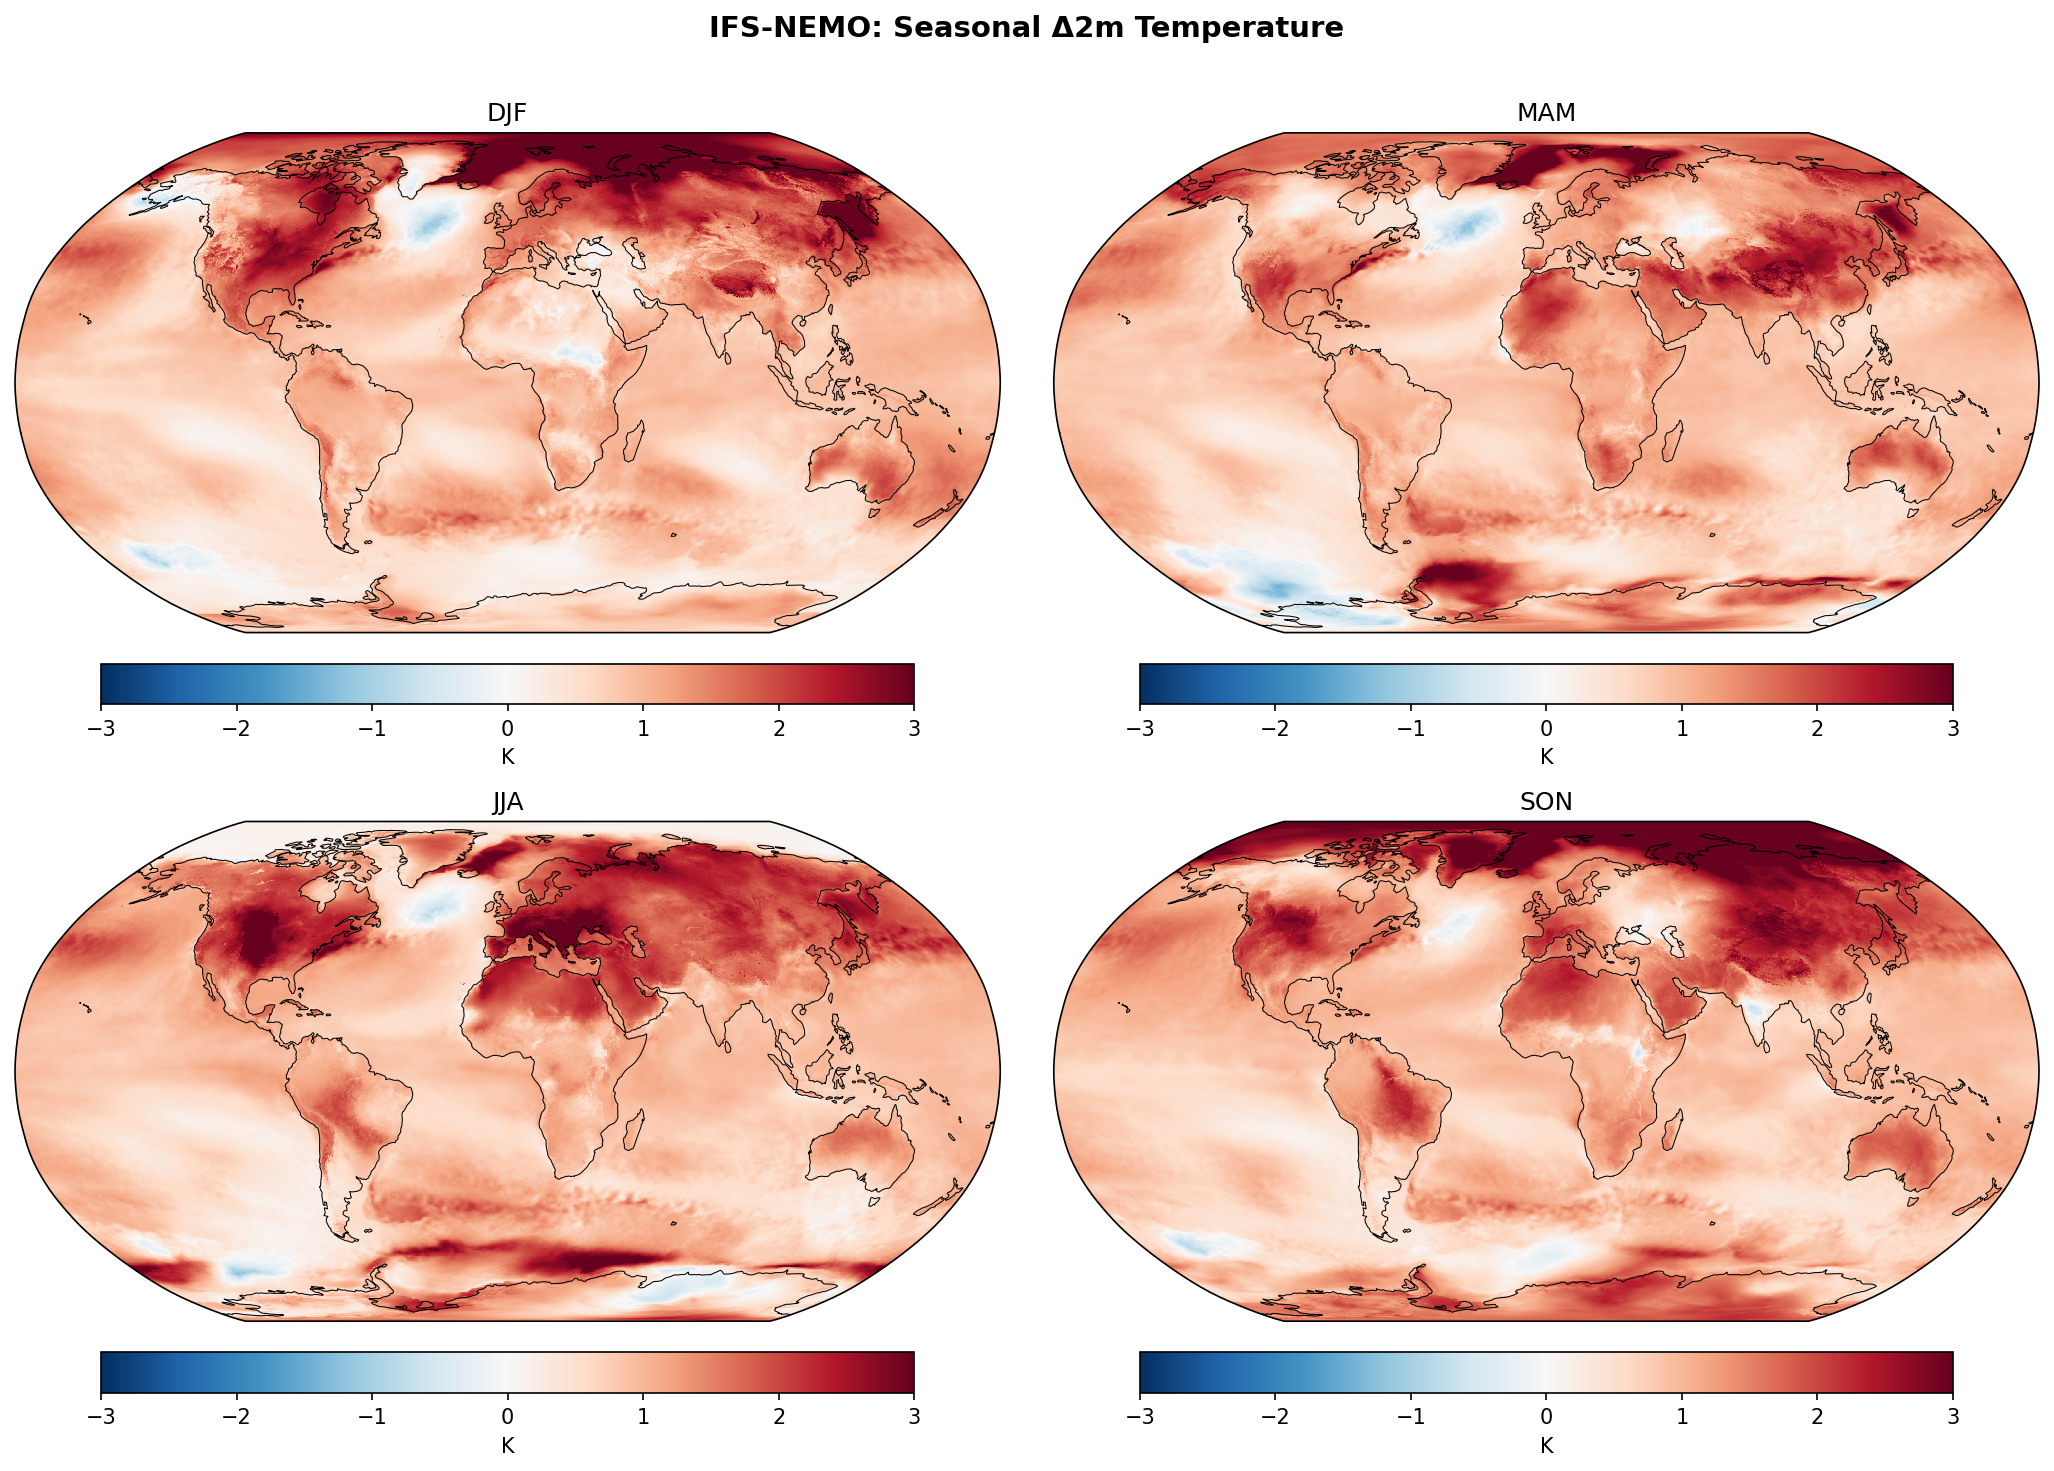
Seasonal 2m Temperature Change — IFS-NEMO
| Variables | avg_2t |
|---|---|
| Models | ifs-nemo |
| Units | K |
| Baseline | 1990-2014 |
| Future | 2040-2049 |
| Method | Per-season future mean minus historical mean. Shared colorbar across all models. |
Summary high
IFS-NEMO projects significant global seasonal warming by 2040–2049 (SSP3-7.0) relative to 1990–2014, dominated by intense Arctic Amplification in cold seasons and a persistent North Atlantic cooling signal.
Key Findings
- Extreme Arctic warming (>4 K) is observed in DJF and SON, significantly outpacing the global average.
- A prominent North Atlantic Warming Hole (absolute cooling of 1–2 K) persists across all seasons, strongest in DJF and MAM.
- European warming exhibits strong seasonality: Northern Europe warms most in winter (DJF), while Southern/Central Europe warms most in summer (JJA).
- Southern Ocean warming is muted, with localised cooling patches evident in the Weddell and Ross Seas during austral summer (DJF).
Spatial Patterns
The figure displays a classic land-sea warming contrast, with continents warming 1.5–2 times faster than adjacent oceans. The Northern Hemisphere high latitudes show the strongest signal, characterized by a 'red' Arctic in DJF/SON. Conversely, the North Atlantic subpolar gyre consistently shows a 'blue' cooling anomaly. In the tropics, warming is broad but moderate (1–2 K), while subtropical land areas (e.g., Mediterranean, Amazon) show enhanced warming in their respective dry/summer seasons.
Model Agreement
The general patterns (Arctic Amplification, land-sea contrast) align well with the broad CMIP6 consensus. However, the distinct area of absolute cooling in the North Atlantic is often more sharply defined in high-resolution models like IFS-NEMO compared to the coarser CMIP6 multi-model mean, which often shows only reduced warming. The strong summer warming over Southern Europe is also a robust feature consistent with CMIP6 projections of Mediterranean drying.
Physical Interpretation
The intense DJF/SON Arctic warming is driven by the sea-ice albedo feedback and the release of stored ocean heat to the atmosphere as ice cover retreats. The North Atlantic cooling is a signature of Atlantic Meridional Overturning Circulation (AMOC) slowdown, reducing northward heat transport. The summer (JJA) amplification over Europe and North America likely results from land-surface feedbacks, where soil moisture depletion limits evaporative cooling.
Caveats
- The 10-year future averaging period (2040–2049) may retain internal decadal variability noise compared to longer climatological means.
- The strong cooling in the Southern Ocean needs verification against sea-ice initialisation and drift in the coupled model.
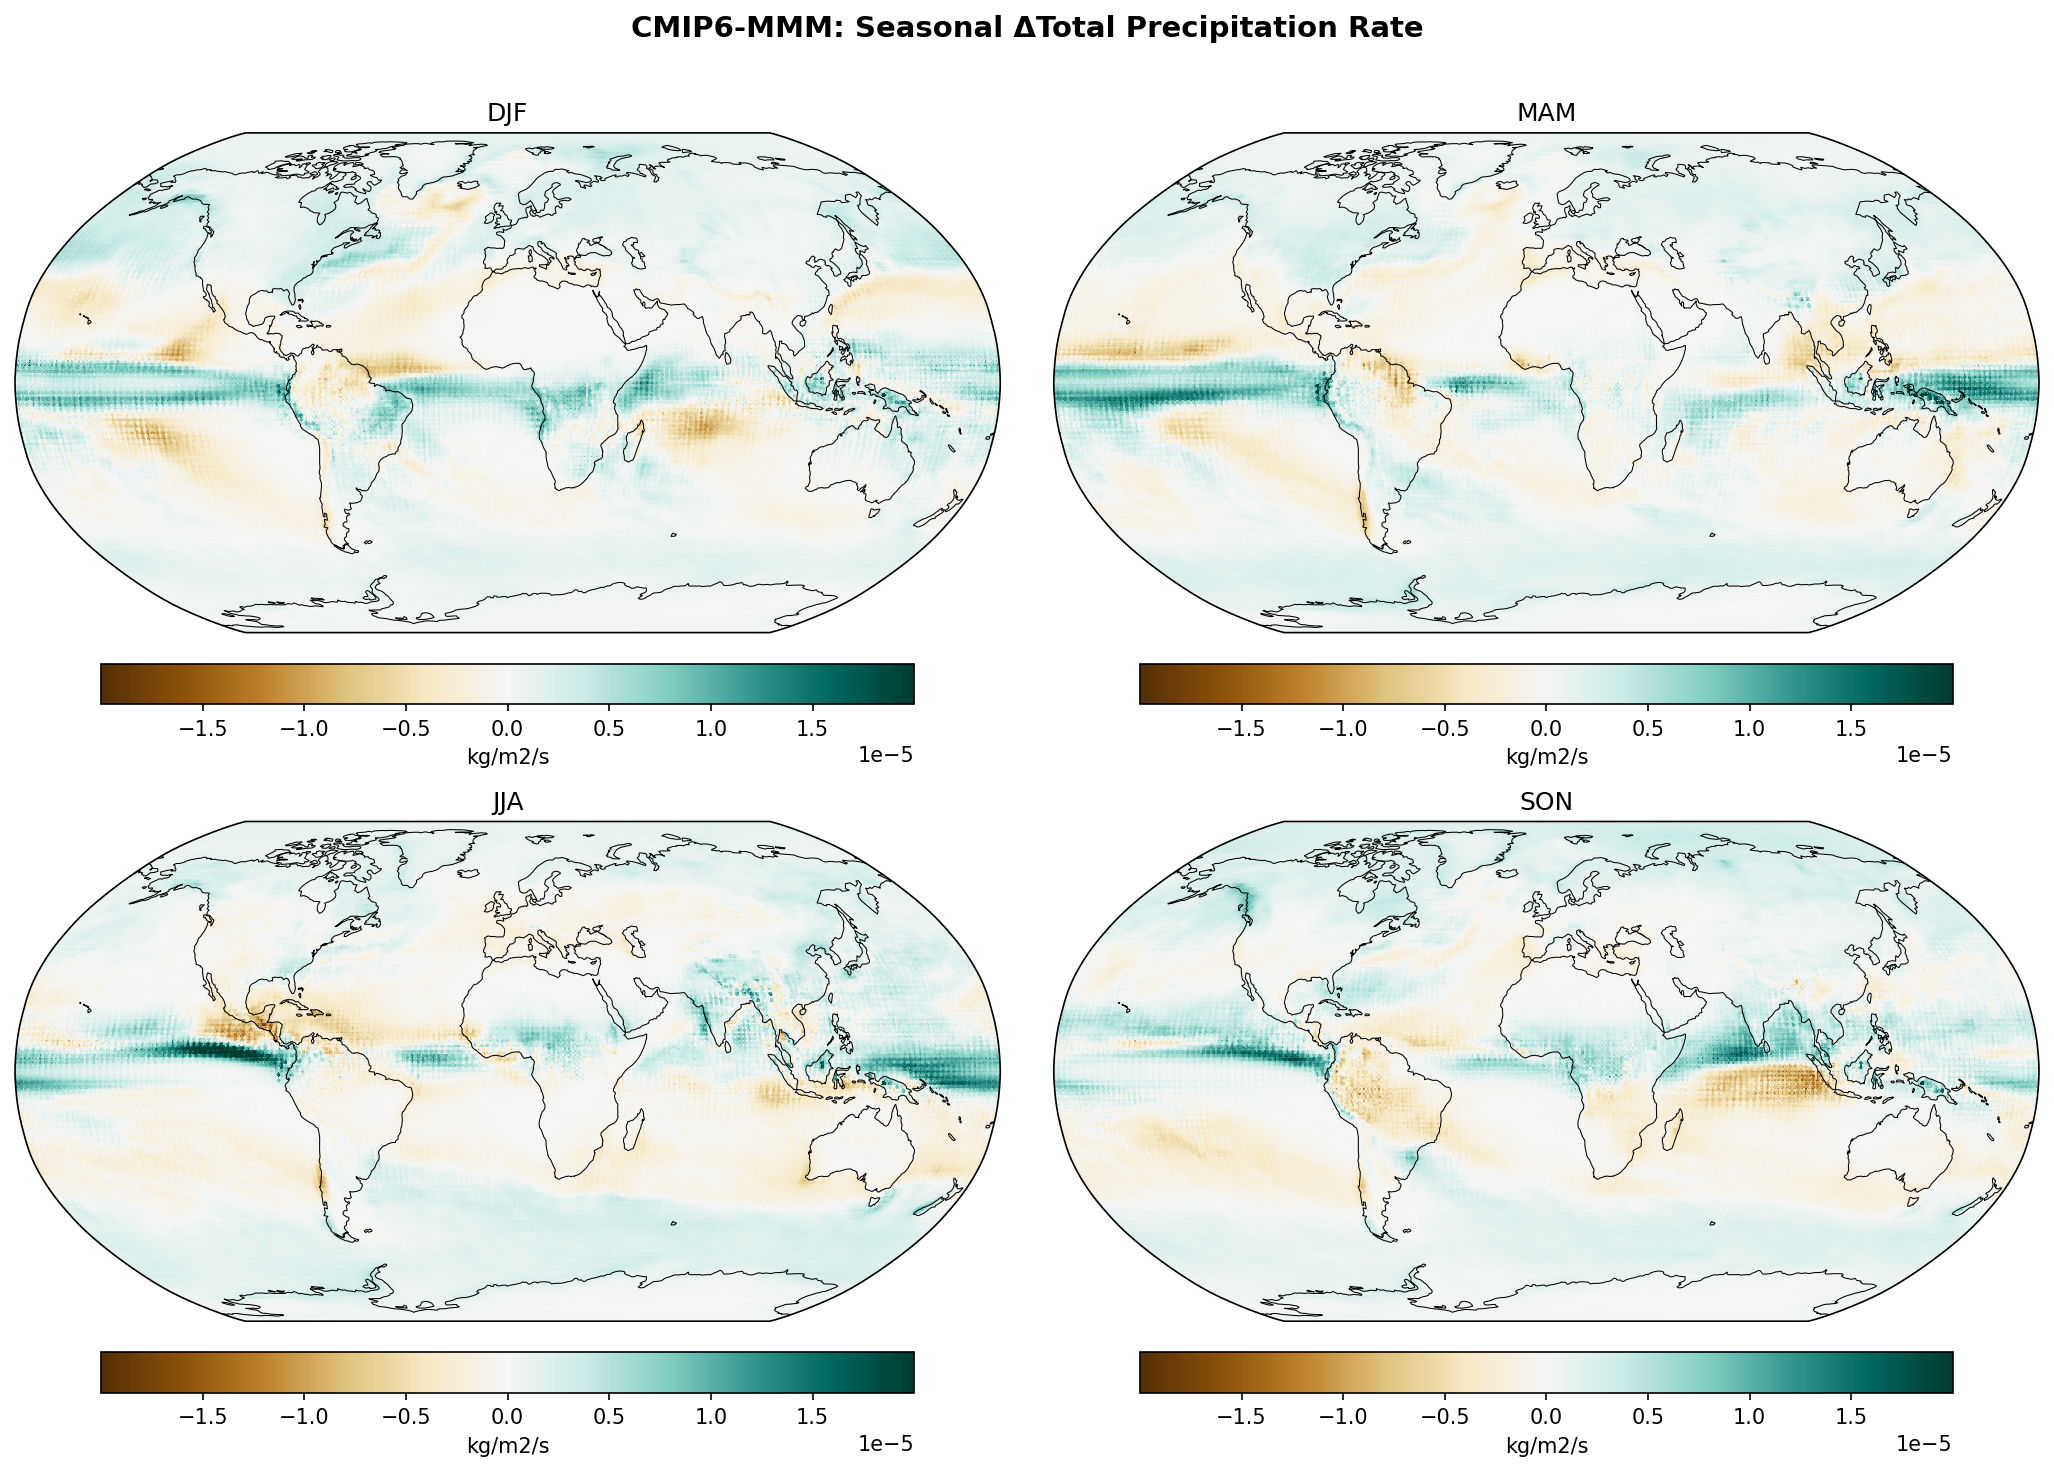
Seasonal Total Precipitation Rate Change — CMIP6-MMM
| Variables | avg_tprate |
|---|---|
| Models | CMIP6-MMM |
| Units | kg/m2/s |
| Baseline | 1990-2014 |
| Future | 2040-2049 |
| Method | Per-season future mean minus historical mean. Shared colorbar across all models. |
Summary high
This figure displays the projected seasonal changes in total precipitation rate for the CMIP6 Multi-Model Mean (MMM) under SSP3-7.0 (2040–2049 vs. 1990–2014), highlighting a global intensification of the hydrological cycle.
Key Findings
- A robust 'wet-gets-wetter' pattern is evident, with strong precipitation increases in the Intertropical Convergence Zone (ITCZ) and high latitudes across all seasons.
- Subtropical land regions, particularly the Mediterranean, Southern Africa, and parts of the Amazon, exhibit significant drying, especially in their respective dry or summer seasons.
- The Asian Summer Monsoon (JJA) shows a marked intensification (wetting), while the Amazon experiences drying during its dry season (JJA) extending into the onset of the wet season (SON).
Spatial Patterns
The Pacific ITCZ shows a distinct, narrow band of wetting that migrates seasonally. In JJA, the Northern Hemisphere continents show contrasting signals: strong wetting over South/East Asia and strong drying over Southern Europe and the Mediterranean. The Amazon basin shows a prominent drying signal in JJA and SON. High latitudes (Arctic and Southern Ocean) consistently show wetting. Subtropical ocean gyres generally exhibit drying or minimal change.
Model Agreement
As this panel shows the Multi-Model Mean (MMM) of ~50 CMIP6 models, the patterns represent the consensus forced response, smoothing out internal variability and model disagreement. The distinct zonal structures suggest high agreement on the large-scale thermodynamic drivers, though individual model spread (not shown) is typically higher in convective regimes like the Amazon or Sahel.
Physical Interpretation
The patterns are primarily driven by thermodynamic intensification (Clausius-Clapeyron relationship), where a warmer atmosphere holds more moisture, increasing moisture flux convergence in already wet regions (ITCZ, monsoons, storm tracks) and enhancing evaporation/divergence in dry regions (subtropics). The poleward expansion of the Hadley Cell contributes to the subtropical drying trends (e.g., Mediterranean, Southern Australia).
Caveats
- The MMM obscures inter-model spread; regions with high uncertainty (e.g., the Sahel or dynamic circulation shifts) appear smoothed.
- The analysis period (2040–2049) represents a mid-century transitional state; magnitudes will likely increase by 2100 under SSP3-7.0.
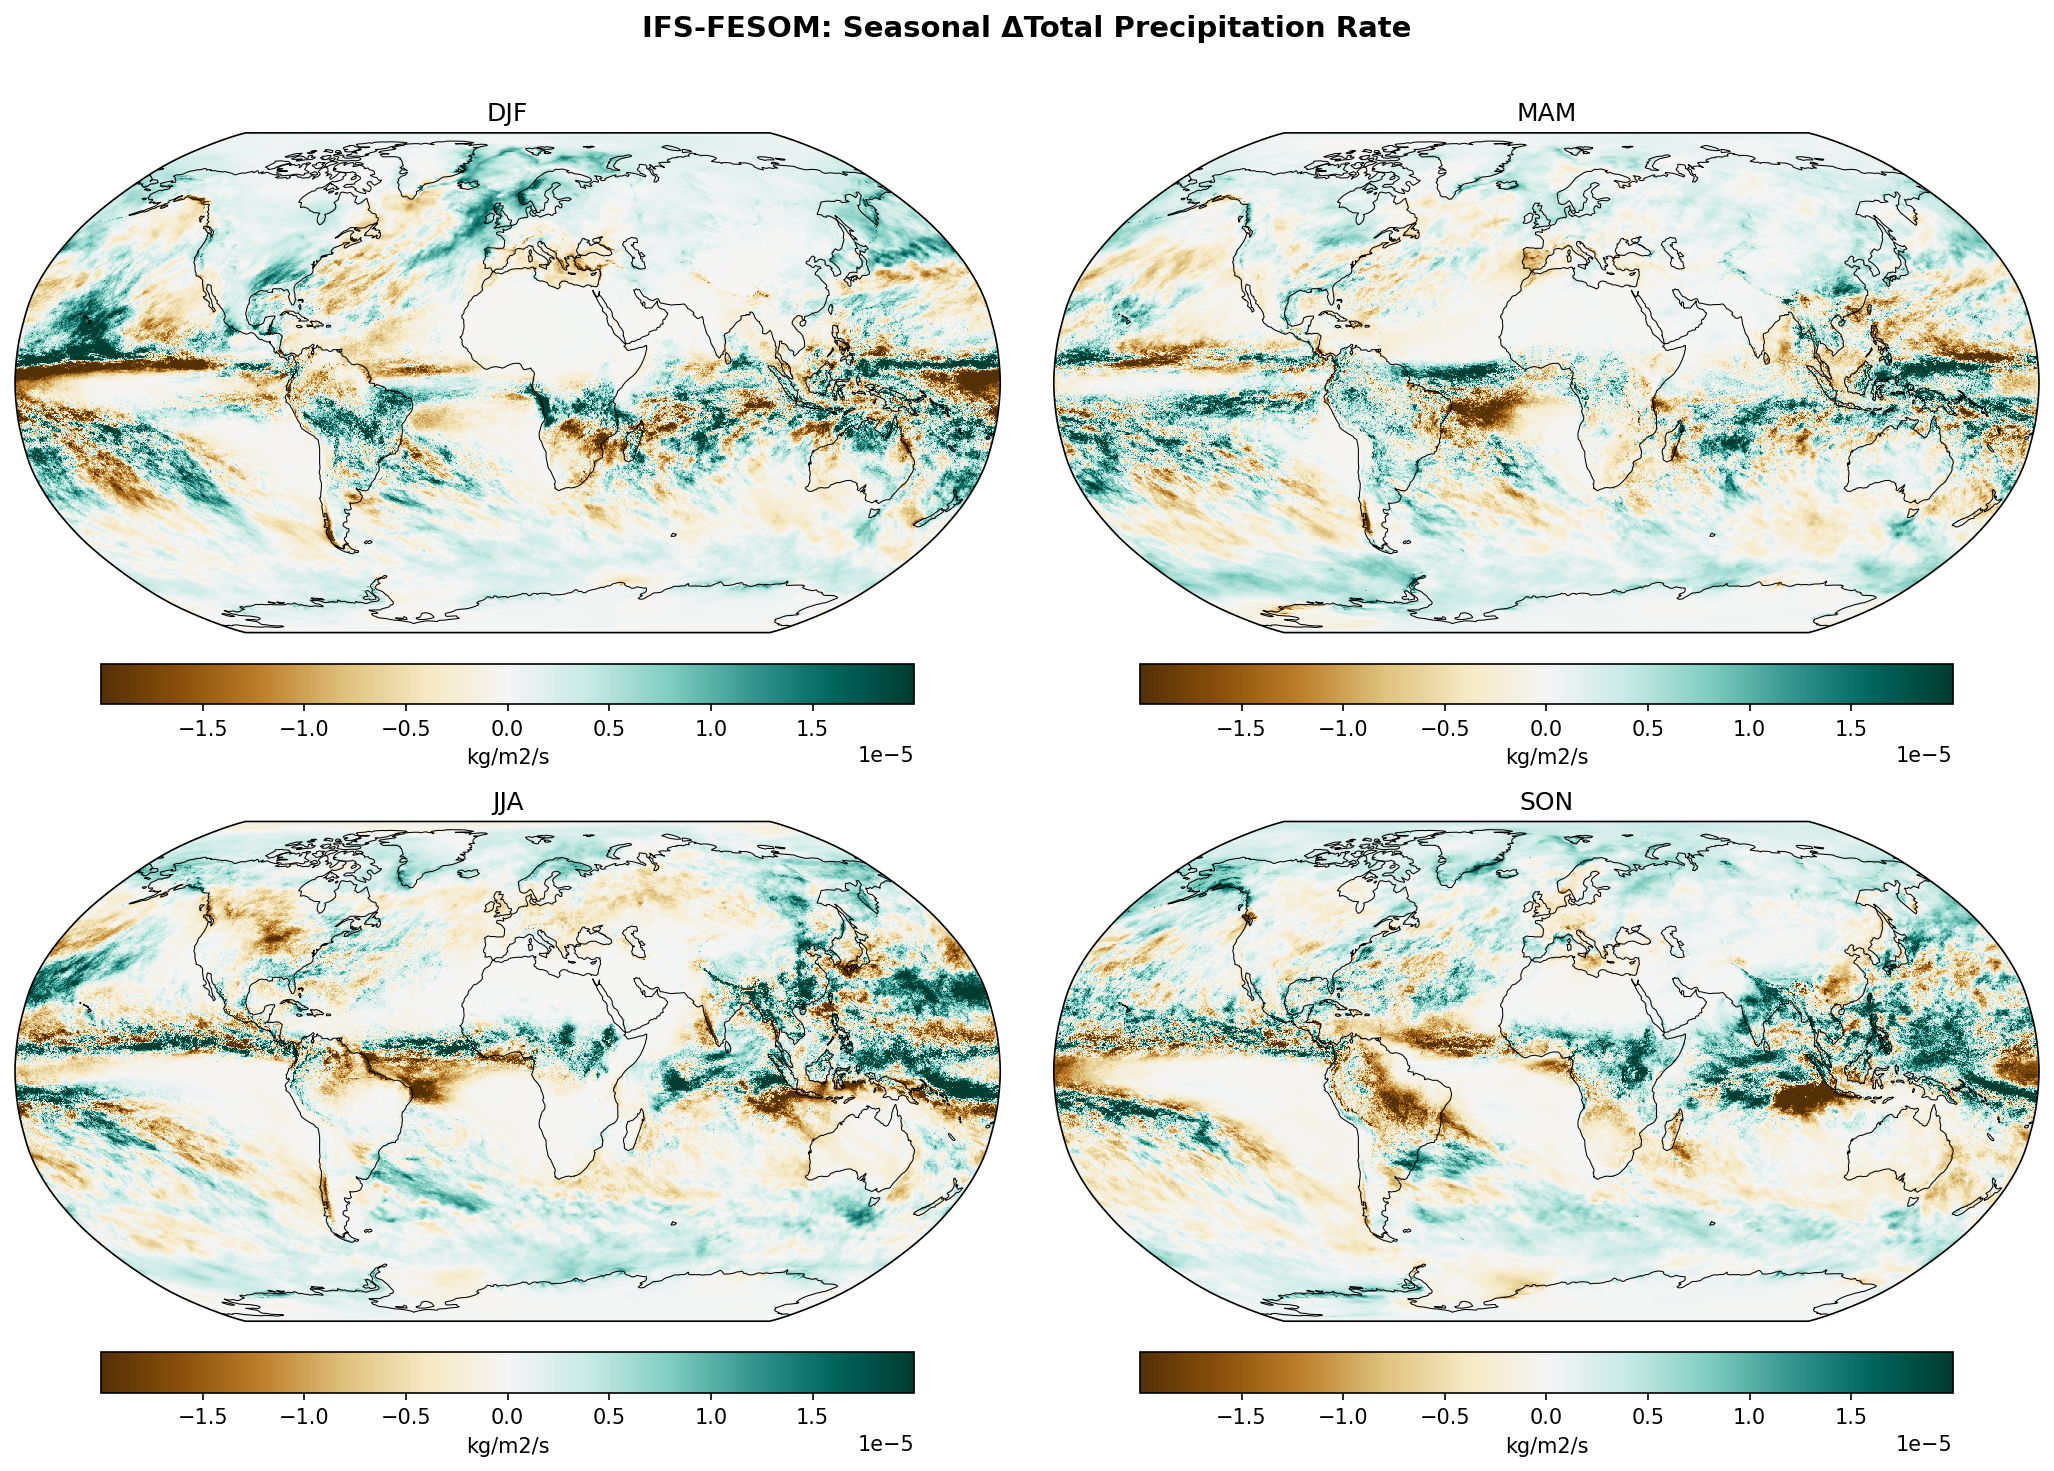
Seasonal Total Precipitation Rate Change — IFS-FESOM
| Variables | avg_tprate |
|---|---|
| Models | ifs-fesom |
| Units | kg/m2/s |
| Baseline | 1990-2014 |
| Future | 2040-2049 |
| Method | Per-season future mean minus historical mean. Shared colorbar across all models. |
Summary medium
IFS-FESOM projects seasonal precipitation changes (2040–2049 vs 1990–2014) characterized by robust thermodynamic wetting in high latitudes, intensified drying over the Amazon and Mediterranean, and sharp, high-resolution shifts in tropical convergence zones.
Key Findings
- Pronounced drying over the Amazon basin is evident across all seasons, intensifying notably in JJA and SON, suggesting a severe amplification of the dry season.
- High-latitude regions (Arctic and Southern Ocean) show consistent wetting (teal) in all seasons, aligning with thermodynamic expectations.
- The Intertropical Convergence Zone (ITCZ) exhibits sharp zonal dipole patterns (adjacent wetting and drying bands) in the Pacific and Atlantic, indicating meridional shifts or narrowing of rain belts rather than broad uniform changes.
- Monsoon signals include intensification of precipitation over the Indian subcontinent and Southeast Asia in JJA, and a distinct wetting band across the African Sahel in JJA contrasted by drying along the Guinean coast.
Spatial Patterns
The figure reveals highly resolved spatial structures, particularly in the tropics where narrow bands of precipitation change (dipoles) trace the ITCZ and SPCZ. Orographic influences are visible, such as enhanced wetting/drying gradients over the Andes and Himalayas. The Mediterranean region shows drying, most prominent in JJA and SON, while the North Atlantic storm track region generally shows wetting, especially in DJF.
Model Agreement
The broad patterns—high-latitude wetting, Mediterranean/Amazon drying, and monsoon intensification—are consistent with the CMIP6 ensemble consensus. However, IFS-FESOM displays much sharper gradients in the tropics and more localized orographic features (e.g., complex signals over the Maritime Continent) than typical coarse-resolution CMIP6 models.
Physical Interpretation
The high-latitude wetting is driven by the Clausius-Clapeyron response (warm air holding more moisture). Subtropical drying (Mediterranean, Southern Africa, Chile) is consistent with the poleward expansion of the Hadley cells and storm tracks. The sharp tropical dipoles likely reflect dynamic shifts in the ITCZ position and the 'deep-convection squeezing' effect often seen in high-resolution simulations.
Caveats
- The future analysis period (2040–2049) is only 10 years, which is short for precipitation climatology; internal decadal variability could significantly modulate the anthropogenic signal.
- The drying signal in the Amazon is particularly strong; while physically plausible, it requires validation against vegetation-feedback sensitivities in the model.
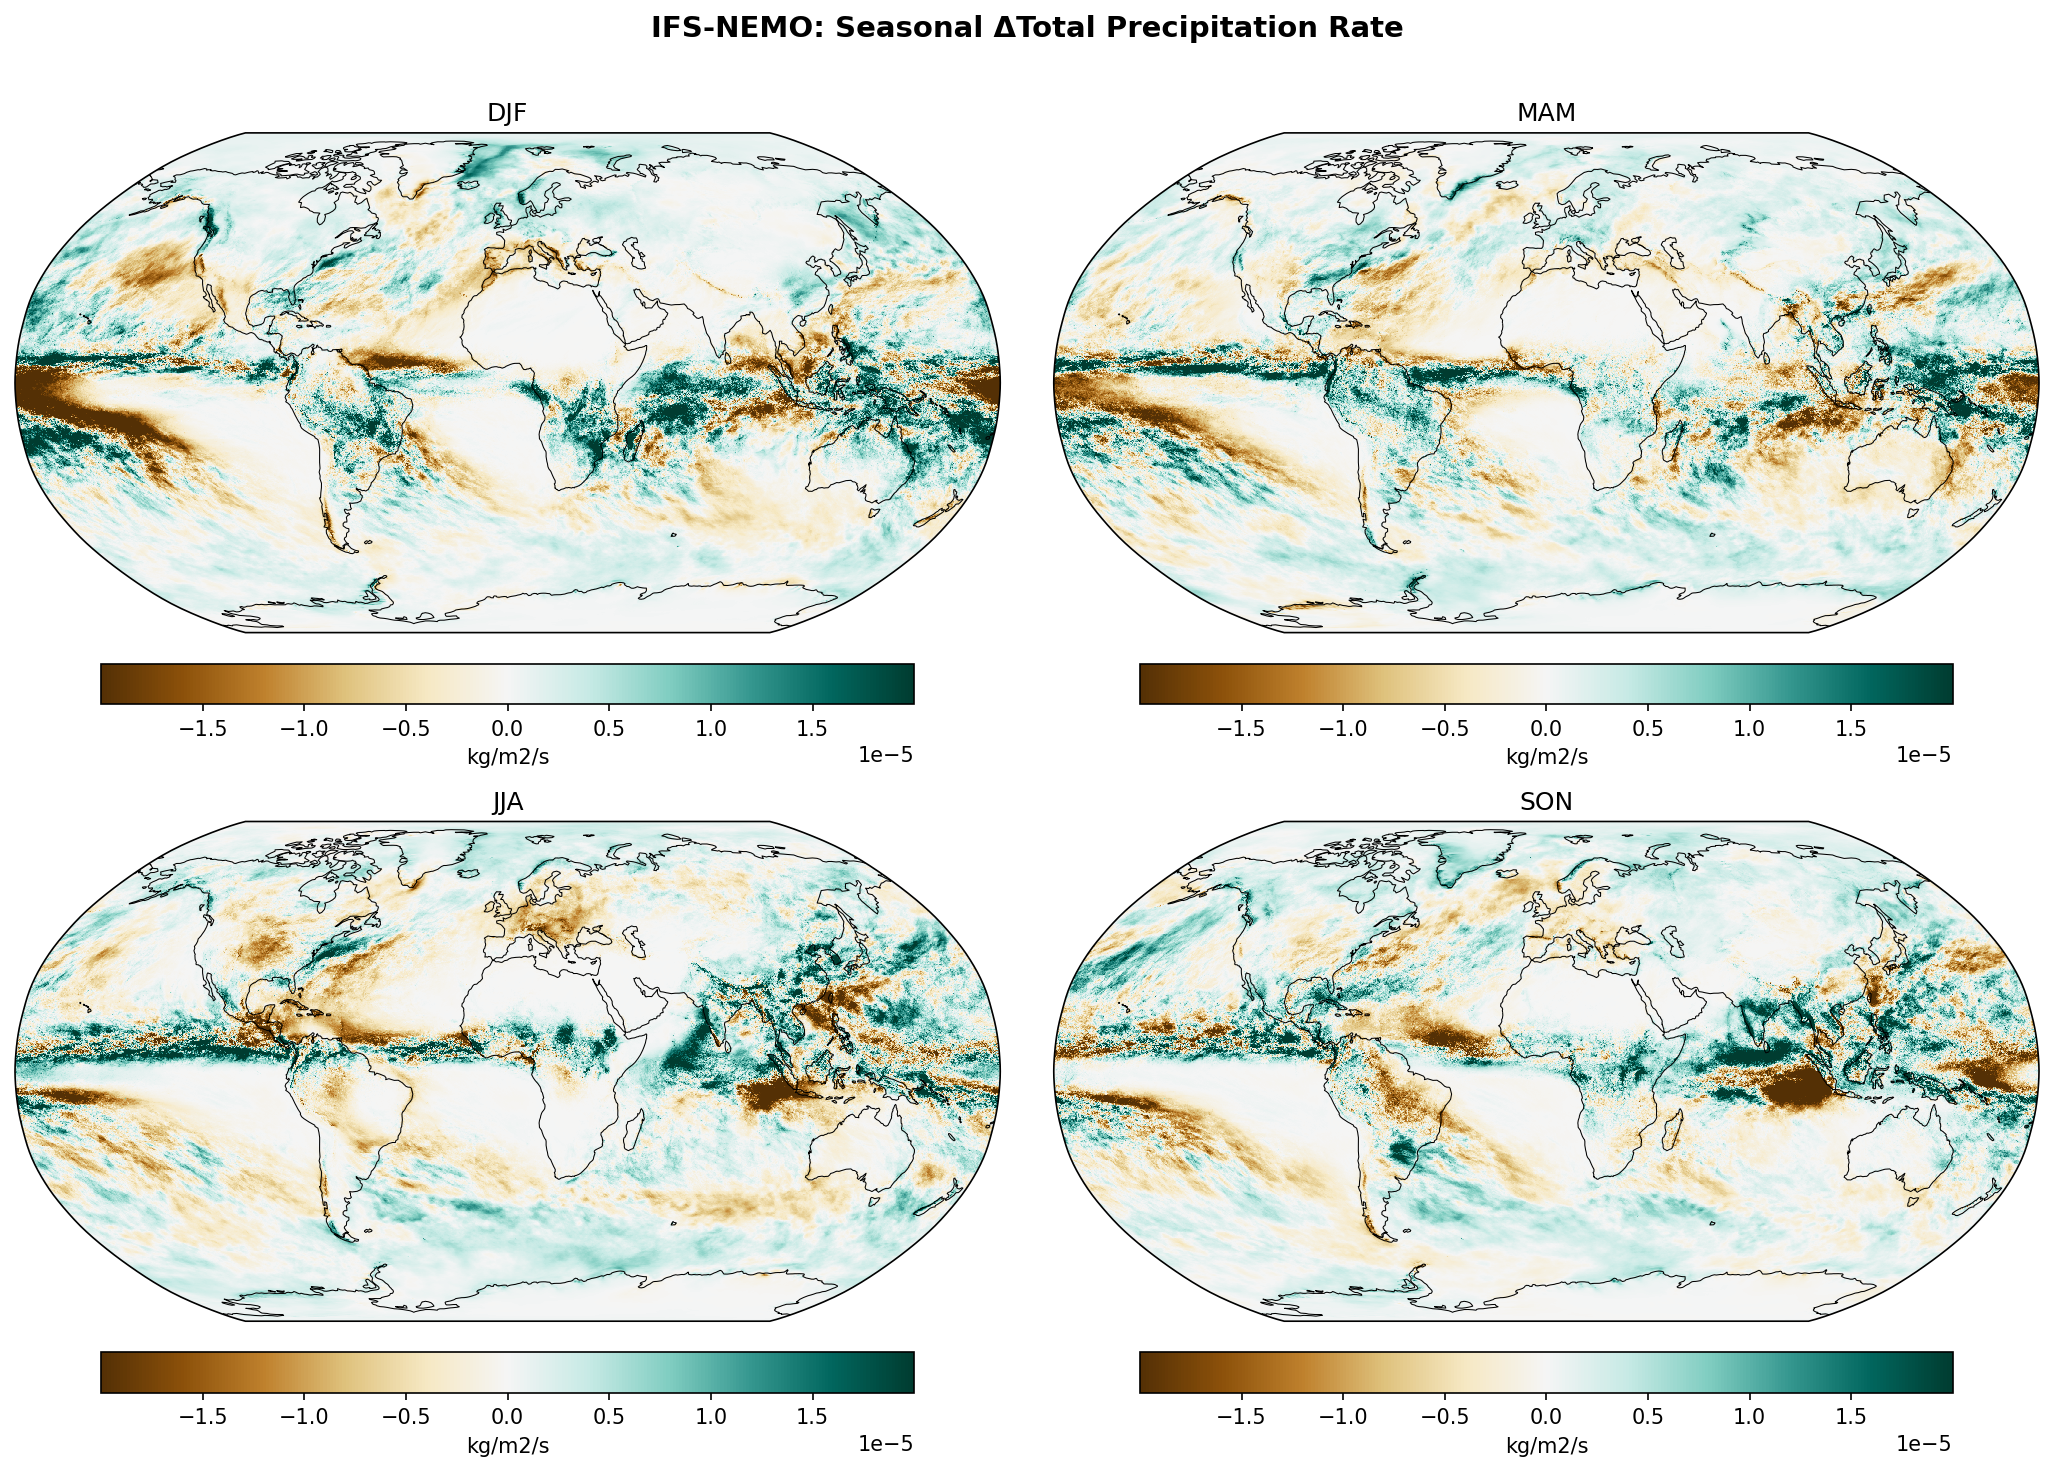
Seasonal Total Precipitation Rate Change — IFS-NEMO
| Variables | avg_tprate |
|---|---|
| Models | ifs-nemo |
| Units | kg/m2/s |
| Baseline | 1990-2014 |
| Future | 2040-2049 |
| Method | Per-season future mean minus historical mean. Shared colorbar across all models. |
Summary medium
IFS-NEMO projects seasonal precipitation changes (2040–2049 vs 1990–2014) characterised by intensified Asian monsoons, high-latitude wetting, and subtropical drying, overlaid with sharp, fine-scale tropical rain belt shifts.
Key Findings
- Intensification of the Asian Summer Monsoon (JJA) with substantial precipitation increases over India, the Bay of Bengal, and Southeast Asia.
- Pronounced drying over the Mediterranean and Southern Europe, particularly evident in summer (JJA) and winter (DJF), consistent with Hadley cell expansion.
- Sharp, high-magnitude zonal dipoles in the tropical Pacific (especially DJF/MAM) indicating distinct ITCZ shifts, likely conflated with internal variability.
Spatial Patterns
The high resolution resolves very narrow precipitation bands in the tropics (e.g., ITCZ/SPCZ) that are often smeared in coarser models. Distinct orographic effects are visible, such as enhanced drying/wetting contrasts along the Andes and Himalayas. A strong ENSO-like dipole structure appears in the tropical Pacific (wetting north of equator, drying south in DJF).
Model Agreement
Broad large-scale patterns (Arctic wetting, Mediterranean drying, Monsoon intensification) align with the CMIP6 consensus. However, the spatial granularity in the tropics and the specific phasing of the Pacific anomalies differ from the smooth CMIP6 multi-model mean, likely due to the model's eddy-resolving nature and the specific decadal variability sampled.
Physical Interpretation
The patterns reflect a combination of thermodynamic intensification ('wet-get-wetter') and dynamical shifts. High-latitude and monsoon wetting are driven by increased moisture transport (Clausius-Clapeyron). Subtropical drying results from the poleward expansion of the circulation. The sharp tropical features highlight the model's explicit resolution of convective organization and ocean-atmosphere coupling.
Caveats
- The future period (2040–2049) is only 10 years long. Precipitation is highly variable, and the strong ENSO-like patterns in the Pacific likely reflect internal decadal variability rather than a pure forced climate response.
- No statistical significance masking is applied, so smaller anomalies in high-variability regions should be interpreted with caution.
Seasonal 2m Temperature Change — IFS-FESOM (DJF) f_out 18.3%
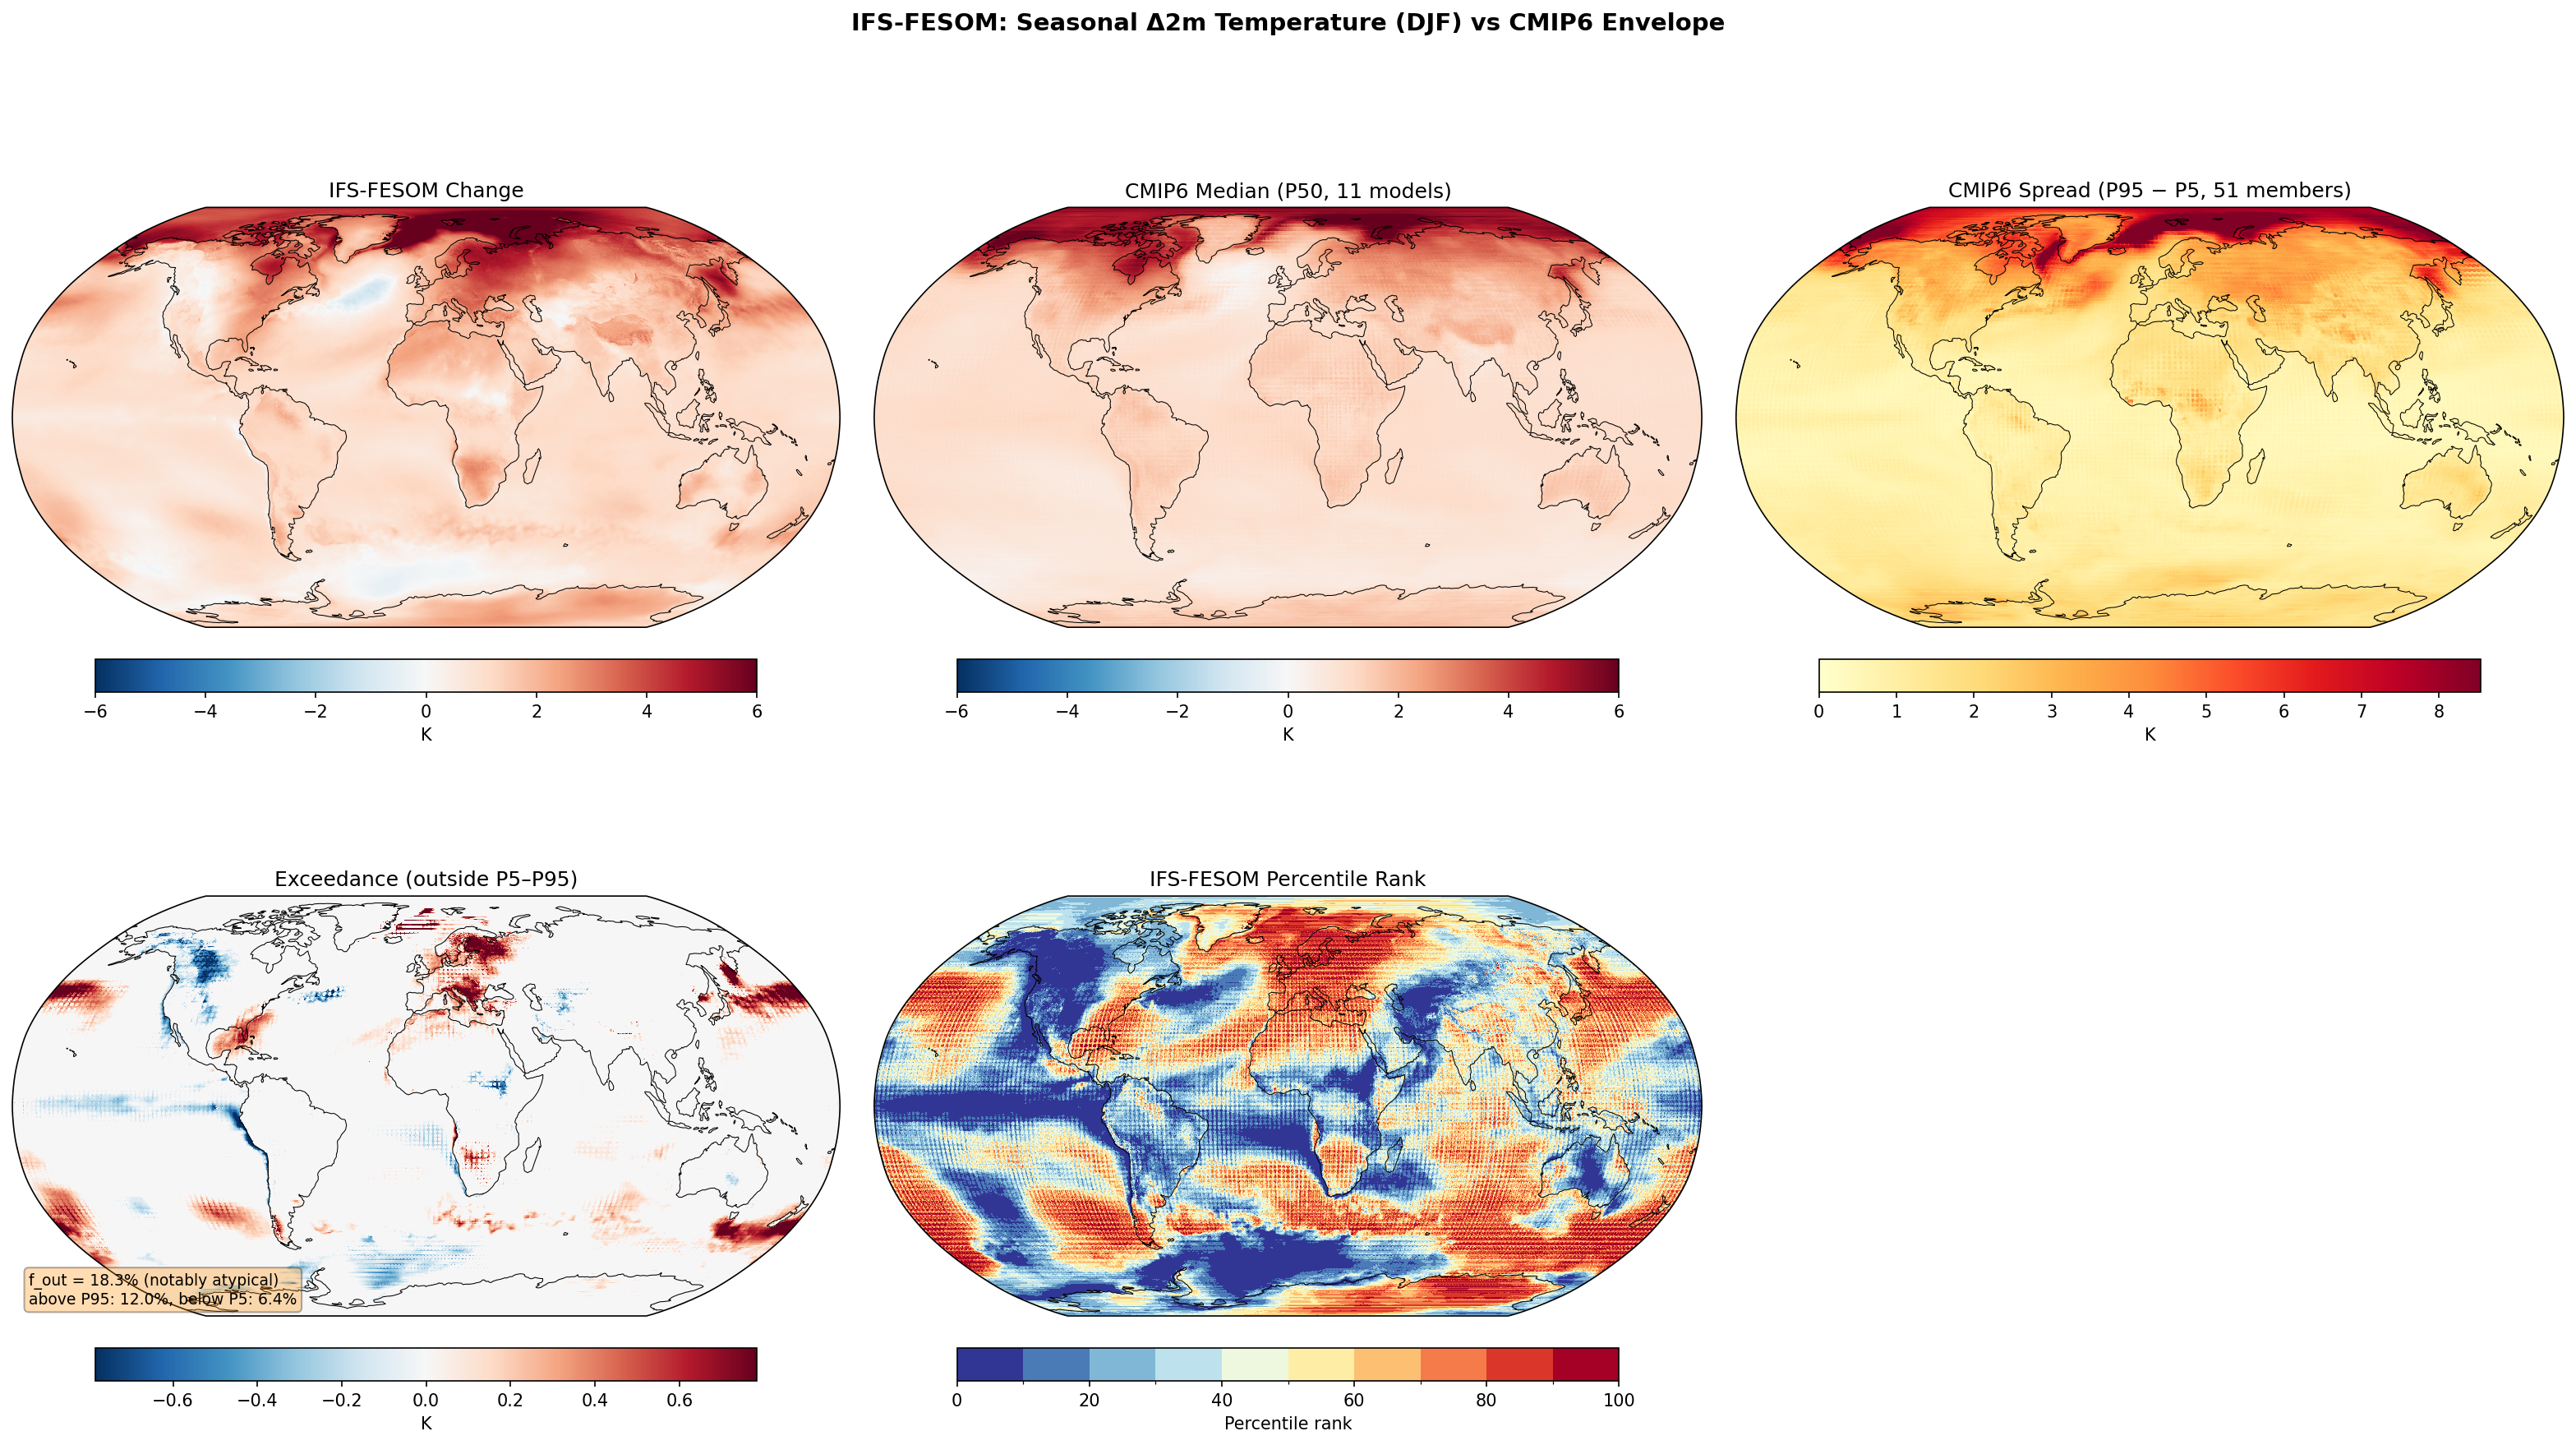
Envelope Metrics
| f_out (outside P5–P95) | 18.3% notably atypical |
|---|---|
| Above P95 | 12.0% |
| Below P5 | 6.4% |
| CMIP6 ensemble | 11 models, 51 members |
| Variables | avg_2t |
|---|---|
| Models | ifs-fesom |
| Units | K |
| Baseline | 1990-2014 |
| Future | 2040-2049 |
| Method | Per-season future mean minus historical mean. Compared to CMIP6 percentile envelope (P5, P50, P95). |
Summary high
IFS-FESOM exhibits a notably atypical DJF temperature response (f_out = 18.3%) compared to the CMIP6 ensemble, characterized by a significantly stronger warming signal over Europe and a deeper cooling anomaly in the North Atlantic.
Key Findings
- The model shows enhanced winter warming over Europe, Central Asia, and parts of North America, exceeding the CMIP6 95th percentile (P95).
- A pronounced 'warming hole' (absolute cooling) is evident in the North Atlantic, falling below the CMIP6 5th percentile (P5), suggesting a distinct ocean dynamical response.
- Warming in the Southern Ocean and parts of the tropical oceans is suppressed relative to the CMIP6 median, often falling into the lower percentile ranks (<20).
Spatial Patterns
The projection is dominated by strong Arctic Amplification, contrasting with a stark North Atlantic cooling patch. While the CMIP6 median shows a muted version of this North Atlantic feature, IFS-FESOM intensifies it significantly. Over land, particularly Europe, the warming gradient is sharper and higher in magnitude than the ensemble median.
Model Agreement
IFS-FESOM diverges notably from CMIP6 in key dynamical regions. While it captures the broad pattern of land-sea warming contrast and polar amplification, it sits at the extreme tails of the distribution for the North Atlantic (cooler) and Europe (warmer). The total fraction outside the envelope (18.3%) classifies the response as notably atypical.
Physical Interpretation
The deep North Atlantic cooling likely indicates a robust slowdown of the Atlantic Meridional Overturning Circulation (AMOC) or differences in subpolar gyre dynamics resolved at higher resolution. The juxtaposition of a cold North Atlantic with a very warm Europe suggests strong atmospheric compensation, possibly via altered jet stream dynamics or increased advection of warm air from lower latitudes, overriding the local maritime cooling influence. The suppressed Southern Ocean warming is characteristic of high-resolution ocean models with eddy-resolving/permitting capabilities, which often exhibit different vertical heat uptake efficiencies.
Caveats
- The extreme cooling in the North Atlantic requires investigation to distinguish between a forced climate response (AMOC slowdown) and potential model drift or initialization shock.
- The 10-year future period (2040-2049) is relatively short, meaning internal decadal variability could amplify the discrepancy with the CMIP6 ensemble mean.
Seasonal 2m Temperature Change — IFS-FESOM (JJA) f_out 14.4%
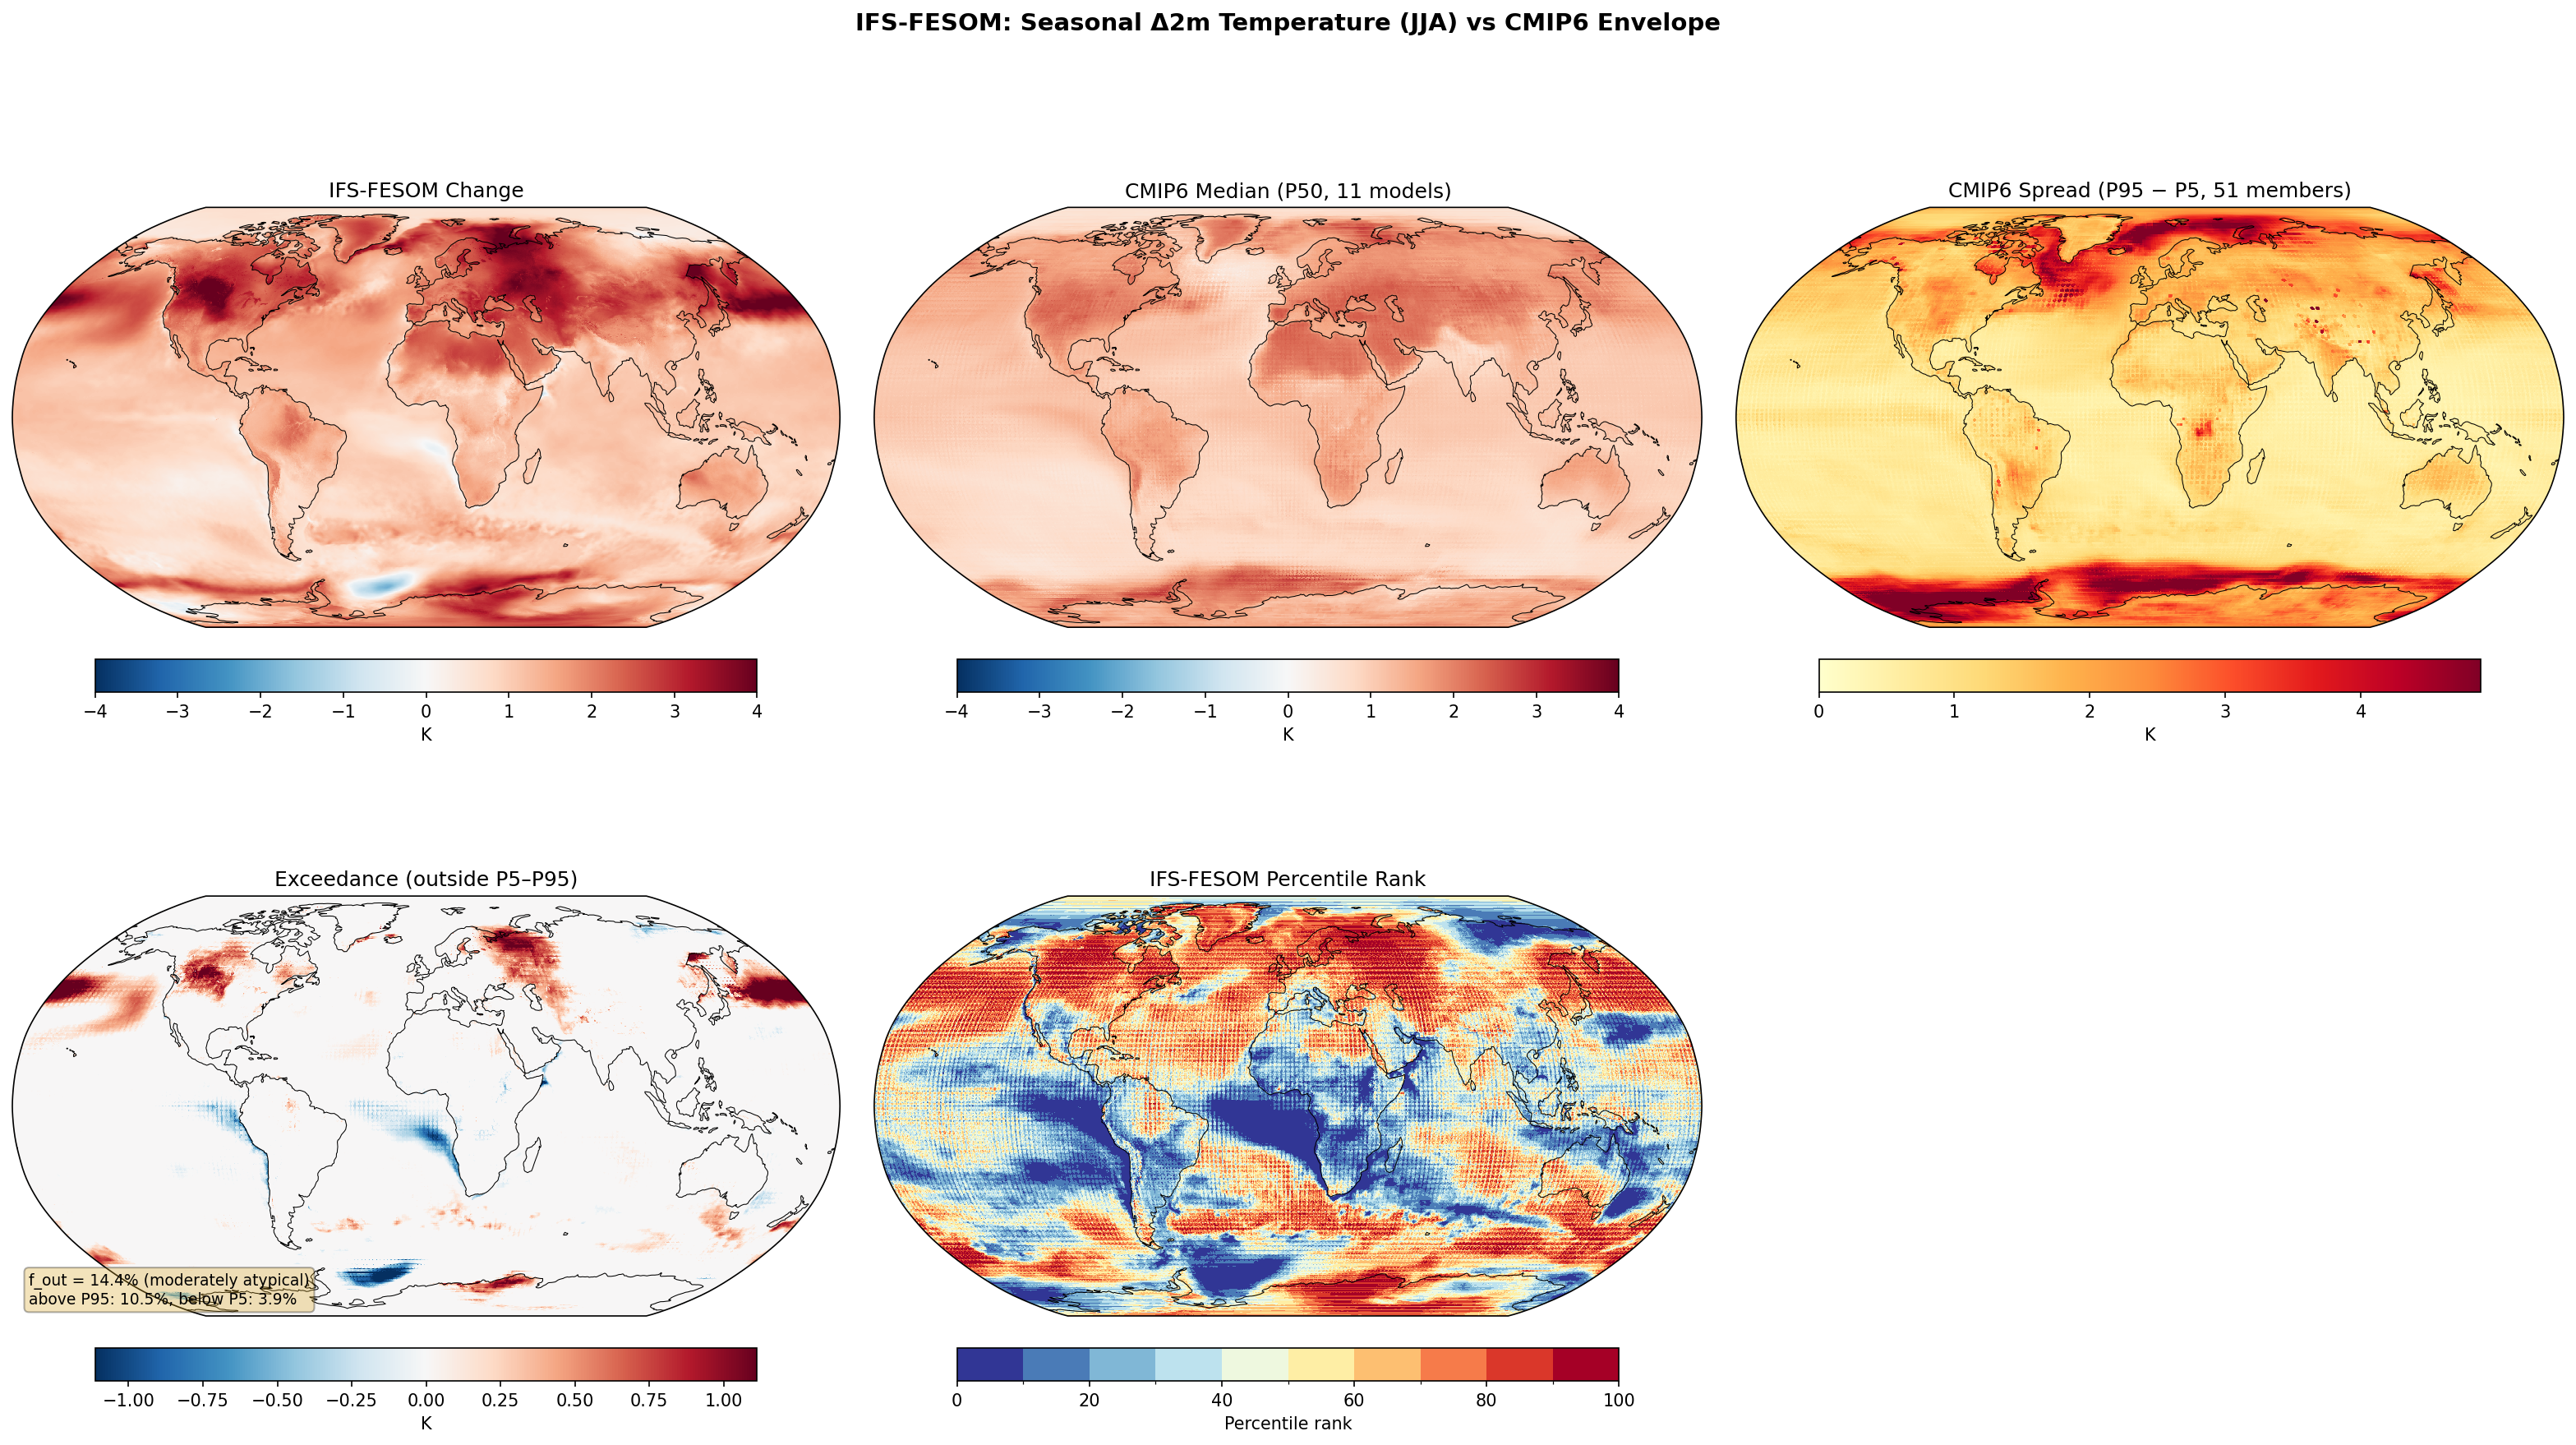
Envelope Metrics
| f_out (outside P5–P95) | 14.4% moderately atypical |
|---|---|
| Above P95 | 10.5% |
| Below P5 | 3.9% |
| CMIP6 ensemble | 11 models, 51 members |
| Variables | avg_2t |
|---|---|
| Models | ifs-fesom |
| Units | K |
| Baseline | 1990-2014 |
| Future | 2040-2049 |
| Method | Per-season future mean minus historical mean. Compared to CMIP6 percentile envelope (P5, P50, P95). |
Summary high
IFS-FESOM exhibits a widespread JJA warming pattern with a 'moderately atypical' deviation (14.4% of area) from the CMIP6 ensemble, characterised by enhanced warming in the North Pacific and Arctic, contrasted by distinct cooling signals in the Weddell Sea.
Key Findings
- IFS-FESOM exceeds the CMIP6 P95 warming threshold significantly in the North Pacific, Barents/Kara Seas, and parts of North America.
- The model falls below the CMIP6 P5 threshold (showing cooling or weak warming) in the Weddell Sea and the North Atlantic 'warming hole' region.
- Northern Hemisphere land warming is generally robust, mostly sitting in the upper quartiles (percentile rank > 50) of the CMIP6 distribution.
- Southern Hemisphere winter (JJA) sea ice dynamics likely drive the divergence in the Southern Ocean.
Spatial Patterns
The figure shows pronounced Arctic amplification and strong land-sea warming contrast typical of future projections. A notable large-scale feature is the intense warming 'blob' in the North Pacific (red in exceedance map) and the sharp cooling signal in the Weddell Sea (blue in exceedance map). The North Atlantic displays a complex pattern with excessive warming in the Nordic Seas and excessive cooling (relative to CMIP6) south of Greenland.
Model Agreement
IFS-FESOM agrees with the broad CMIP6 ensemble on the pattern of warming over Northern Hemisphere continents. Disagreement is concentrated in ocean basins where dynamic processes (e.g., boundary currents, deep water formation, sea ice fronts) dominate, specifically the North Pacific, North Atlantic subpolar gyre, and Weddell Sea.
Physical Interpretation
The exceedance in the North Pacific may stem from internal variability (e.g., a specific PDO phase in this realisation) or cloud feedback differences. The cooling in the Weddell Sea (during SH winter) suggests IFS-FESOM maintains or grows sea ice more robustly than the CMIP6 lower bound, potentially due to the unstructured grid better resolving shelf processes or polynyas. The deepened North Atlantic warming hole suggests a strong AMOC slowdown response or specific subpolar gyre dynamics.
Caveats
- The analysis is based on a single 10-year realization of IFS-FESOM; decadal internal variability (e.g., ENSO, NAO) can strongly influence regional comparisons against a multi-model ensemble.
- CMIP6 spread is relatively large in the polar regions, yet IFS-FESOM still falls outside this envelope, indicating distinct polar physics.
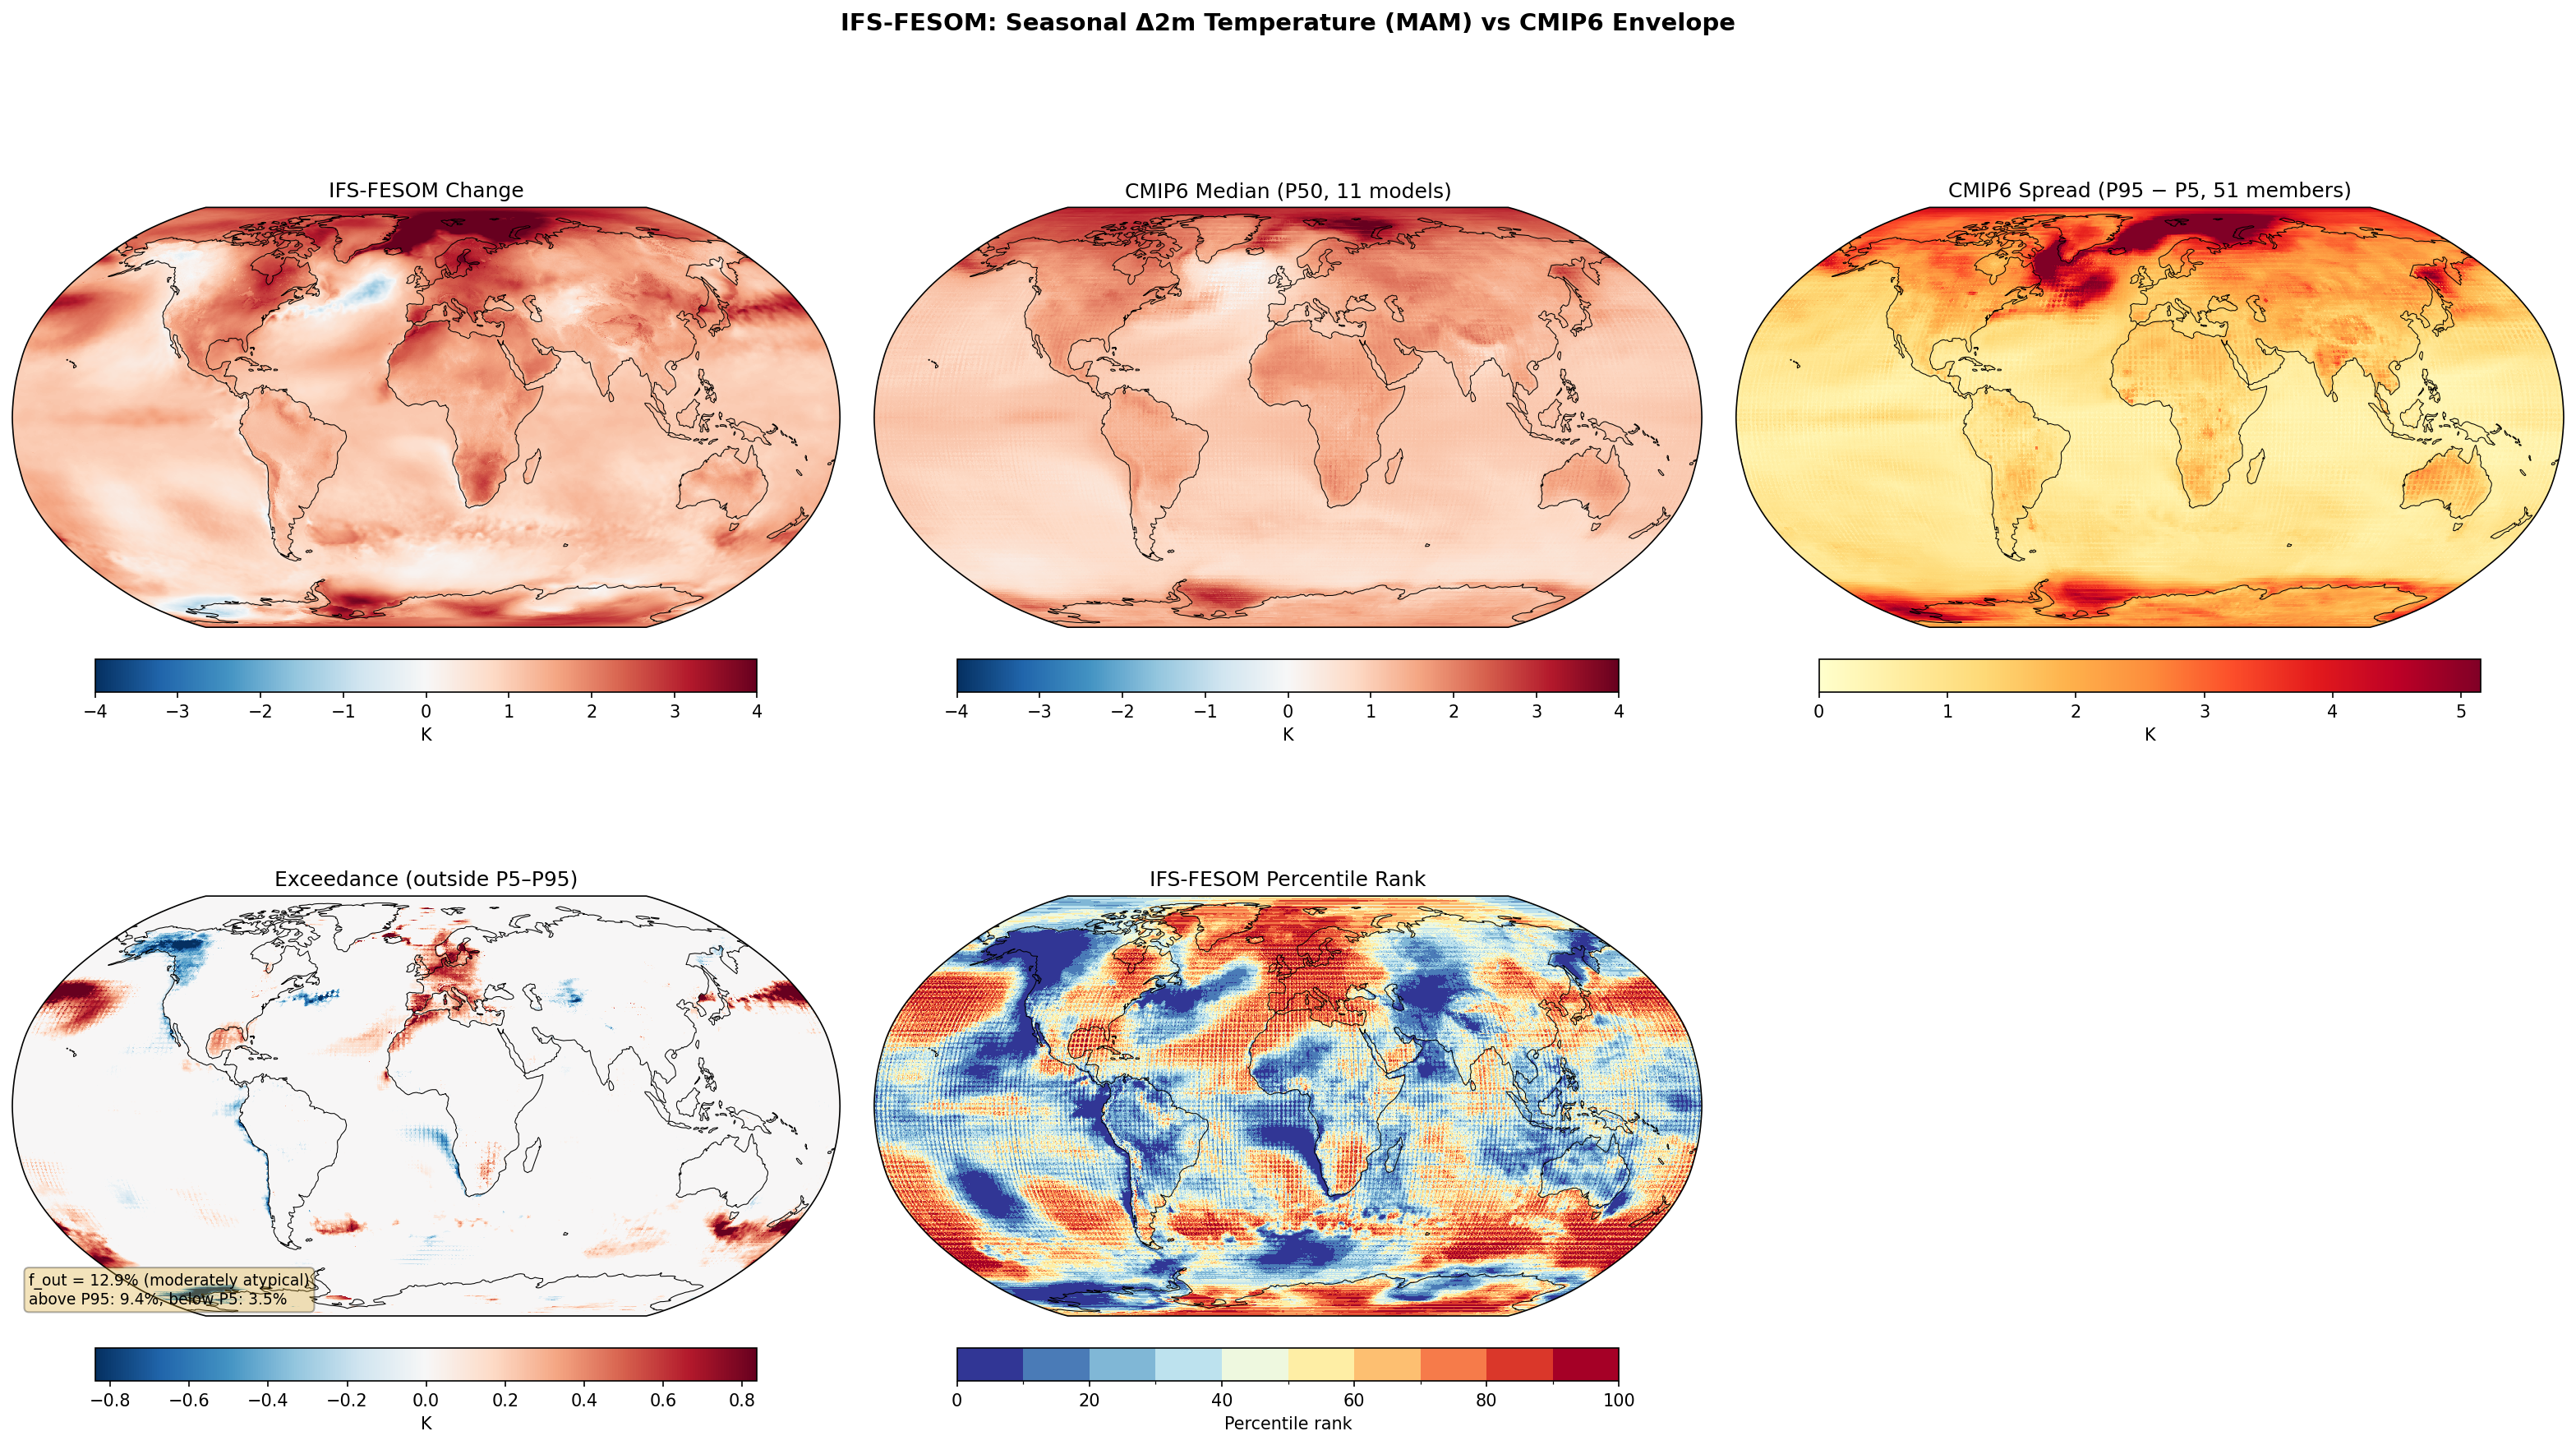
Seasonal 2m Temperature Change — IFS-FESOM (MAM) f_out 12.9%
Envelope Metrics
| f_out (outside P5–P95) | 12.9% moderately atypical |
|---|---|
| Above P95 | 9.4% |
| Below P5 | 3.5% |
| CMIP6 ensemble | 11 models, 51 members |
| Variables | avg_2t |
|---|---|
| Models | ifs-fesom |
| Units | K |
| Baseline | 1990-2014 |
| Future | 2040-2049 |
| Method | Per-season future mean minus historical mean. Compared to CMIP6 percentile envelope (P5, P50, P95). |
Summary high
IFS-FESOM projects a distinctive dipole pattern in the North Atlantic/European sector during MAM (2040–2049), featuring a deep North Atlantic 'warming hole' below the CMIP6 range alongside European warming exceeding the CMIP6 upper bound.
Key Findings
- The model exhibits a pronounced cooling signal (warming hole) in the North Atlantic subpolar gyre, falling below the CMIP6 5th percentile.
- Conversely, Western and Central Europe show intense warming that exceeds the CMIP6 95th percentile, creating a sharp spatial contrast with the adjacent ocean.
- Arctic amplification is strong, with warming in the Barents/Kara Sea region exceeding the CMIP6 envelope.
- The area-weighted fraction of grid points outside the CMIP6 envelope (f_out) is 12.9%, categorising the simulation as 'moderately atypical'.
Spatial Patterns
The dominant feature is the North Atlantic-European dipole: a strong blue exceedance (cooler than P5) in the North Atlantic juxtaposed with a red exceedance (warmer than P95) over Europe. Secondary patterns include anomalous warming in the North Pacific and parts of the Southern Ocean, while the tropical bands largely remain within the CMIP6 spread.
Model Agreement
IFS-FESOM diverges significantly from the CMIP6 ensemble in the North Atlantic, where the ensemble median shows warming but IFS-FESOM shows cooling/no change. It agrees with the ensemble on the general sign of land warming but simulates a much stronger amplitude over Europe and parts of the Arctic.
Physical Interpretation
The deep North Atlantic Warming Hole suggests a robust AMOC slowdown or changes in deep convection (Labrador/Nordic Seas), processes often more sensitive in eddy-permitting ocean models (FESOM) than in standard CMIP6 resolutions. The excessive European warming may be linked to atmospheric blocking induced by the Atlantic SST anomaly or stronger land-surface feedbacks (e.g., spring snow melt/soil moisture depletion) specific to the high-resolution land surface scheme.
Caveats
- The 10-year analysis period (2040–2049) allows internal decadal variability to influence regional patterns; the strong North Atlantic signal could be amplified by a specific phase of variability.
- Differences in sea-ice initialization or sensitivity in the high-res model may contribute to the Arctic exceedance.
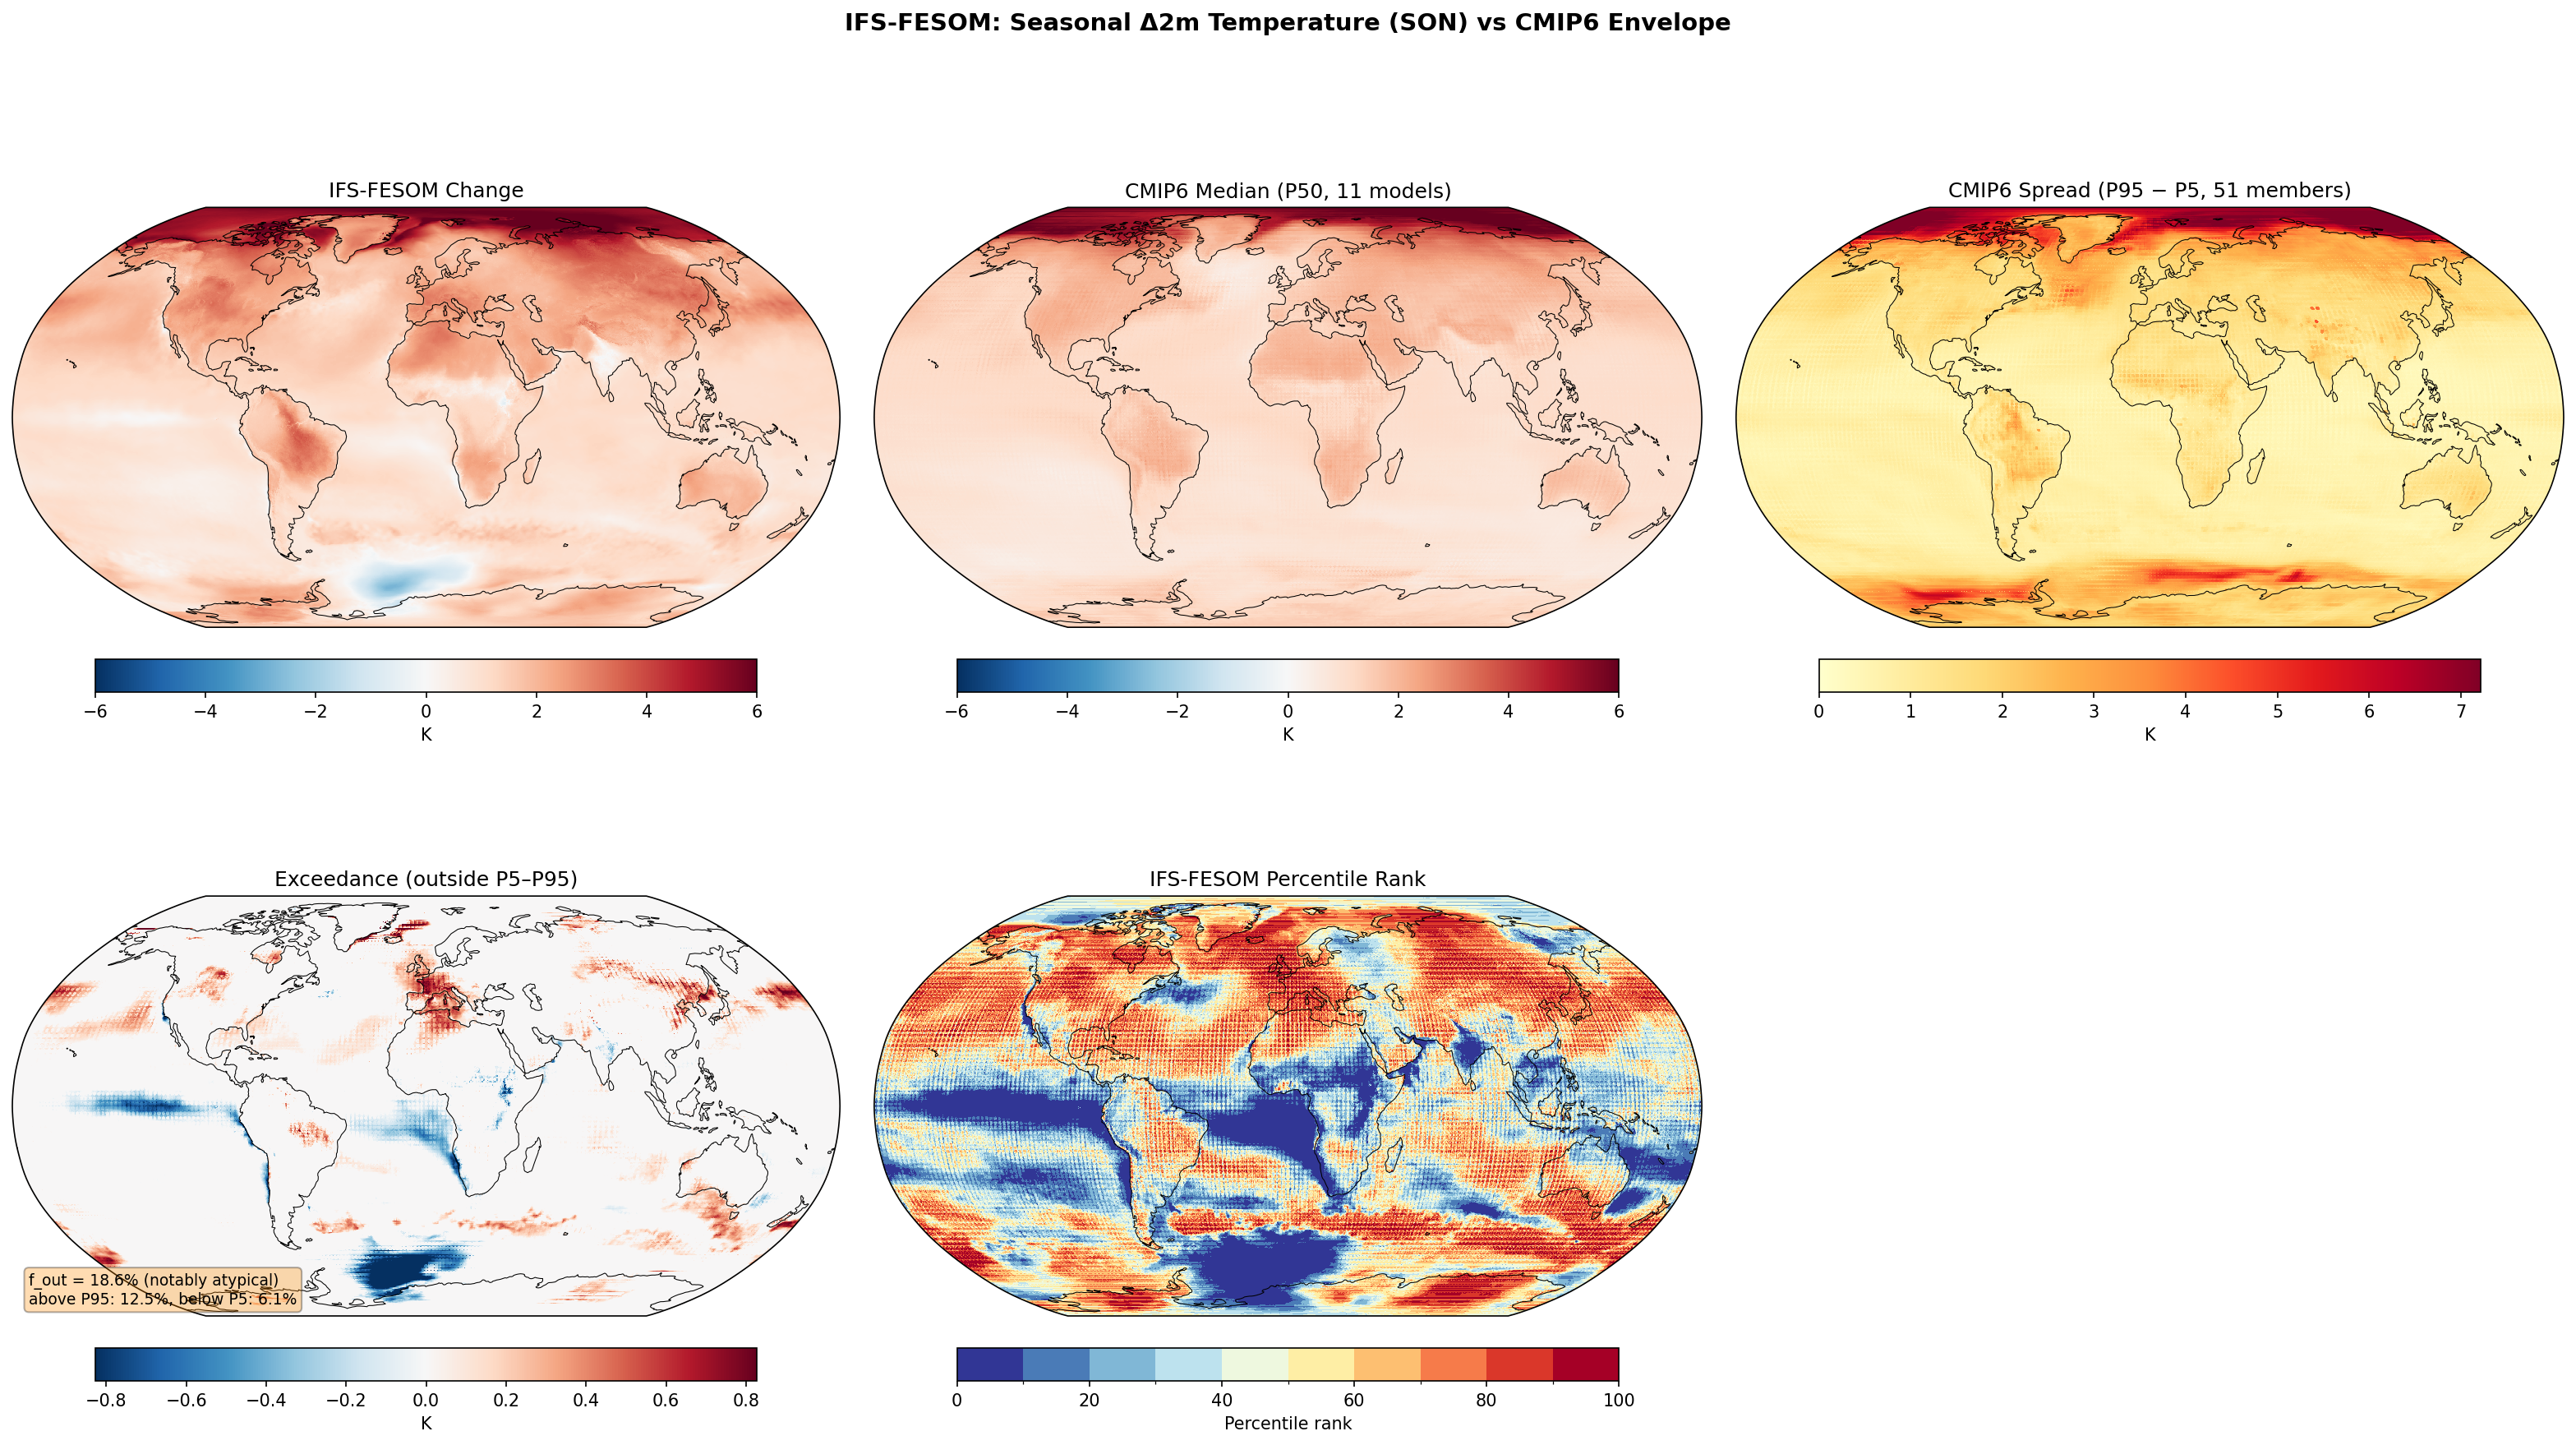
Seasonal 2m Temperature Change — IFS-FESOM (SON) f_out 18.6%
Envelope Metrics
| f_out (outside P5–P95) | 18.6% notably atypical |
|---|---|
| Above P95 | 12.5% |
| Below P5 | 6.1% |
| CMIP6 ensemble | 11 models, 51 members |
| Variables | avg_2t |
|---|---|
| Models | ifs-fesom |
| Units | K |
| Baseline | 1990-2014 |
| Future | 2040-2049 |
| Method | Per-season future mean minus historical mean. Compared to CMIP6 percentile envelope (P5, P50, P95). |
Summary high
In the SON season, IFS-FESOM exhibits a notably atypical response (f_out = 18.6%) characterized by significantly stronger warming over Europe and parts of the North Atlantic compared to the CMIP6 envelope, contrasted with distinct cooling signals in the Southern Ocean.
Key Findings
- IFS-FESOM projects intense warming over Europe and the Mediterranean in autumn, exceeding the CMIP6 95th percentile.
- A localized cooling signal is observed in the Weddell Sea (Southern Ocean), falling below the CMIP6 5th percentile.
- Tropical ocean basins (Atlantic and Indian) generally show weaker warming than the CMIP6 median, often dipping below the 5th percentile.
- Arctic amplification is present and strong, generally tracking the upper end of the CMIP6 distribution.
Spatial Patterns
The spatial distribution of exceedance is structured: red clusters (exceeding P95) dominate Europe, Western Russia, and the high-latitude North Atlantic. Blue clusters (below P5) are prominent in the Weddell Sea and appear as zonal bands in the tropical Atlantic and Indian Oceans. The North Atlantic warming hole is visible in the change field but spatially complex in the exceedance plot.
Model Agreement
The model diverges notably from CMIP6 (18.6% outside envelope). It is 'hotter' over Northern Hemisphere mid-to-high latitude land masses and 'colder' (or warms less) in the Southern Ocean and tropical oceans. The disagreement in the Weddell Sea is particularly sharp, with IFS-FESOM showing absolute cooling where CMIP6 predicts warming.
Physical Interpretation
The extreme warming over Europe in autumn may result from soil moisture-temperature feedbacks (summer drying extending into autumn) or persistent high-pressure blocking patterns resolved differently in IFS. The Weddell Sea cooling likely reflects differences in mixed-layer depth and deep convection dynamics inherent to the FESOM unstructured grid, potentially maintaining sea ice cover or vertical mixing longer than coarser CMIP6 models. The lower tropical ocean warming suggests different cloud radiative feedbacks or a lower transient climate response in these regions compared to the CMIP6 ensemble mean.
Caveats
- The 10-year analysis period (2040-2049) makes the signal susceptible to decadal internal variability (e.g., AMV, IPO), which may amplify apparent differences from the CMIP6 ensemble mean.
- Regional cooling in the Southern Ocean is a physically robust feature in some high-res models but represents a strong deviation from the monotonic warming generally seen in CMIP6 means.
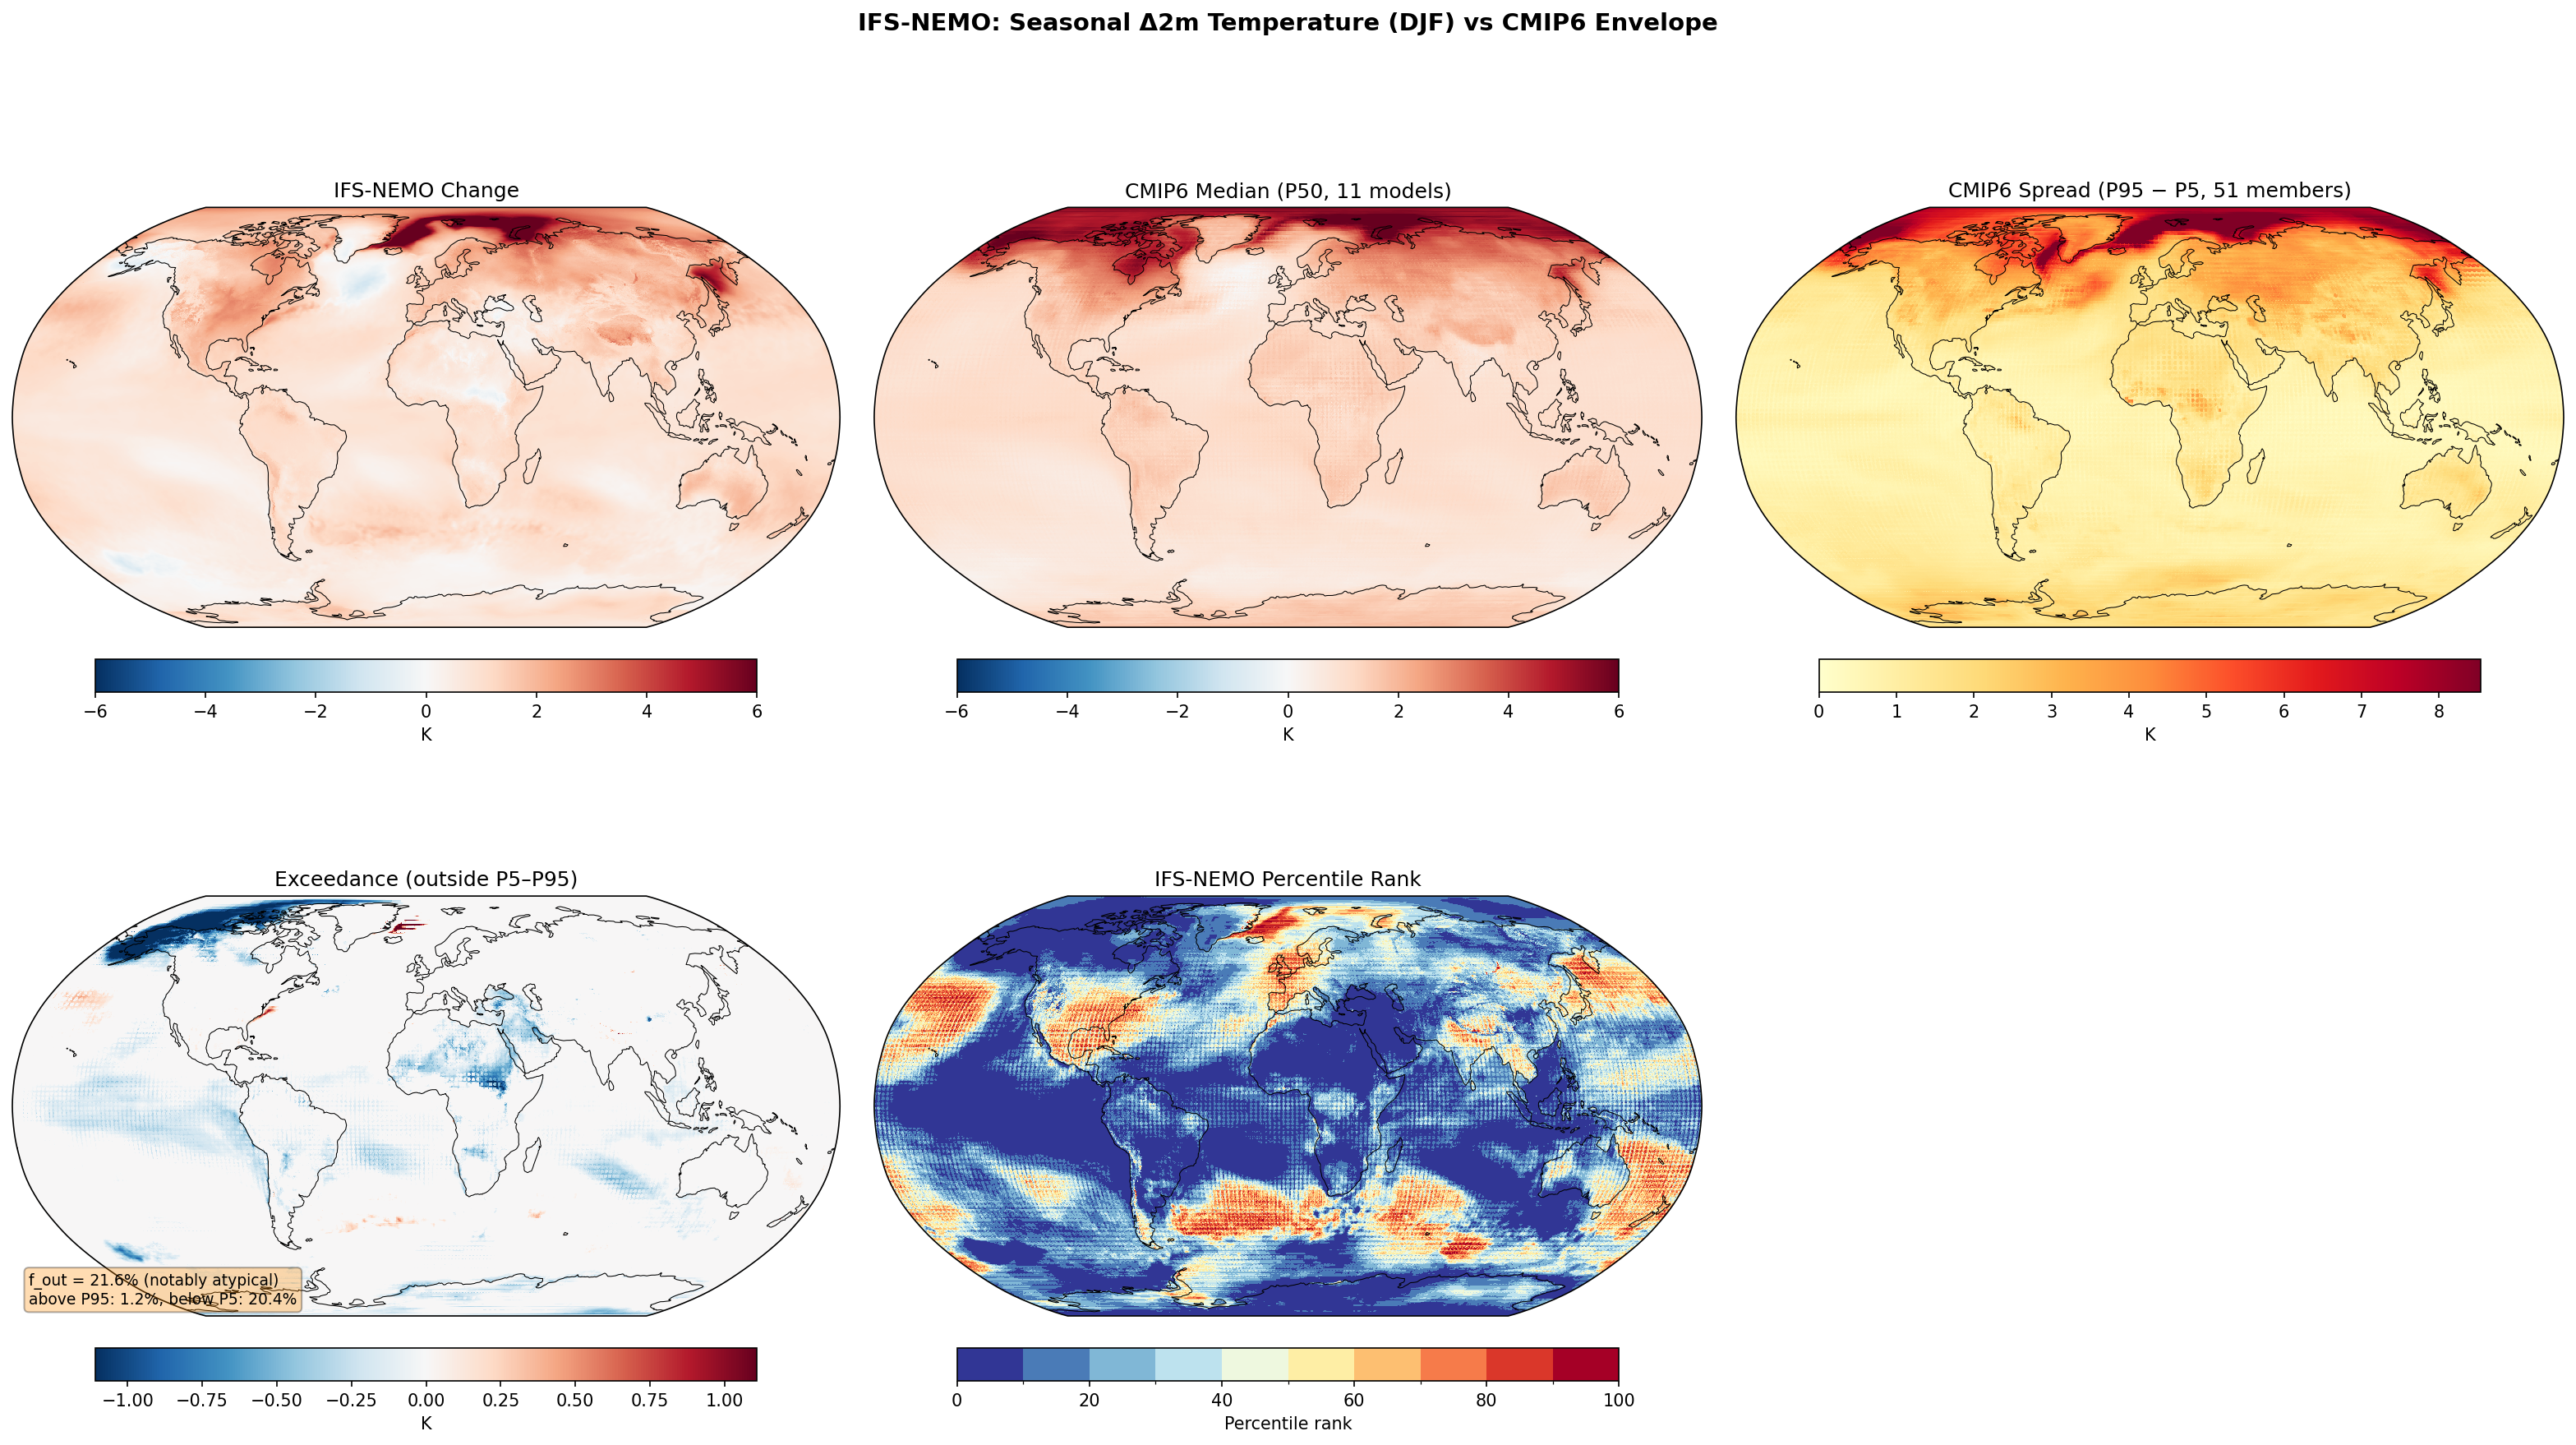
Seasonal 2m Temperature Change — IFS-NEMO (DJF) f_out 21.6%
Envelope Metrics
| f_out (outside P5–P95) | 21.6% notably atypical |
|---|---|
| Above P95 | 1.2% |
| Below P5 | 20.4% |
| CMIP6 ensemble | 11 models, 51 members |
| Variables | avg_2t |
|---|---|
| Models | ifs-nemo |
| Units | K |
| Baseline | 1990-2014 |
| Future | 2040-2049 |
| Method | Per-season future mean minus historical mean. Compared to CMIP6 percentile envelope (P5, P50, P95). |
Summary high
In the 2040–2049 DJF season, IFS-NEMO exhibits a significantly cooler response (weaker warming) than the CMIP6 ensemble, with 21.6% of the global area falling outside the P5–P95 envelope, almost entirely below the 5th percentile.
Key Findings
- IFS-NEMO is systematically cooler than the CMIP6 median, with 20.4% of the globe showing warming rates below the CMIP6 5th percentile (P5).
- A pronounced North Atlantic 'warming hole' (absolute cooling) is observed, significantly exceeding the CMIP6 variability range and extending its cooling influence over Europe and North Africa.
- The percentile rank map is dominated by values below 20, indicating the model consistently sits at the lower tail of the CMIP6 distribution for temperature change in this decade.
Spatial Patterns
The spatial pattern of 'exceedance' is overwhelmingly negative (blue). The most intense deviation is in the North Atlantic subpolar gyre, extending eastward into the Mediterranean and westward across parts of North America. Broad regions of the tropical oceans (Atlantic, Indian, and West Pacific) also show warming significantly below the CMIP6 P5 threshold. Areas of higher warming (above P95) are negligible (1.2%) and scattered.
Model Agreement
There is notable disagreement between IFS-NEMO and the CMIP6 ensemble. While CMIP6 predicts robust widespread warming (P50 panel), IFS-NEMO shows extensive areas of neutral change or cooling in the Northern Hemisphere mid-latitudes. The model aligns with CMIP6 only in showing Arctic amplification, though even there, the magnitude is often lower than the ensemble median.
Physical Interpretation
The strong North Atlantic cooling signal suggests a potential slowdown of the Atlantic Meridional Overturning Circulation (AMOC) or distinct subpolar gyre dynamics, which are often better resolved in eddy-rich models than in standard CMIP6 resolutions. The widespread cooler response globally suggests either a lower Transient Climate Response (TCR) in IFS-NEMO compared to the CMIP6 mean, or that strong internal variability (e.g., specific phases of decadal oscillation) in this single decade (2040s) is masking the forced warming trend.
Caveats
- The analysis is based on a single decade (2040–2049), where internal climate variability can strongly influence results compared to the smoothed CMIP6 ensemble mean.
- The pronounced cooling in the North Atlantic requires verification to distinguish between a physical dynamical response (AMOC slowdown) and potential model drift or initialization shock.
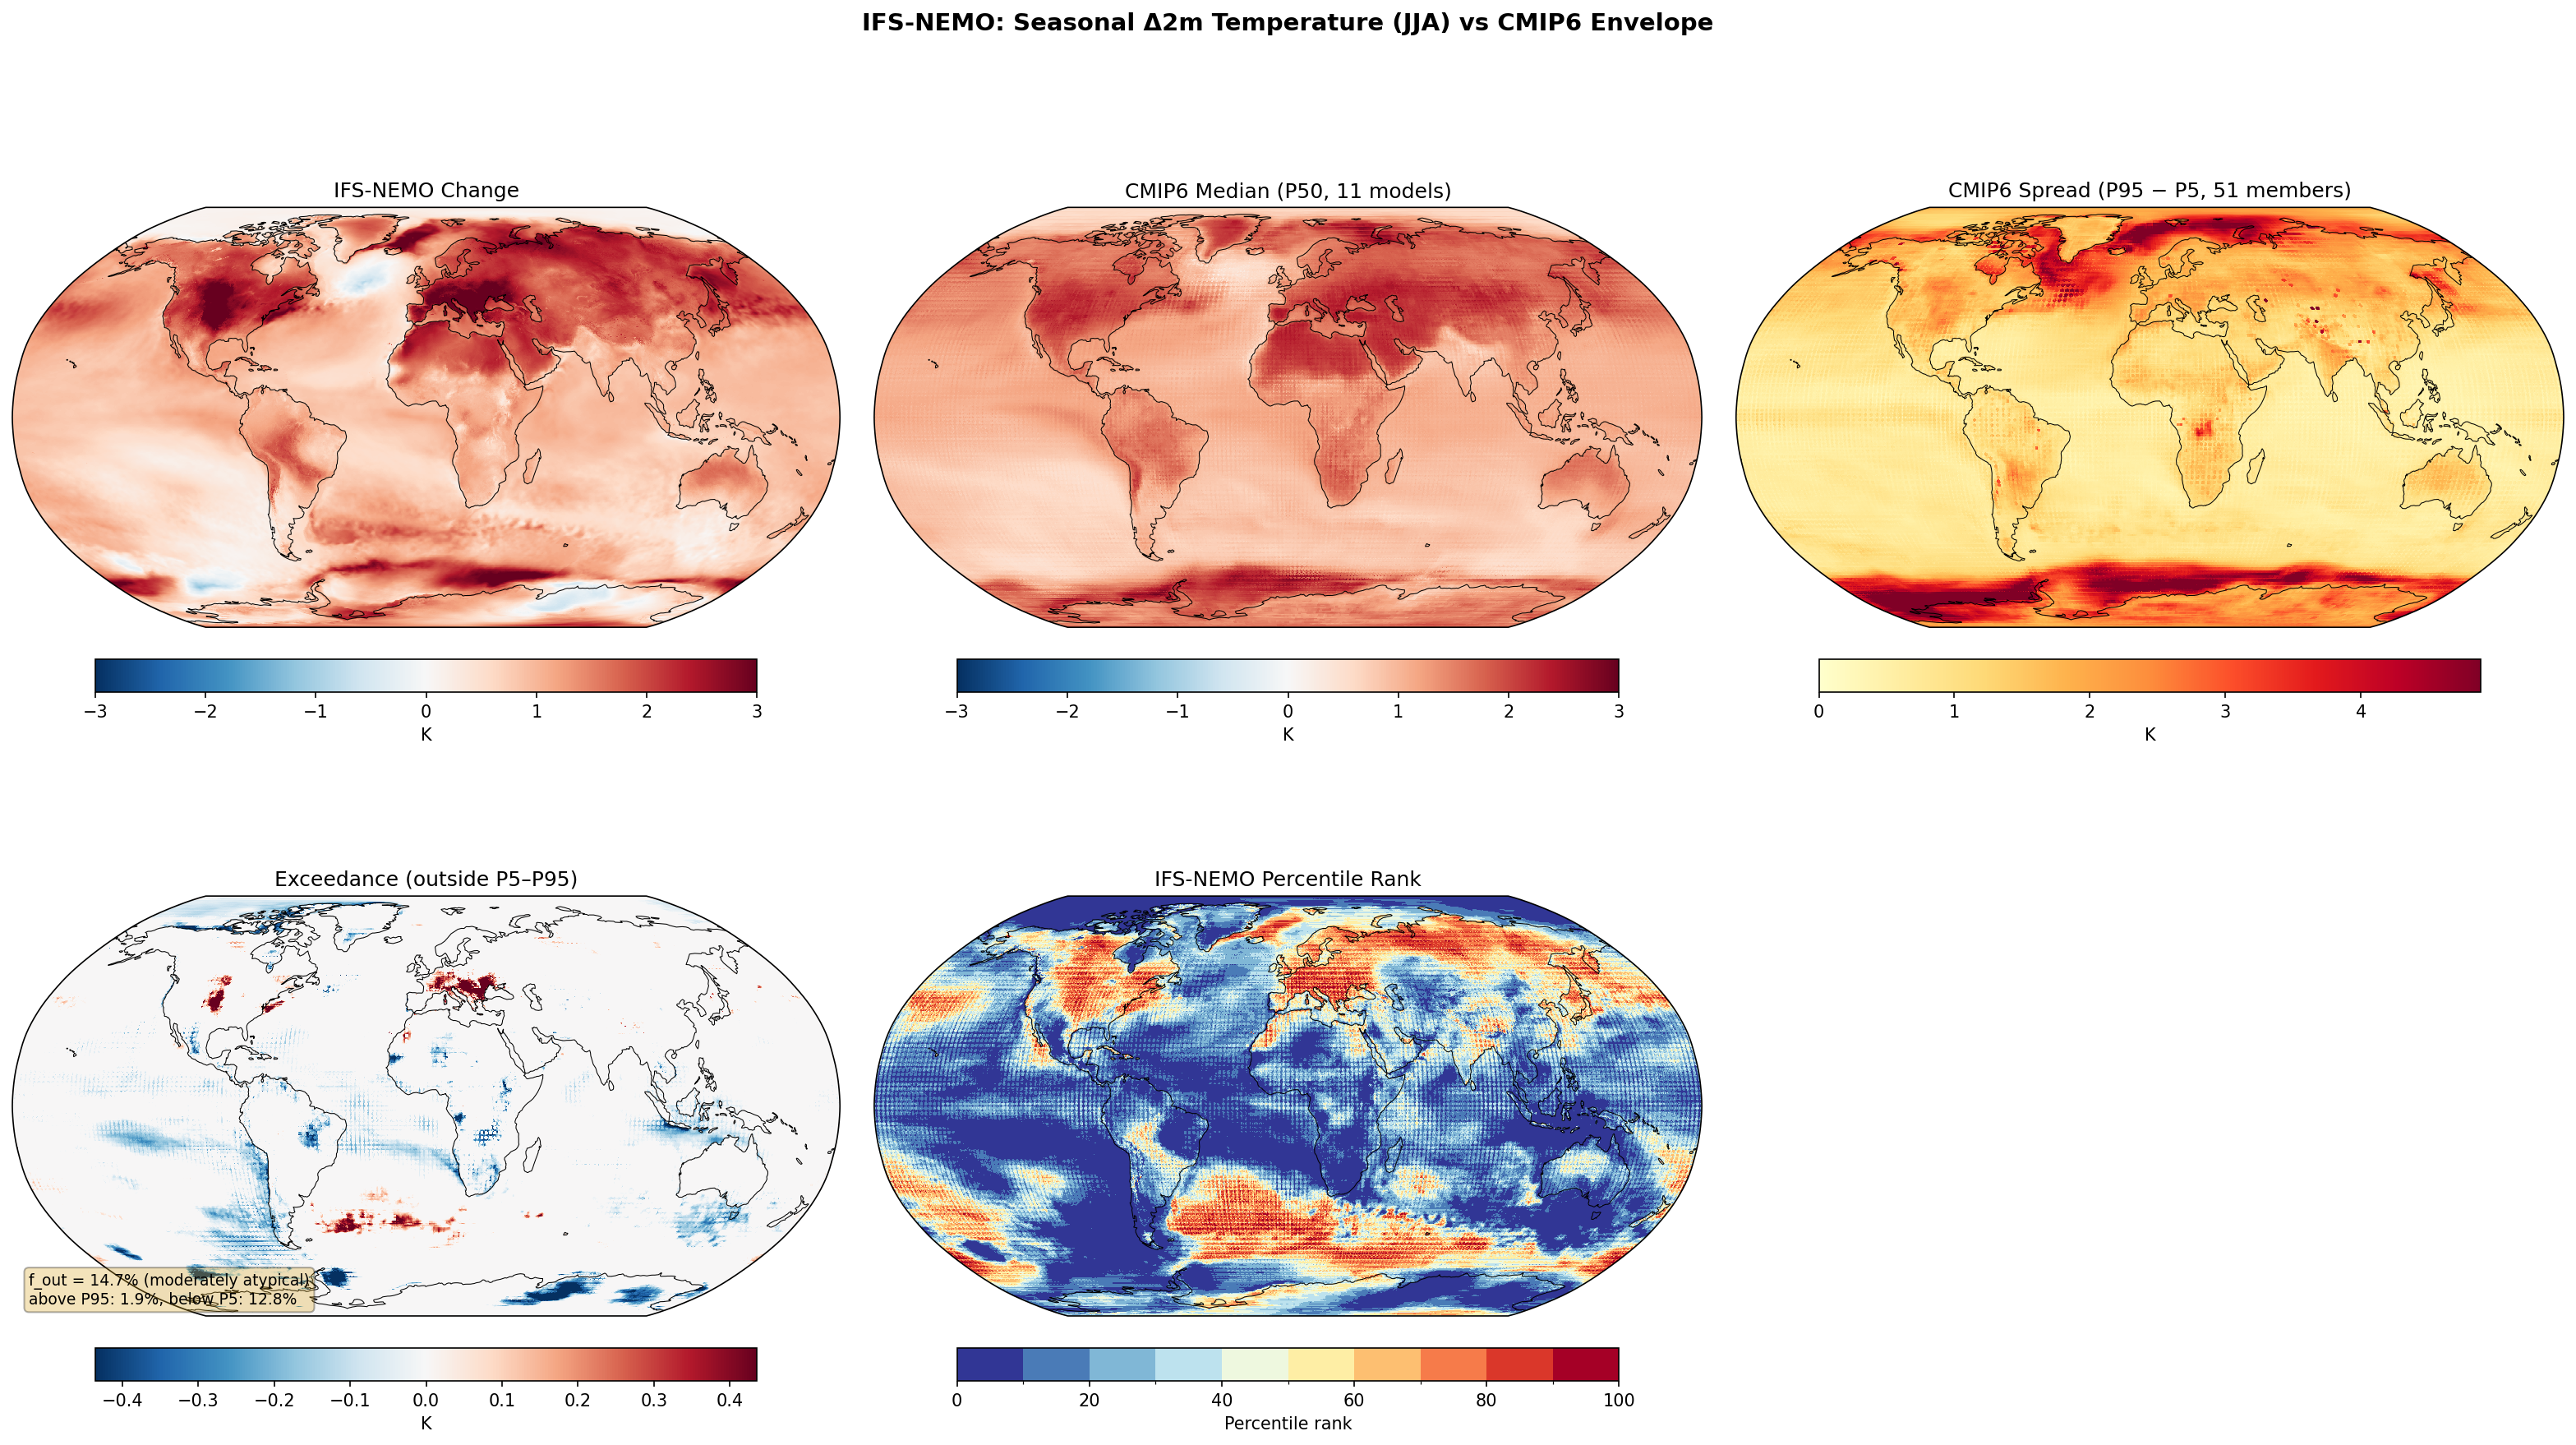
Seasonal 2m Temperature Change — IFS-NEMO (JJA) f_out 14.7%
Envelope Metrics
| f_out (outside P5–P95) | 14.7% moderately atypical |
|---|---|
| Above P95 | 1.9% |
| Below P5 | 12.8% |
| CMIP6 ensemble | 11 models, 51 members |
| Variables | avg_2t |
|---|---|
| Models | ifs-nemo |
| Units | K |
| Baseline | 1990-2014 |
| Future | 2040-2049 |
| Method | Per-season future mean minus historical mean. Compared to CMIP6 percentile envelope (P5, P50, P95). |
Summary high
IFS-NEMO projects a distinct JJA warming pattern characterized by significantly weaker warming over the global oceans compared to CMIP6, contrasting with robust warming over Northern Hemisphere land, particularly Europe.
Key Findings
- The model is moderately atypical (f_out = 14.7%), with the deviation heavily skewed towards weaker warming (12.8% below P5) rather than excessive warming (1.9% above P95).
- A prominent 'warming hole' (absolute cooling or minimal warming) in the North Atlantic Subpolar Gyre falls well below the CMIP6 P5 threshold.
- Widespread oceanic regions, particularly in the tropics and Southern Hemisphere, show warming rates below the CMIP6 5th percentile.
- Parts of Central/Southern Europe exhibit warming at or exceeding the CMIP6 95th percentile, contrasting with the cooler global signal.
Spatial Patterns
The Percentile Rank panel reveals a stark land-sea contrast: oceans are dominated by very low ranks (<10), indicating warming near the bottom of the CMIP6 distribution. Conversely, land areas in the Northern Hemisphere mostly fall within the interquartile range (25-75), with a notable hot-spot over Europe (ranks >90). The North Atlantic features a coherent region of rank ~0, corresponding to the strong blue signal in the exceedance map.
Model Agreement
IFS-NEMO agrees well with the CMIP6 ensemble spread over North America and most of Asia. The primary disagreement is the systematic 'cool' response (relative to CMIP6) over the oceans and the specific 'hot' response over Europe. The North Atlantic disagreement is substantial, with IFS-NEMO showing a much stronger local cooling signal than the CMIP6 median.
Physical Interpretation
The widespread weaker oceanic warming may result from more efficient vertical heat mixing in the high-resolution eddy-resolving ocean (NEMO), delaying surface warming compared to coarser models. The deep North Atlantic cooling likely indicates a slowdown of the Atlantic Meridional Overturning Circulation (AMOC) or distinct subpolar gyre dynamics resolved at this resolution. The enhanced warming over Europe suggests strong land-atmosphere coupling, where soil moisture depletion in summer amplifies surface temperatures (drying feedback).
Caveats
- The 10-year future window (2040-2049) is short, meaning internal variability (e.g., decadal oscillations in the Pacific or Atlantic) significantly influences the mean change.
- The 'cooler than CMIP6' result might indicate lower climate sensitivity in IFS-NEMO or that the CMIP6 ensemble includes models with unrealistically high sensitivity.
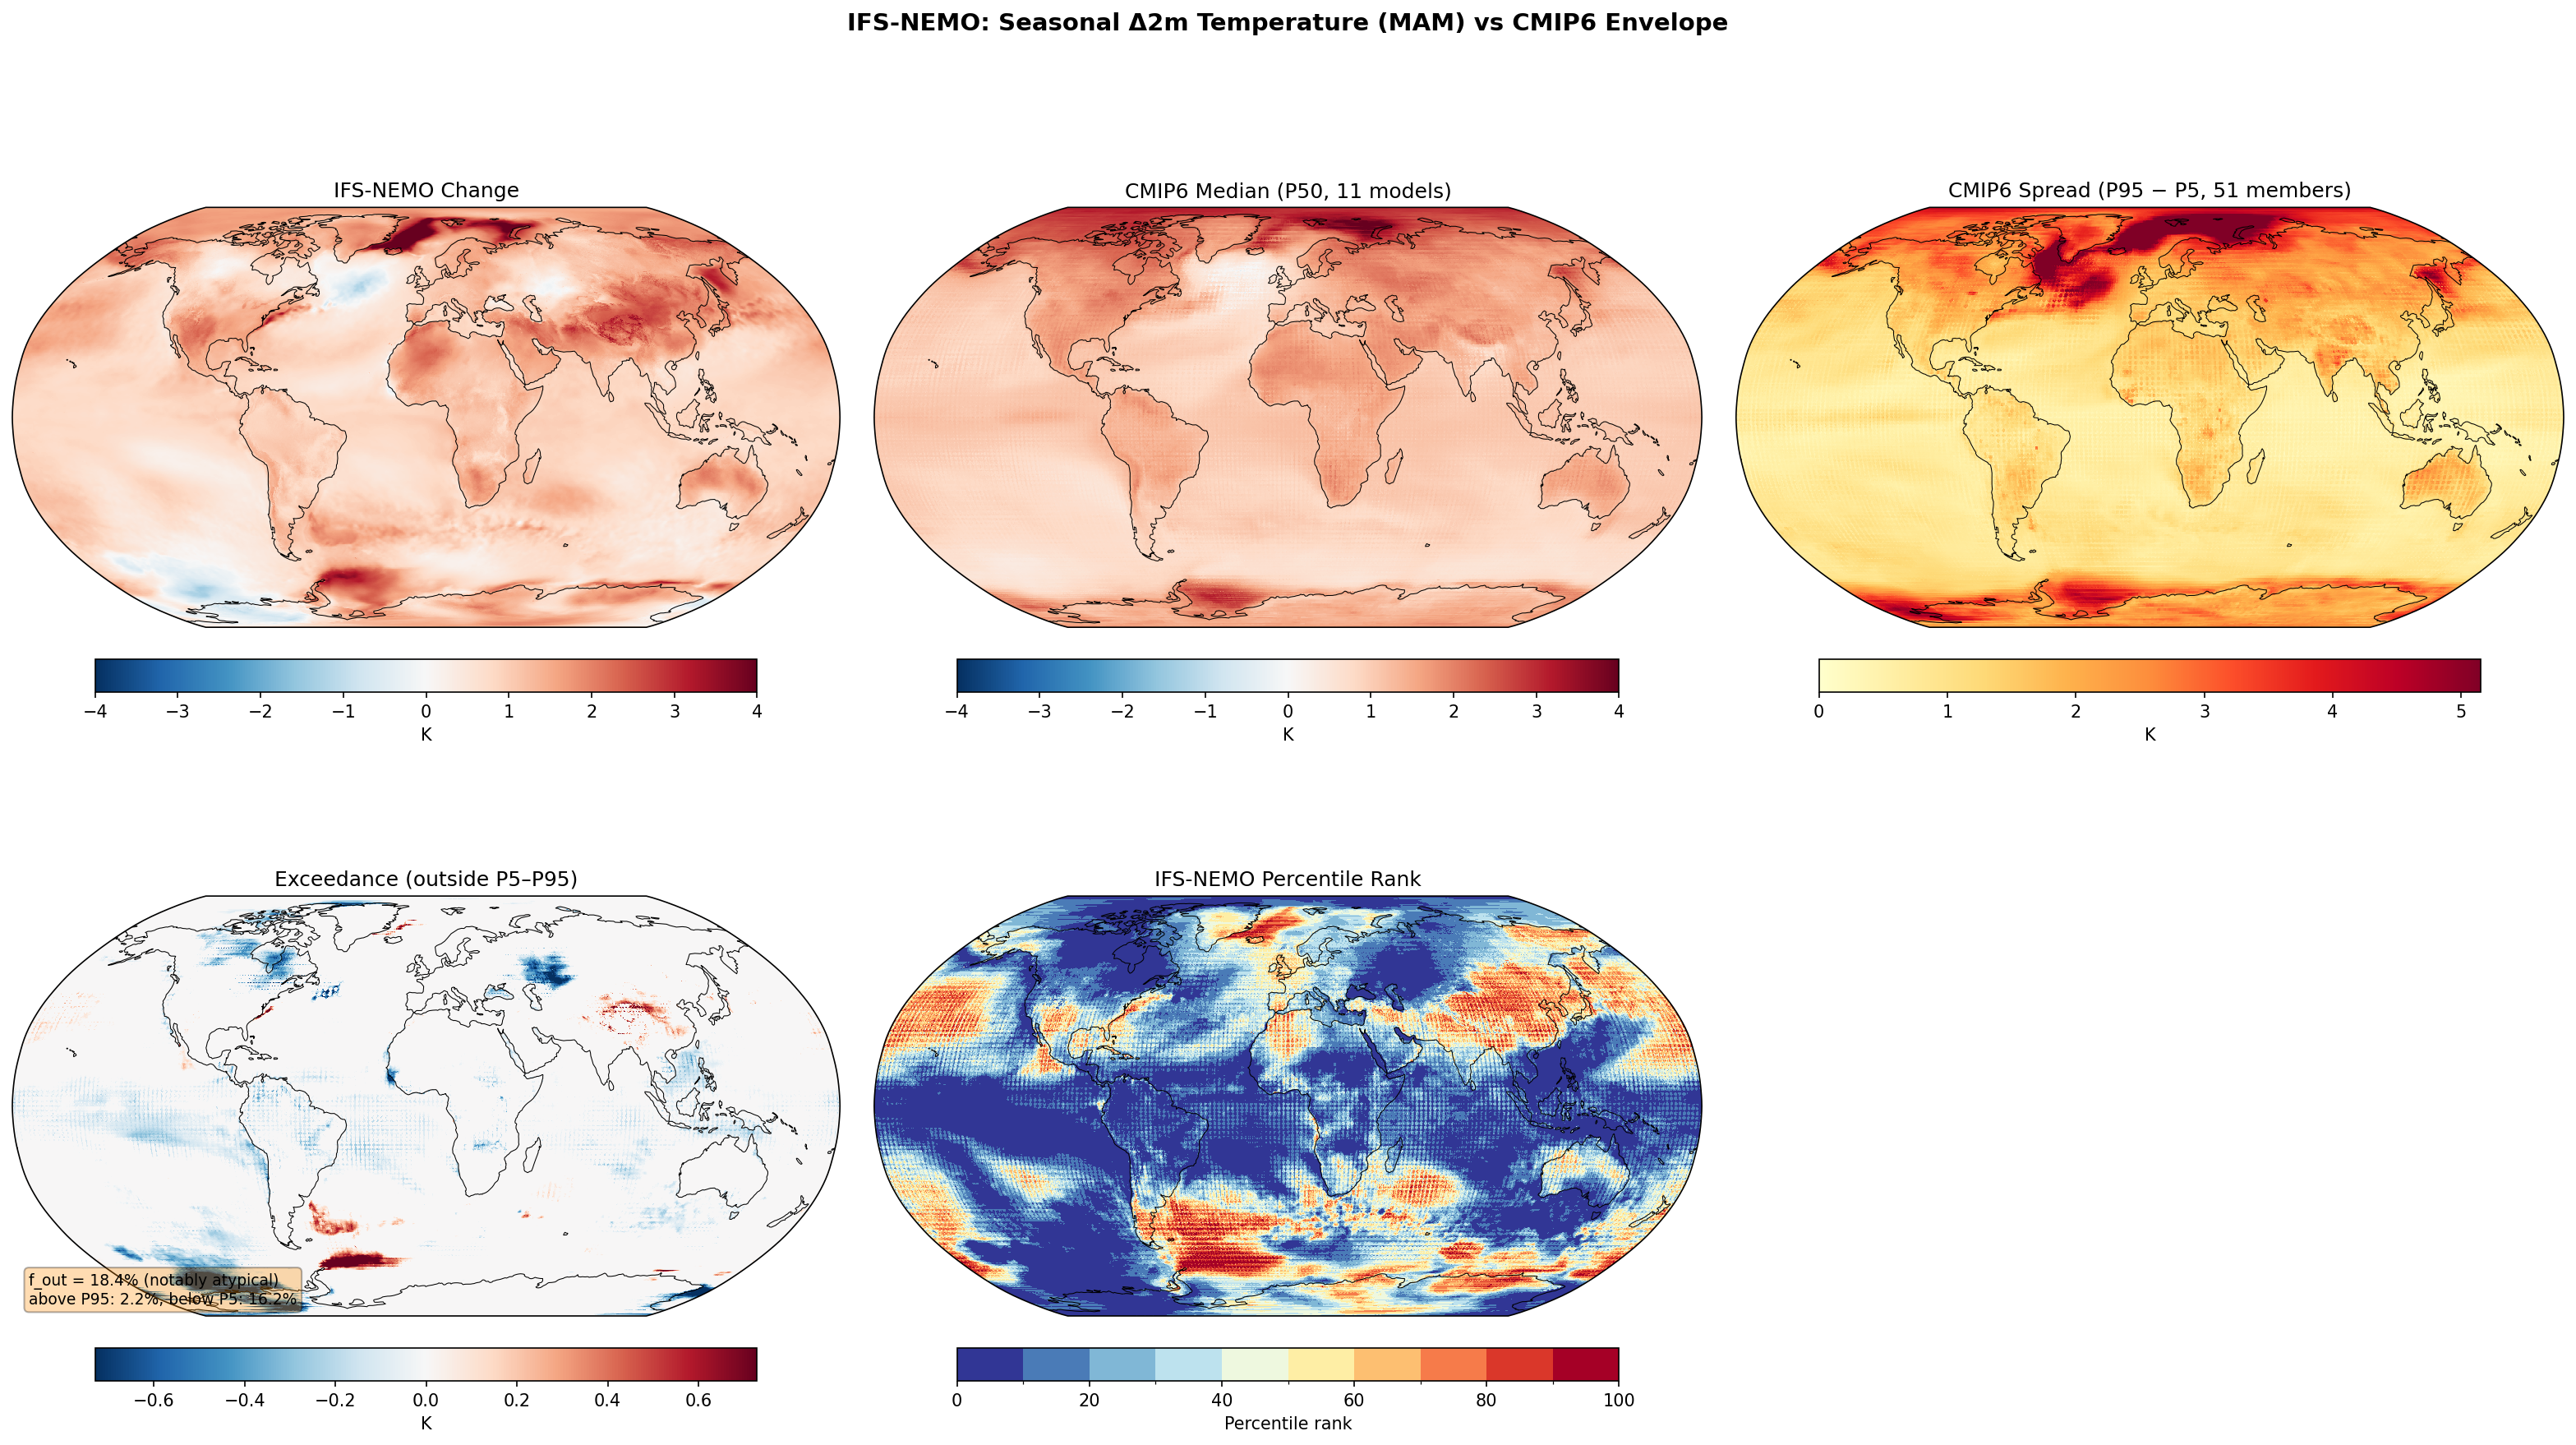
Seasonal 2m Temperature Change — IFS-NEMO (MAM) f_out 18.4%
Envelope Metrics
| f_out (outside P5–P95) | 18.4% notably atypical |
|---|---|
| Above P95 | 2.2% |
| Below P5 | 16.2% |
| CMIP6 ensemble | 11 models, 51 members |
| Variables | avg_2t |
|---|---|
| Models | ifs-nemo |
| Units | K |
| Baseline | 1990-2014 |
| Future | 2040-2049 |
| Method | Per-season future mean minus historical mean. Compared to CMIP6 percentile envelope (P5, P50, P95). |
Summary high
IFS-NEMO projects significantly weaker warming (and regional cooling) for MAM 2040–2049 compared to the CMIP6 ensemble, with 16.2% of the global area falling below the CMIP6 5th percentile.
Key Findings
- IFS-NEMO exhibits a 'cold' projection relative to CMIP6, with 16.2% of the area cooler than the P5 threshold and only 2.2% warmer than P95.
- A strong North Atlantic warming hole and unexpected cooling over North America are the dominant features driving the deviation from the CMIP6 envelope.
- Southern Ocean responses are highly heterogeneous, showing adjacent regions of exceedance on both the high (red) and low (blue) sides of the CMIP6 distribution.
Spatial Patterns
The percentile rank map is dominated by deep blue (0–20th percentile) across most ocean basins, North America, and North Africa. The North Atlantic features a distinct cooling signal (negative change), contrasting with the general warming in the CMIP6 median. Conversely, parts of the Southern Ocean and sporadic patches in East Asia show high percentiles (>80).
Model Agreement
IFS-NEMO generally disagrees with the magnitude of CMIP6 warming, consistently tracking the lower bound of the ensemble. The disagreement is most pronounced in the North Atlantic (likely stronger AMOC slowdown or gyre dynamics in IFS-NEMO) and North America (cooling vs. CMIP6 warming).
Physical Interpretation
The widespread lower warming suggests IFS-NEMO may be in a specific phase of internal variability (e.g., negative IPO or weak AMOC phase) that masks the forced warming signal over this 10-year period. The specific North Atlantic cooling is likely enhanced by the high-resolution ocean (eddy-permitting/resolving) representing boundary currents and deep convection differently than coarse CMIP6 models. The North American cooling in spring (MAM) may stem from internal atmospheric variability (e.g., blocking patterns) or snow-albedo feedbacks (delayed melt) not present in the ensemble mean.
Caveats
- The 10-year averaging period (2040–2049) preserves internal decadal variability in the single IFS-NEMO realization, whereas the CMIP6 envelope smoothes this out; differences may be transient variability rather than structural response.
- High f_out is driven heavily by the 'below P5' category, indicating a systematic cold offset rather than bidirectional volatility.
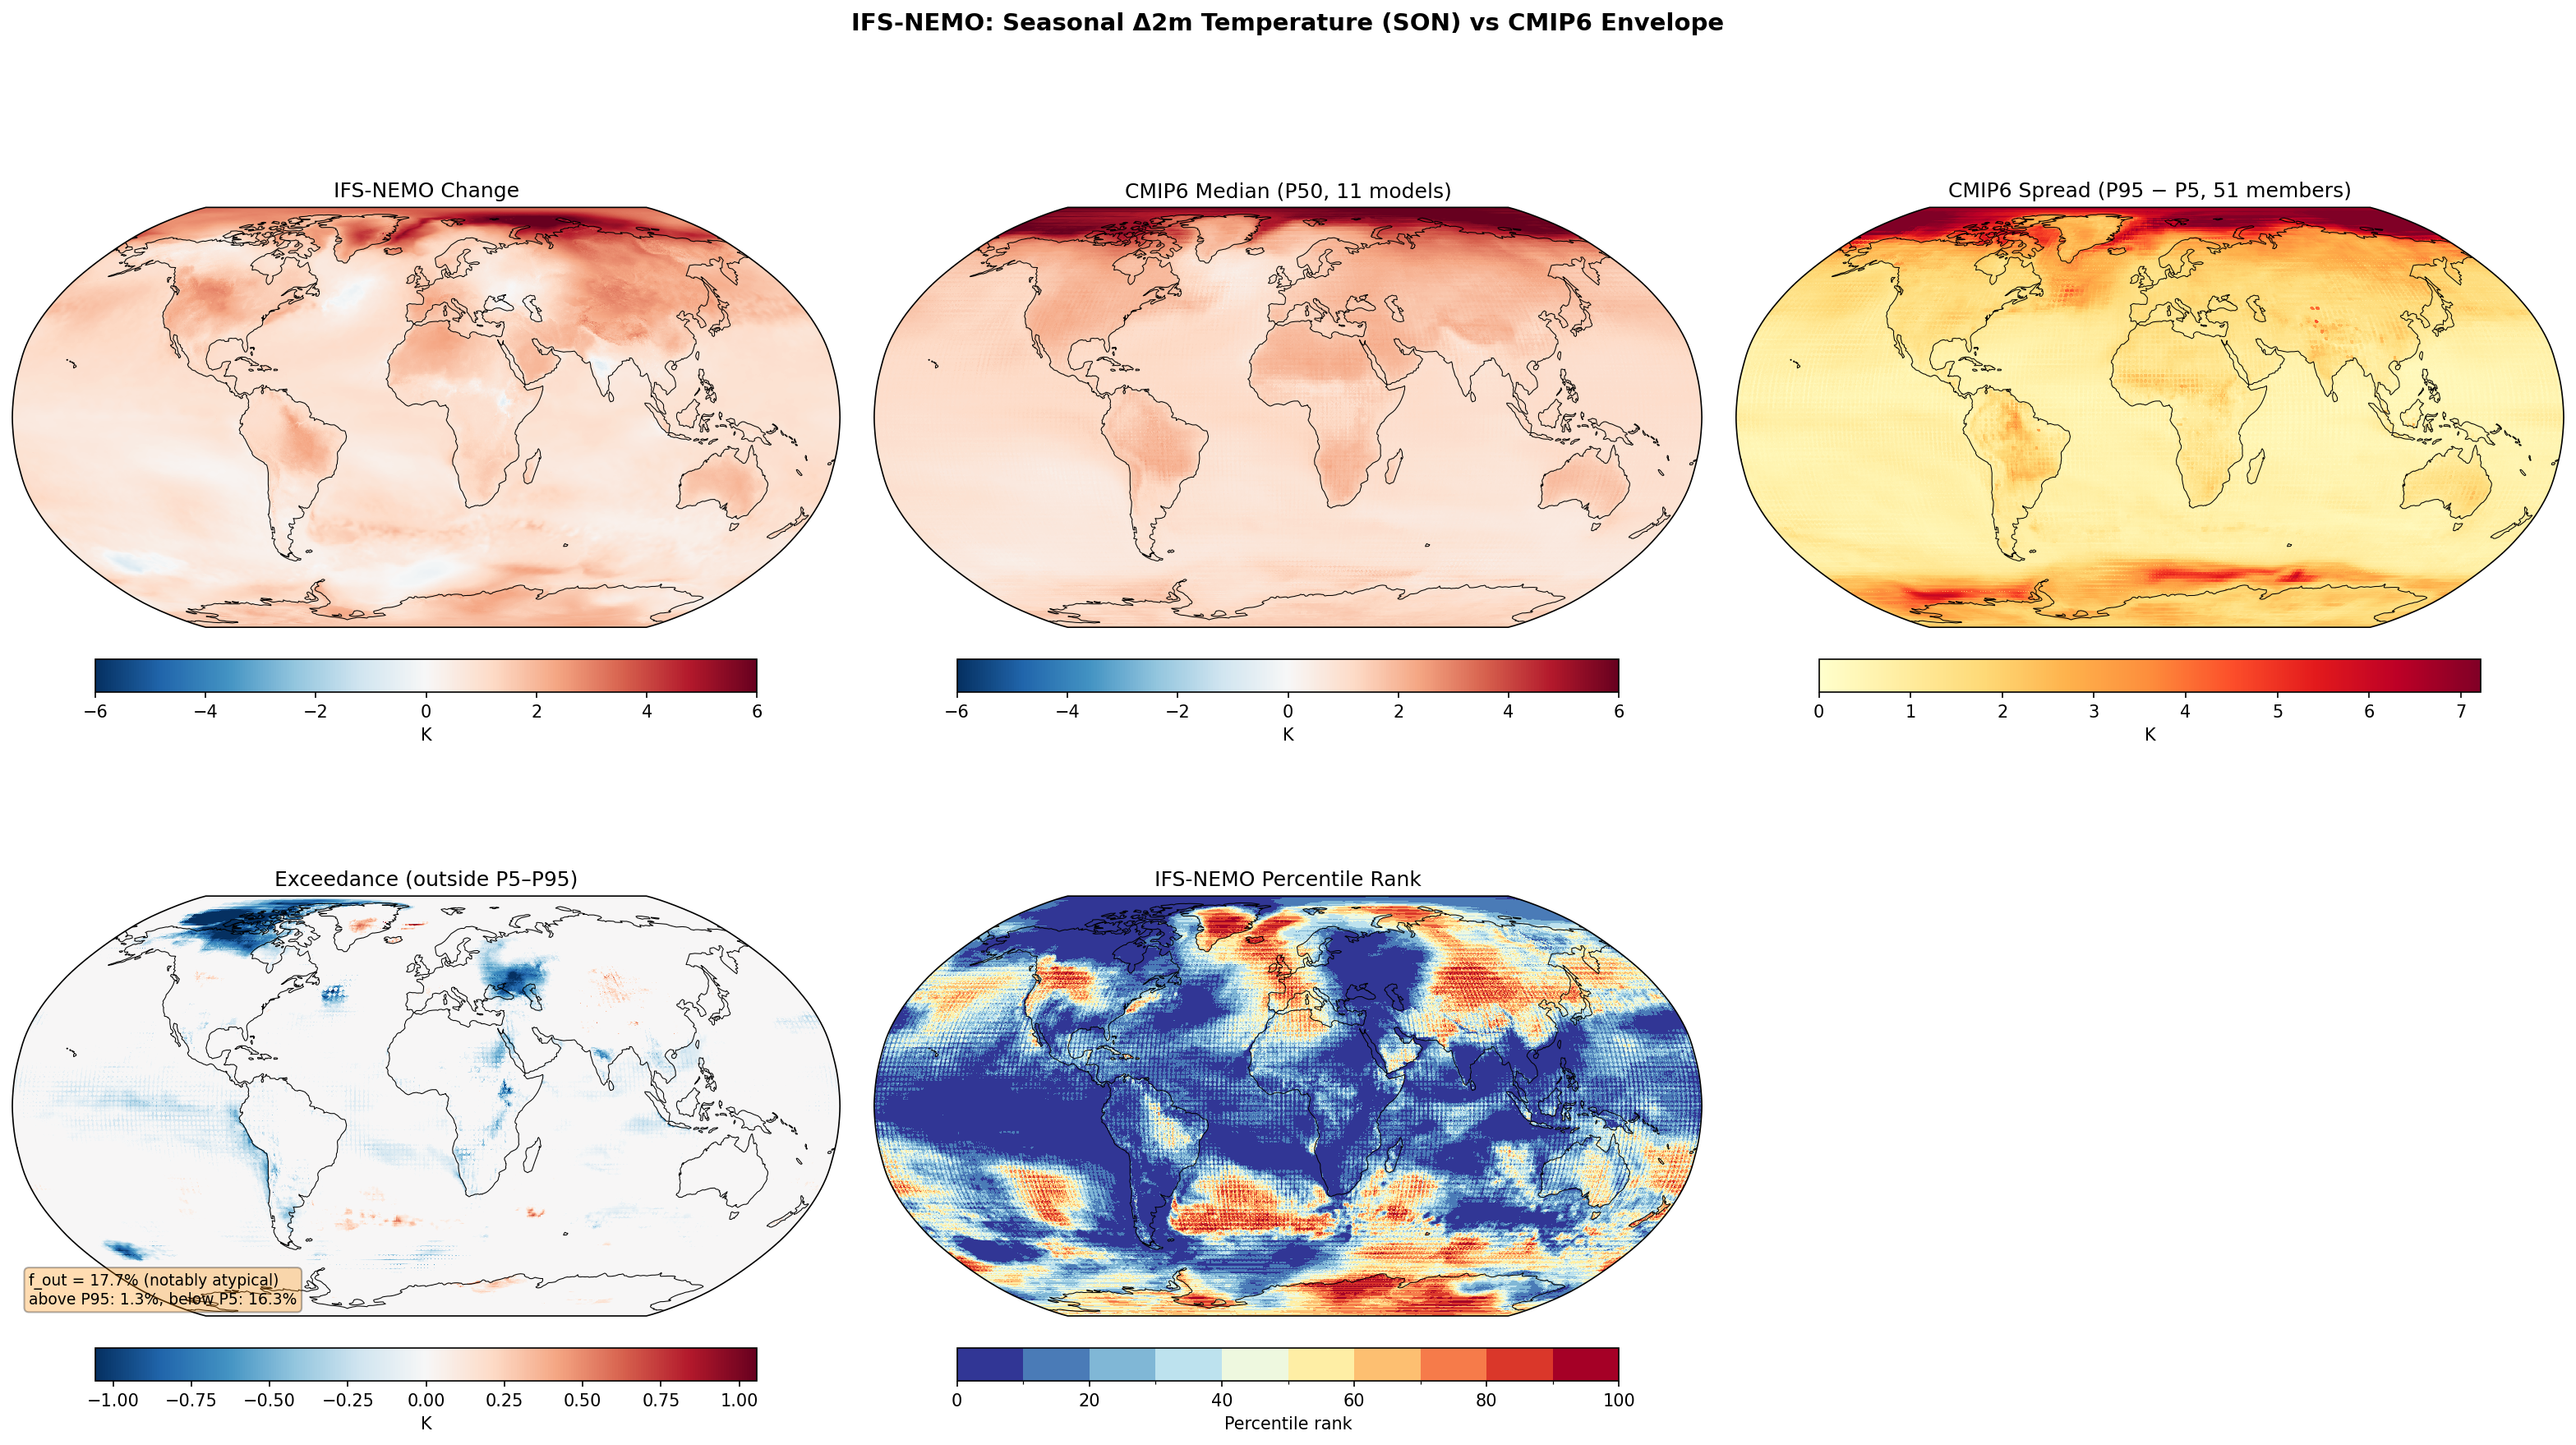
Seasonal 2m Temperature Change — IFS-NEMO (SON) f_out 17.7%
Envelope Metrics
| f_out (outside P5–P95) | 17.7% notably atypical |
|---|---|
| Above P95 | 1.3% |
| Below P5 | 16.3% |
| CMIP6 ensemble | 11 models, 51 members |
| Variables | avg_2t |
|---|---|
| Models | ifs-nemo |
| Units | K |
| Baseline | 1990-2014 |
| Future | 2040-2049 |
| Method | Per-season future mean minus historical mean. Compared to CMIP6 percentile envelope (P5, P50, P95). |
Summary high
For the SON season (2040-2049), IFS-NEMO projects widespread warming that is notably weaker than the CMIP6 ensemble, with 17.7% of the global area falling outside the CMIP6 envelope (mostly below the 5th percentile).
Key Findings
- IFS-NEMO is systematically 'cooler' (warms less) than CMIP6: 16.3% of the globe warms less than the CMIP6 P5 threshold, while only 1.3% exceeds P95.
- A prominent region of lower-than-expected warming is observed in the North Atlantic, extending into the Barents/Kara Seas and Northern Eurasia.
- Tropical oceans generally exhibit lower percentile ranks (0–20%), indicating a weaker tropical warming response compared to the CMIP6 median.
Spatial Patterns
While polar amplification is visible, the magnitude in the Eurasian Arctic is suppressed compared to CMIP6. The North Atlantic exhibits a distinct 'warming hole' signature (weak warming/cooling) that is stronger than in the ensemble. The Southern Ocean shows complex banding, with some specific regions showing stronger warming (exceeding P95) contrary to the global trend.
Model Agreement
The model is notably atypical (f_out = 17.7%) due to a global tendency toward lower warming rates. While the broad geographic patterns (land > ocean warming, Arctic amplification) agree qualitatively, the magnitude of the response is significantly damped relative to the CMIP6 distribution.
Physical Interpretation
The widespread 'cool' exceedance suggests either a lower Transient Climate Response (TCR) in IFS-NEMO or a specific phase of internal decadal variability (e.g., cold-phase IPO, weak AMOC) captured in this single realization but smoothed out in the CMIP6 ensemble. The specific deficit in Barents/Kara Sea warming suggests delayed sea-ice loss or weaker Atlantification compared to CMIP6 models in autumn.
Caveats
- Analysis is based on a single 10-year realization, making it susceptible to internal climate variability masking the forced signal.
- The 'cooler' signal does not imply bias but may reflect higher fidelity in resolving processes like the North Atlantic warming hole or ocean eddies.
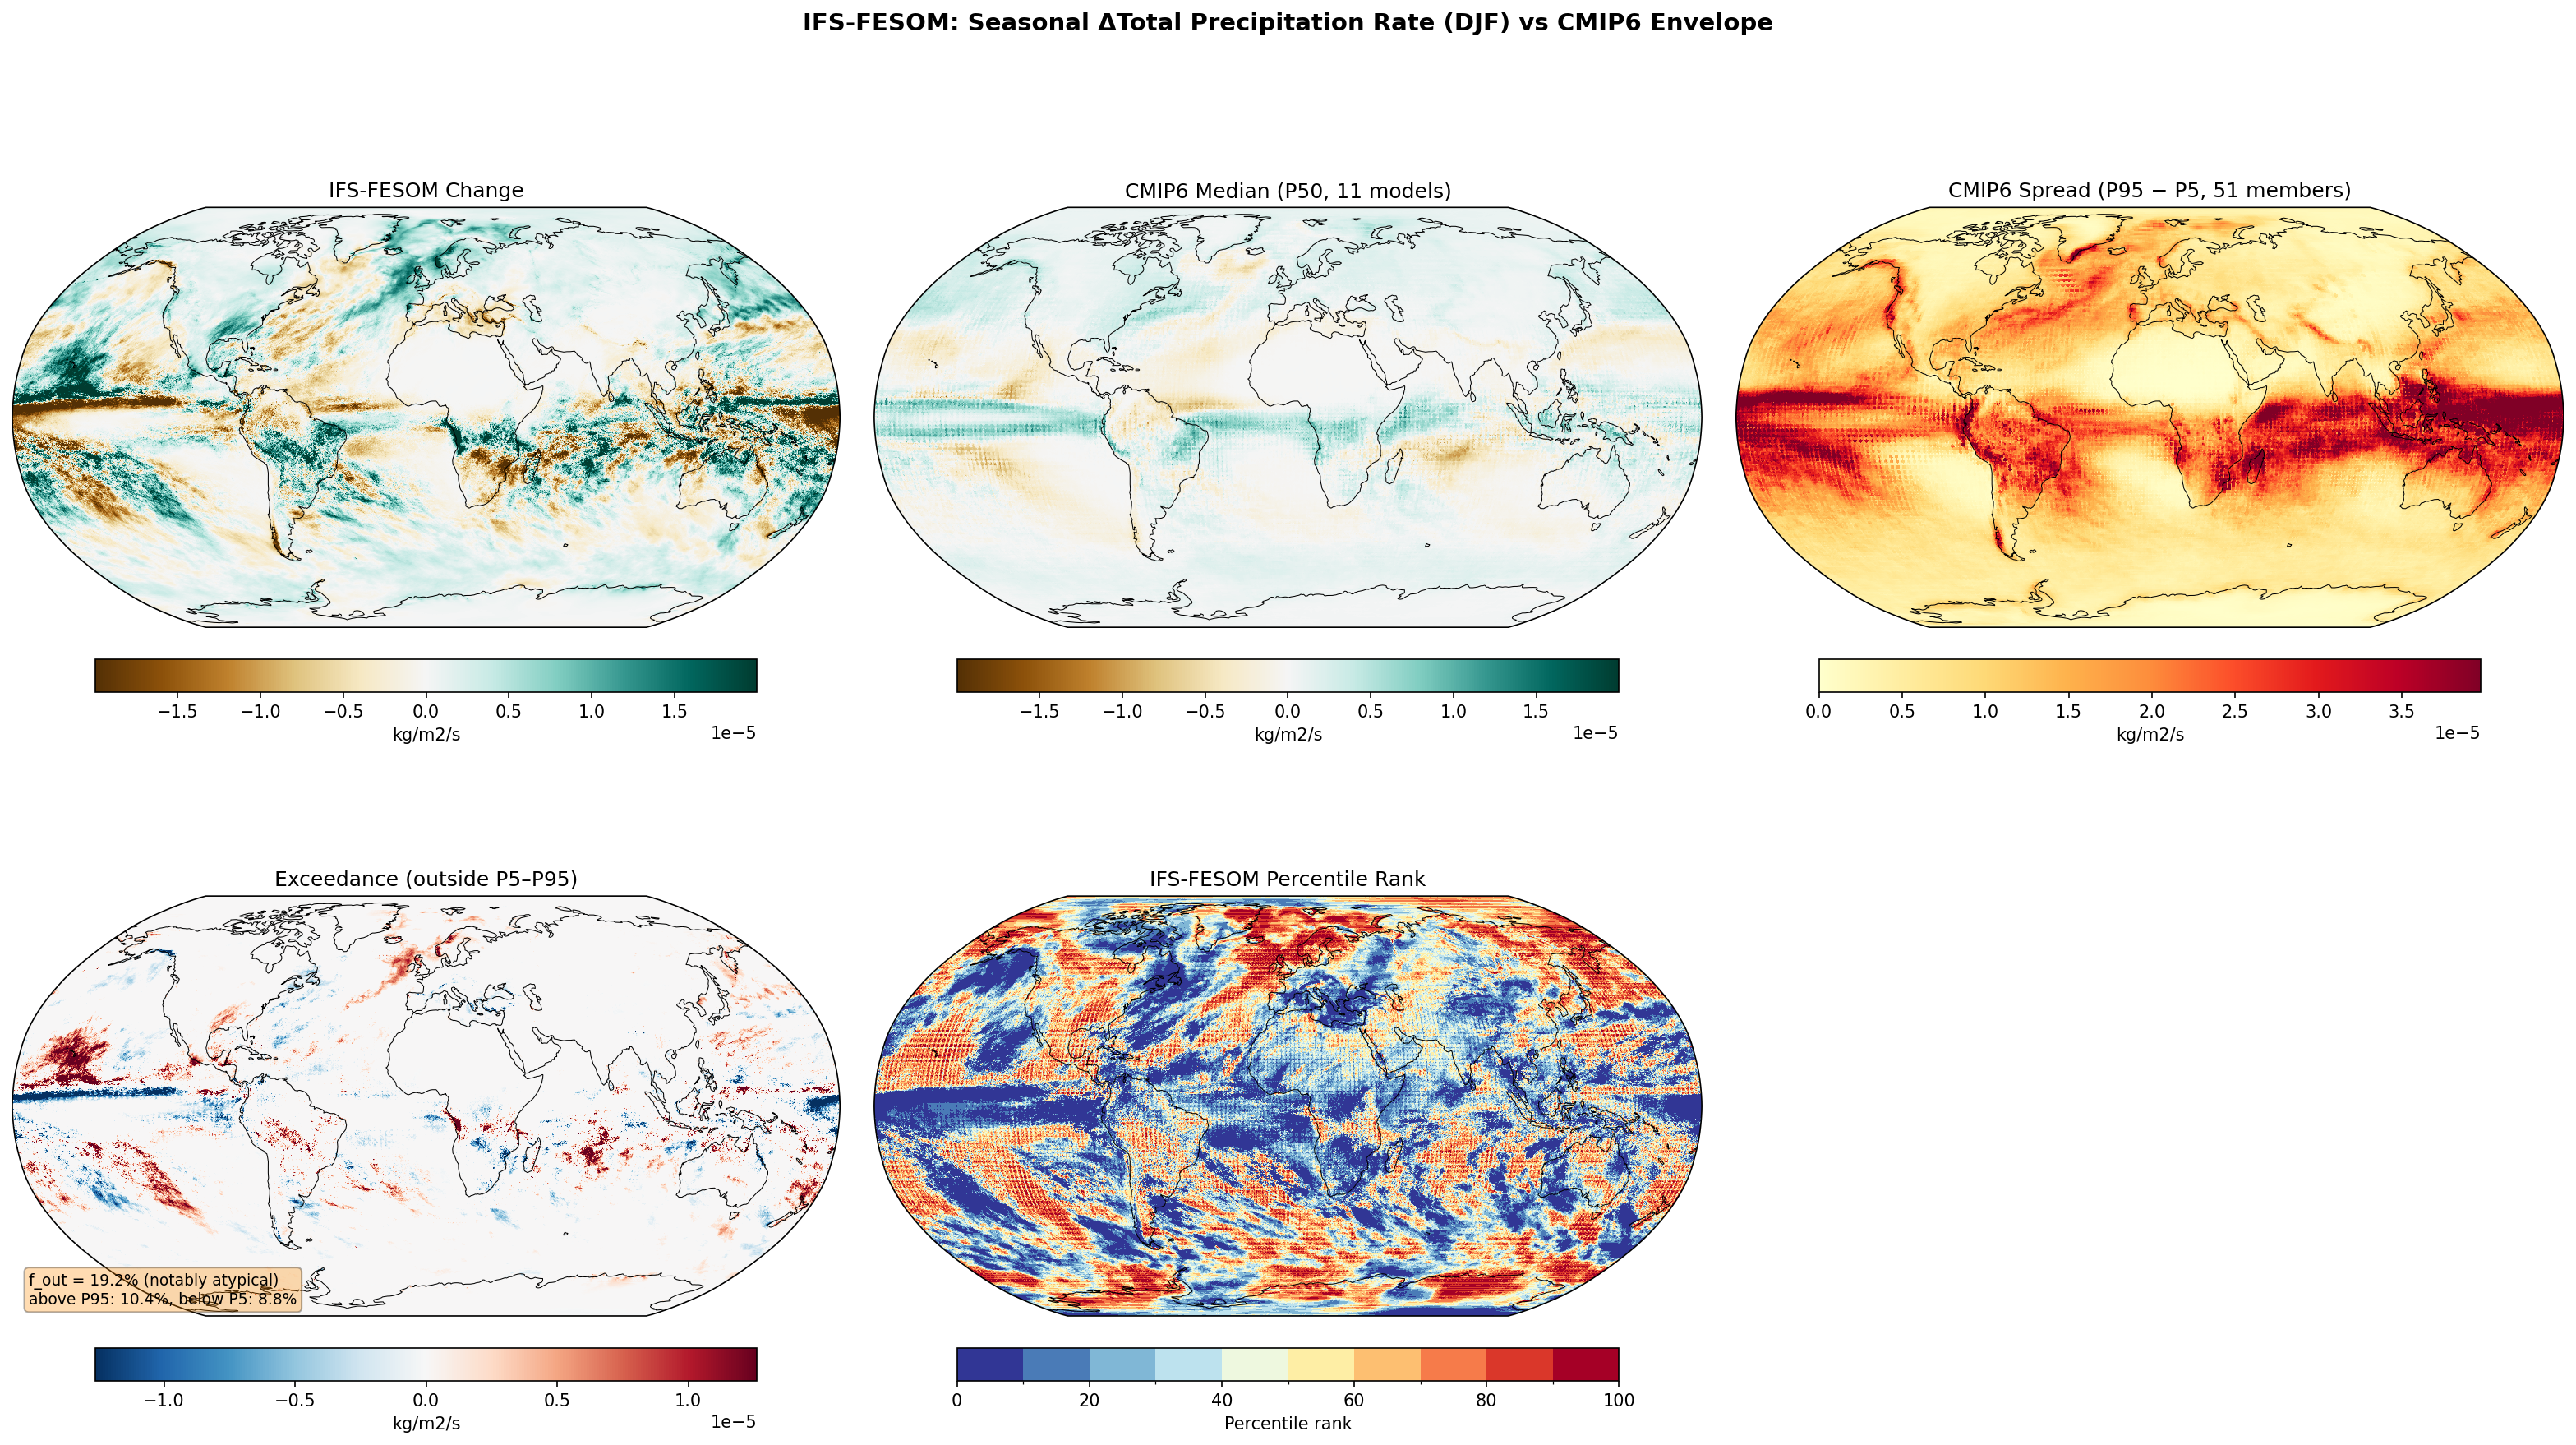
Seasonal Total Precipitation Rate Change — IFS-FESOM (DJF) f_out 19.2%
Envelope Metrics
| f_out (outside P5–P95) | 19.2% notably atypical |
|---|---|
| Above P95 | 10.4% |
| Below P5 | 8.8% |
| CMIP6 ensemble | 11 models, 51 members |
| Variables | avg_tprate |
|---|---|
| Models | ifs-fesom |
| Units | kg/m2/s |
| Baseline | 1990-2014 |
| Future | 2040-2049 |
| Method | Per-season future mean minus historical mean. Compared to CMIP6 percentile envelope (P5, P50, P95). |
Summary high
IFS-FESOM (DJF) exhibits a notably atypical precipitation response (f_out = 19.2%) compared to CMIP6, characterized by intense structural disagreements in the tropical belts, specifically a sharp drying band in the equatorial Pacific and enhanced wetting in the Indian Ocean.
Key Findings
- A prominent zonal band of drying along the equatorial Pacific falls below the CMIP6 P5 threshold, contrasting with the broad wetting trend typical of the CMIP6 ensemble.
- The Amazon and Southern Africa show drying signals that exceed the CMIP6 drying range (below P5), indicating a more severe potential impact on these monsoon systems.
- Intense wetting in the tropical Indian Ocean and parts of the South Pacific Convergence Zone (SPCZ) exceeds the CMIP6 P95 upper bound.
Spatial Patterns
The dominant feature is a sharp contrast in the tropics: the equatorial Pacific shows a distinct drying filament flanked by wetting, whereas the Indian Ocean shows broad, intense wetting. High latitudes (North Atlantic, North Pacific) show general wetting consistent with thermodynamic expectations, though often stronger than the CMIP6 median.
Model Agreement
Agreement is highest in the extratropics, particularly over Northern Hemisphere mid-to-high latitudes (Europe, N. Atlantic) where percentile ranks hover between 40–60. Disagreement is concentrated in the deep tropics and convective zones, where IFS-FESOM's high resolution likely resolves narrower ITCZ structures and different convective dynamics.
Physical Interpretation
The equatorial Pacific drying suggests IFS-FESOM may be simulating a 'La Niña-like' warming pattern or a significant narrowing/intensification of the ITCZ that coarse CMIP6 models cannot resolve. The strong Indian Ocean wetting and Amazon drying imply a robust reorganization of the Walker Circulation and Hadley Cell dynamics in this model, potentially driven by sharper SST gradients.
Caveats
- The 10-year analysis period (2040-2049) makes it difficult to disentangle the forced climate change signal from decadal internal variability (e.g., ENSO phasing).
- The extreme divergence in the tropics (f_out ~19%) warrants investigation into potential model drift or initialization shocks in the coupled system.
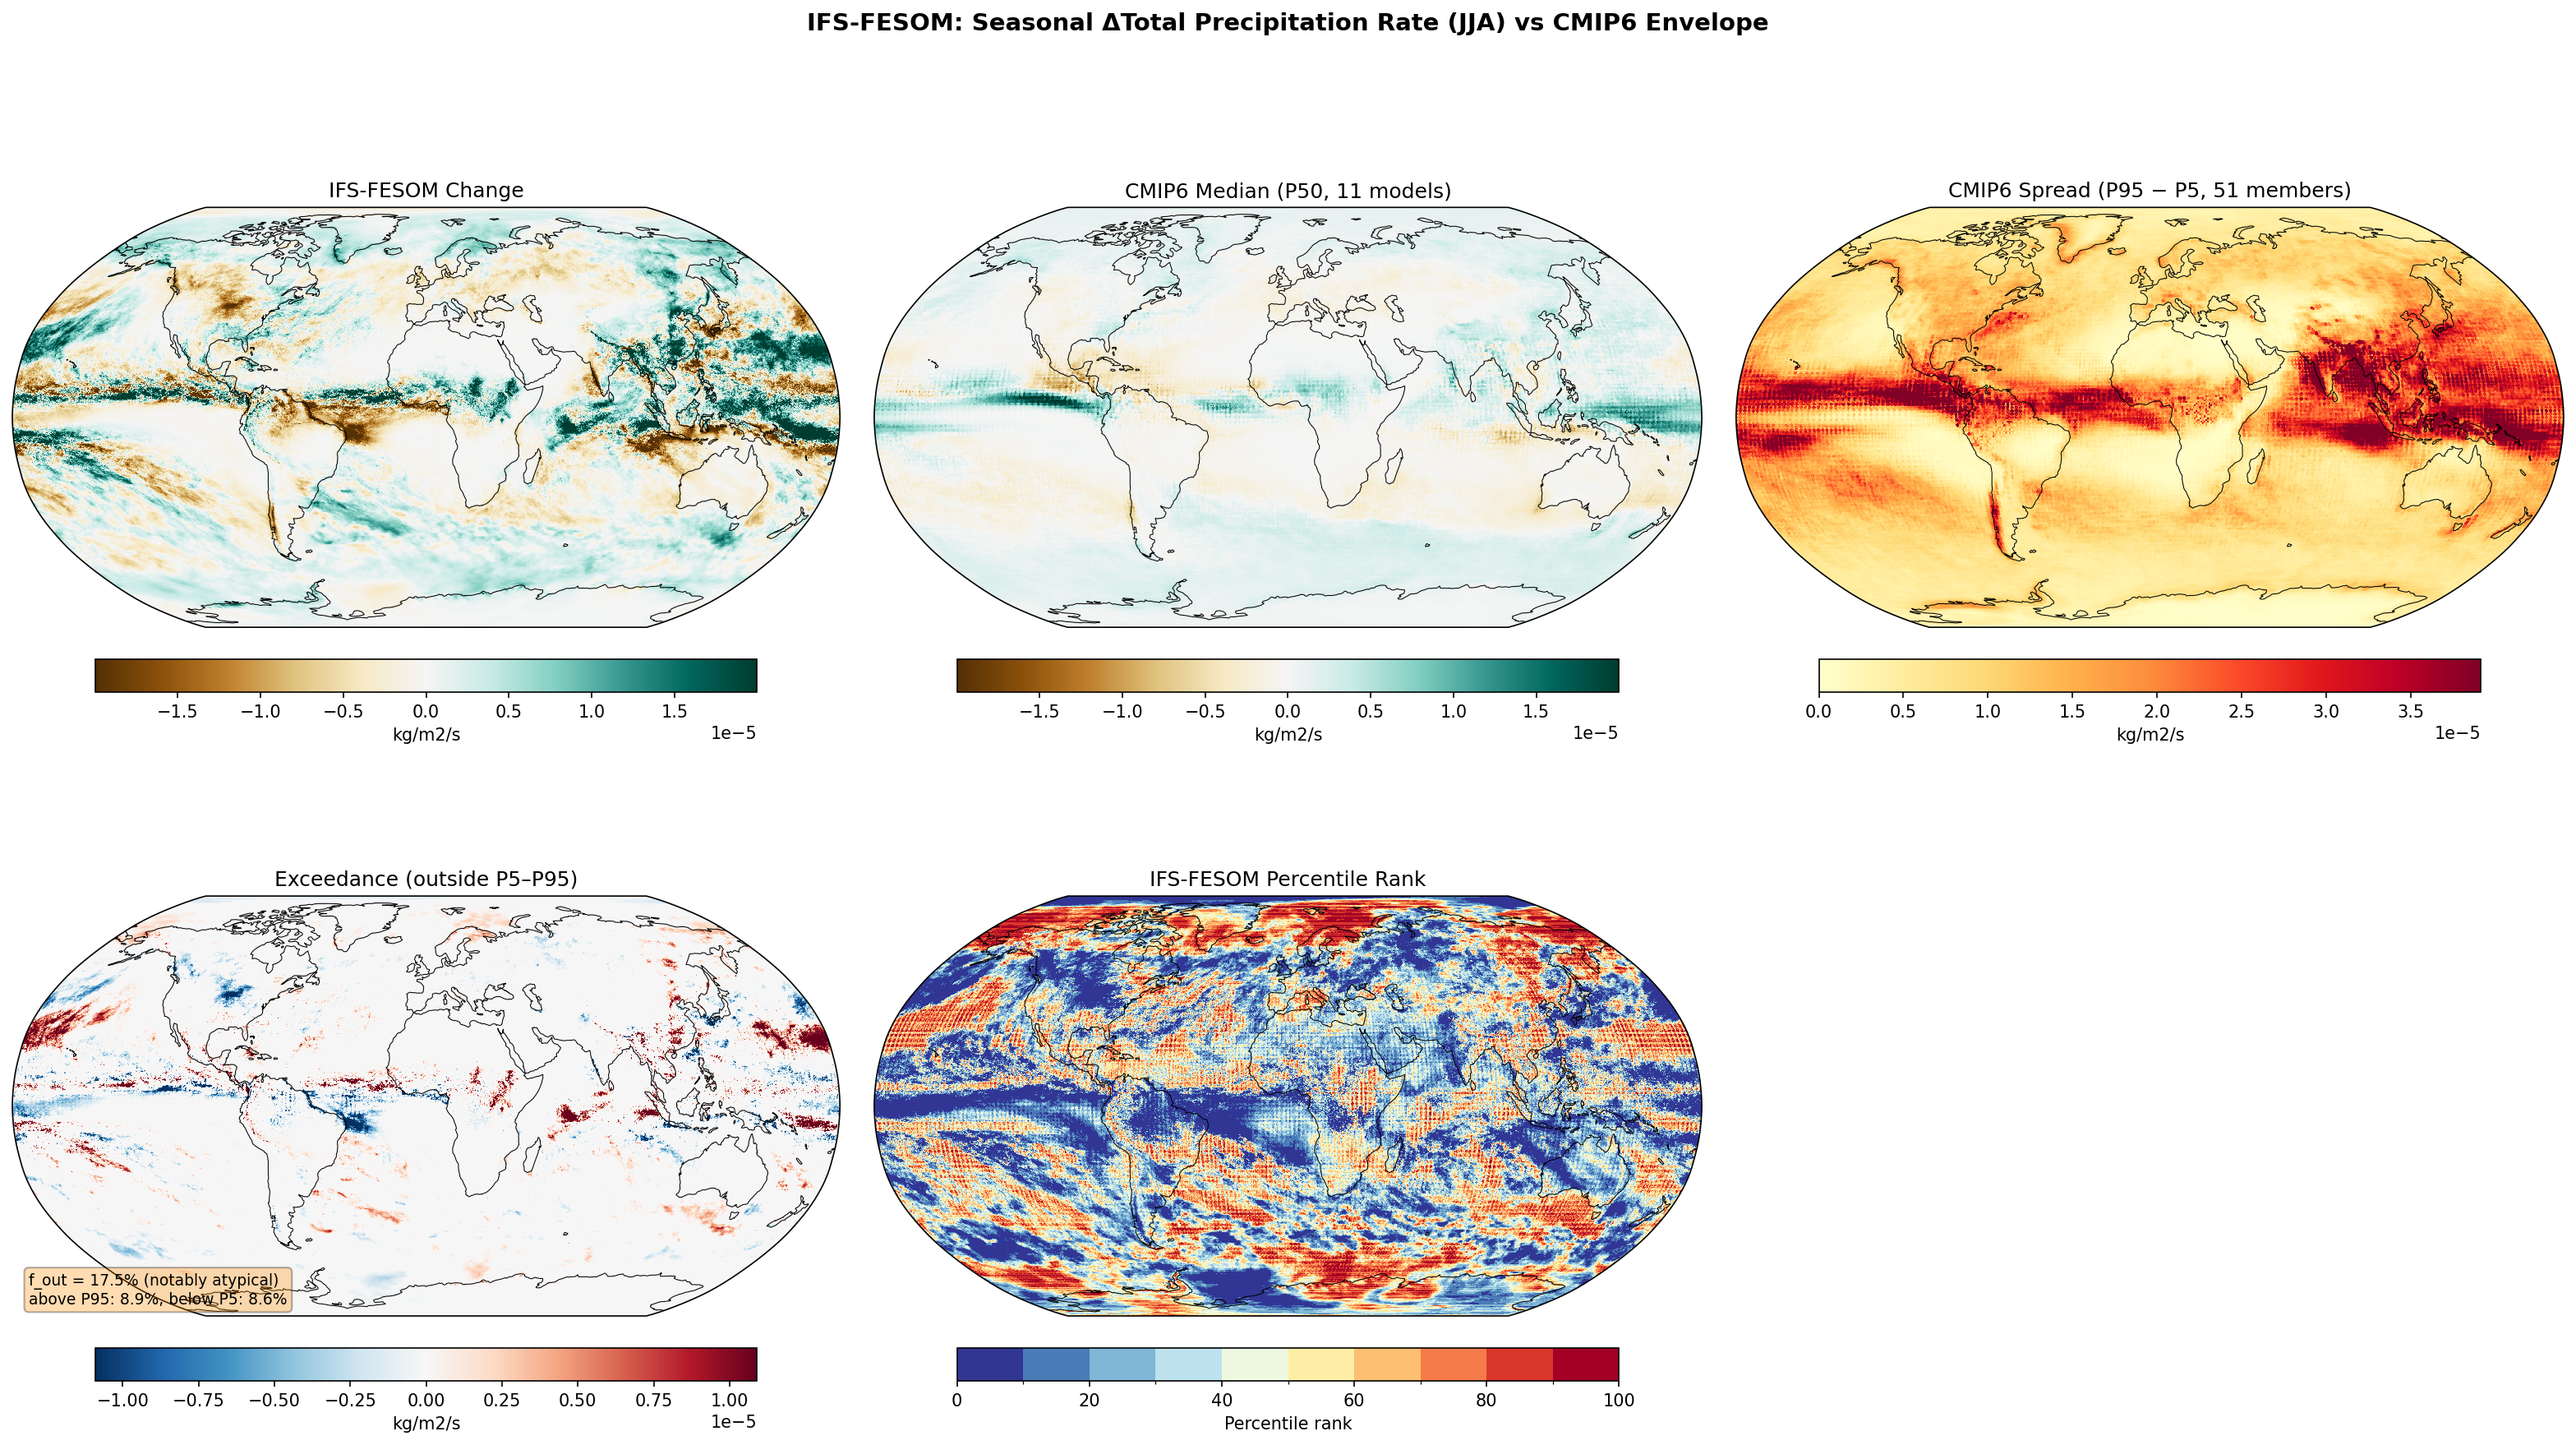
Seasonal Total Precipitation Rate Change — IFS-FESOM (JJA) f_out 17.5%
Envelope Metrics
| f_out (outside P5–P95) | 17.5% notably atypical |
|---|---|
| Above P95 | 8.9% |
| Below P5 | 8.6% |
| CMIP6 ensemble | 11 models, 51 members |
| Variables | avg_tprate |
|---|---|
| Models | ifs-fesom |
| Units | kg/m2/s |
| Baseline | 1990-2014 |
| Future | 2040-2049 |
| Method | Per-season future mean minus historical mean. Compared to CMIP6 percentile envelope (P5, P50, P95). |
Summary medium
IFS-FESOM projects JJA precipitation changes that are notably atypical (f_out = 17.5%) compared to the CMIP6 ensemble, characterized by sharper tropical convergence zones and intensified drying in the Tropical Atlantic.
Key Findings
- The area outside the CMIP6 envelope is 17.5%, classified as notably atypical, split evenly between wetter (8.9%) and drier (8.6%) extremes.
- IFS-FESOM projects significantly stronger drying in the Tropical Atlantic ITCZ region and parts of the Amazon compared to the CMIP6 P5 threshold.
- The model shows intensified wetting in the North Atlantic storm track and discrete bands in the tropical Pacific that exceed the CMIP6 P95 percentile.
- While the large-scale Asian Monsoon wetting and Mediterranean drying agree with CMIP6 in sign, IFS-FESOM exhibits sharper spatial gradients.
Spatial Patterns
The tropical oceans exhibit narrow, intense zonal bands of precipitation change (dipoles in the Pacific) reflecting a sharper ITCZ than the smoothed CMIP6 median. Strong drying is evident in Central America, the Amazon, and the Mediterranean. A coherent wetting signal is seen in the Asian Monsoon region, the Sahel, and high latitudes (Southern Ocean, North Atlantic).
Model Agreement
There is broad qualitative agreement on the thermodynamic intensification of the hydrological cycle (wet-get-wetter in the tropics/high latitudes, drying in subtropics). However, IFS-FESOM disagrees on the magnitude and precise location of tropical convection changes, particularly in the Atlantic where it falls below the P5 threshold, and in the noisy, fine-scale structures of the Pacific ITCZ/SPCZ.
Physical Interpretation
The exceedance patterns are likely driven by the high horizontal resolution (~5 km) of IFS-FESOM, which resolves narrow convective rain bands and convergence zones that are smoothed out in coarser CMIP6 models. The strong Tropical Atlantic drying suggests a more pronounced dynamical shift or weakening of the regional ITCZ. The 'noisy' percentile rank in the tropics reflects the mismatch between resolved mesoscale features and the ensemble mean.
Caveats
- The 10-year simulation period may allow decadal internal variability (e.g., ENSO phasing) to influence the change signal, contributing to the scattered tropical exceedances.
- Comparing high-resolution precipitation fields to coarse-resolution ensembles inevitably generates 'structural' exceedances due to better-resolved sharp gradients.
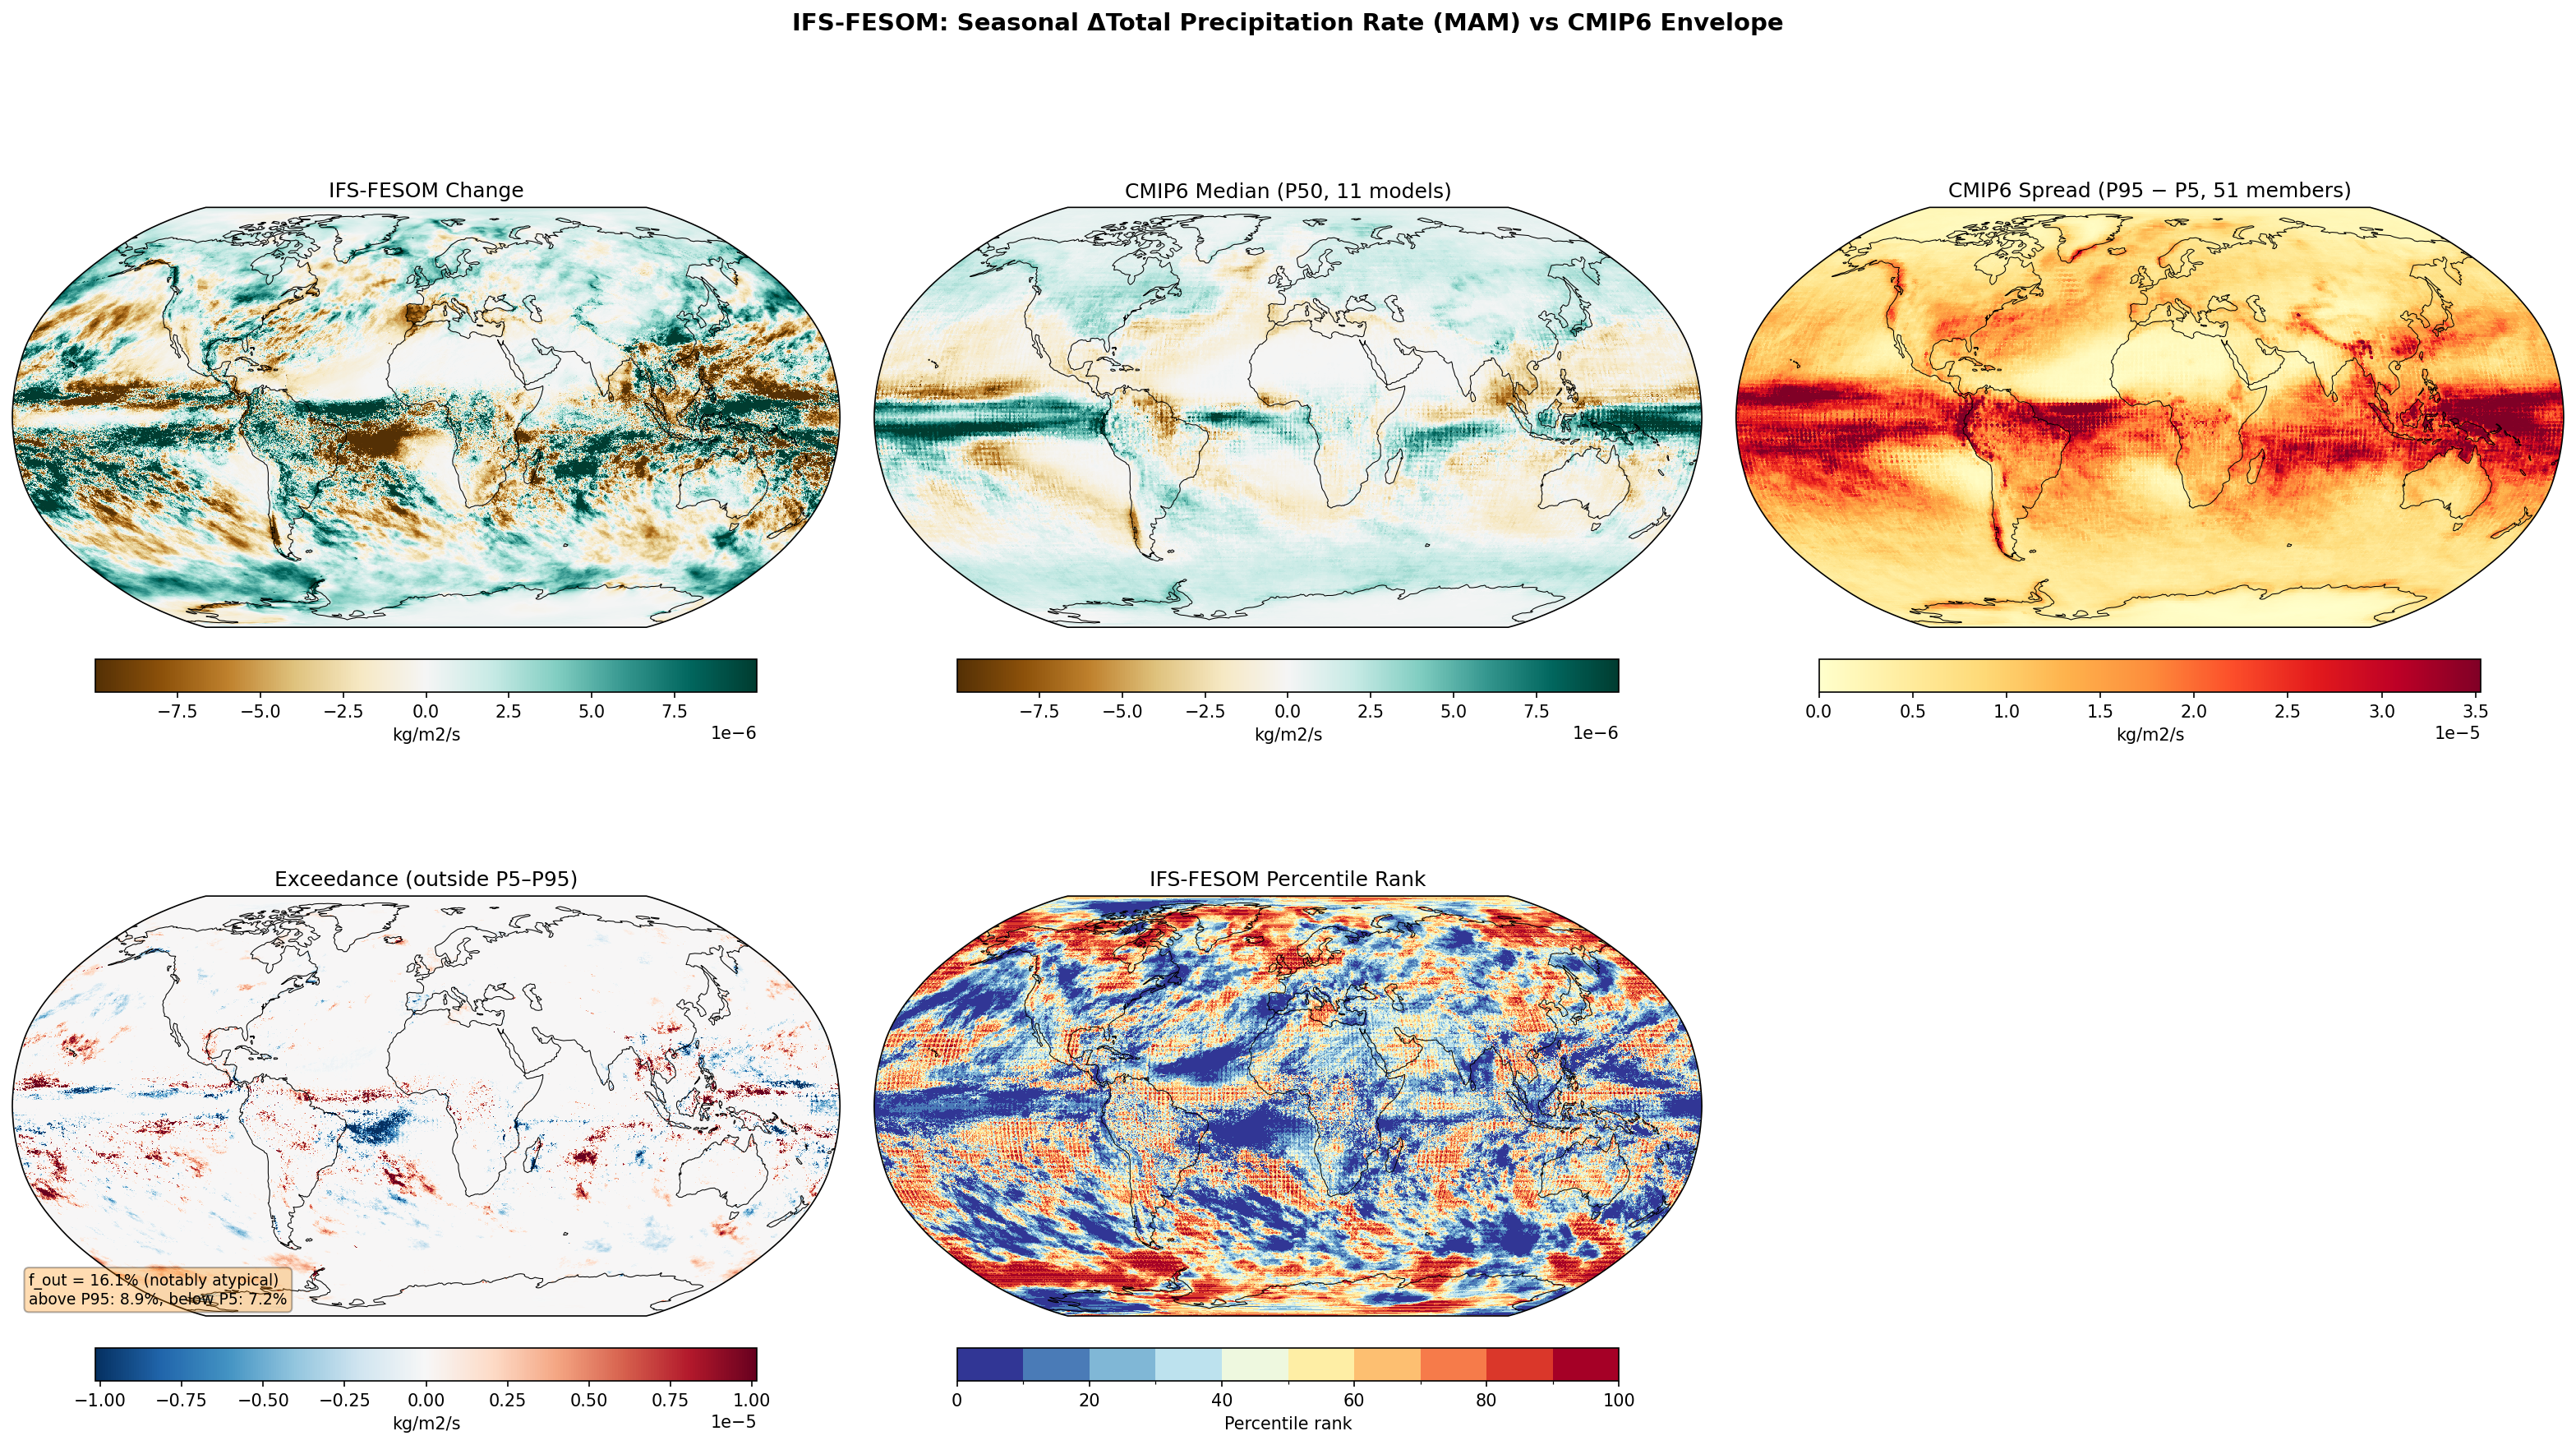
Seasonal Total Precipitation Rate Change — IFS-FESOM (MAM) f_out 16.1%
Envelope Metrics
| f_out (outside P5–P95) | 16.1% notably atypical |
|---|---|
| Above P95 | 8.9% |
| Below P5 | 7.2% |
| CMIP6 ensemble | 11 models, 51 members |
| Variables | avg_tprate |
|---|---|
| Models | ifs-fesom |
| Units | kg/m2/s |
| Baseline | 1990-2014 |
| Future | 2040-2049 |
| Method | Per-season future mean minus historical mean. Compared to CMIP6 percentile envelope (P5, P50, P95). |
Summary high
For the MAM season, IFS-FESOM projects a precipitation response that is notably atypical ($f_{out}=16.1\%$) compared to CMIP6, characterized by significantly stronger wetting in the Southern Ocean and sharper, more localized shifts in tropical convergence zones.
Key Findings
- The area-weighted fraction of grid points outside the CMIP6 envelope is 16.1%, classified as notably atypical, with exceedances fairly balanced between above P95 (8.9%) and below P5 (7.2%).
- A prominent band of 'above P95' exceedance is observed over the Southern Ocean (40°S–60°S), where IFS-FESOM projects larger precipitation increases than the CMIP6 ensemble.
- In the tropical Atlantic, IFS-FESOM exhibits a sharper dipole response (wetting north/drying south) than the CMIP6 median, leading to regions falling below the P5 threshold in the southern tropical Atlantic.
- Tropical Pacific precipitation changes show fine-scale structures with alternating wet and dry bands that exceed CMIP6 spreads, likely due to better-resolved convective dynamics.
Spatial Patterns
The global pattern follows the general thermodynamic 'wet-get-wetter' expectation but with higher spatial frequency. The Southern Ocean features a broad zonal band of excessive wetting relative to CMIP6. The tropics display sharp inter-hemispheric gradients, particularly in the Atlantic and Indian Oceans. Over land, signals are generally noisier, though strong drying signals are noted in the Amazon and parts of southern Africa.
Model Agreement
IFS-FESOM agrees with the broad CMIP6 consensus on high-latitude wetting and subtropical drying. However, it disagrees on the magnitude of the Southern Ocean response (consistently stronger) and the spatial precision of the ITCZ shifts (sharper gradients). The model falls within the CMIP6 envelope over much of the mid-latitude land masses (e.g., North America, Eurasia).
Physical Interpretation
The high resolution of IFS-FESOM likely resolves narrow convective bands and orographic precipitation features smoothed out in coarser CMIP6 models, explaining the tropical exceedances. The Southern Ocean excess wetting suggests a higher sensitivity in the model's cloud physics or air-sea interaction parameterizations in this region under warming. The sharpened Atlantic ITCZ response may reflect improved resolution of ocean current gradients and their coupling to the atmosphere.
Caveats
- The 10-year future window (2040-2049) is relatively short, meaning internal variability (e.g., ENSO phasing) may influence the mean state compared to the longer CMIP6 baselines.
- Exceedance in precipitation fields can be driven by spatial shifts of narrow features (double penalty effect) rather than purely magnitude differences.
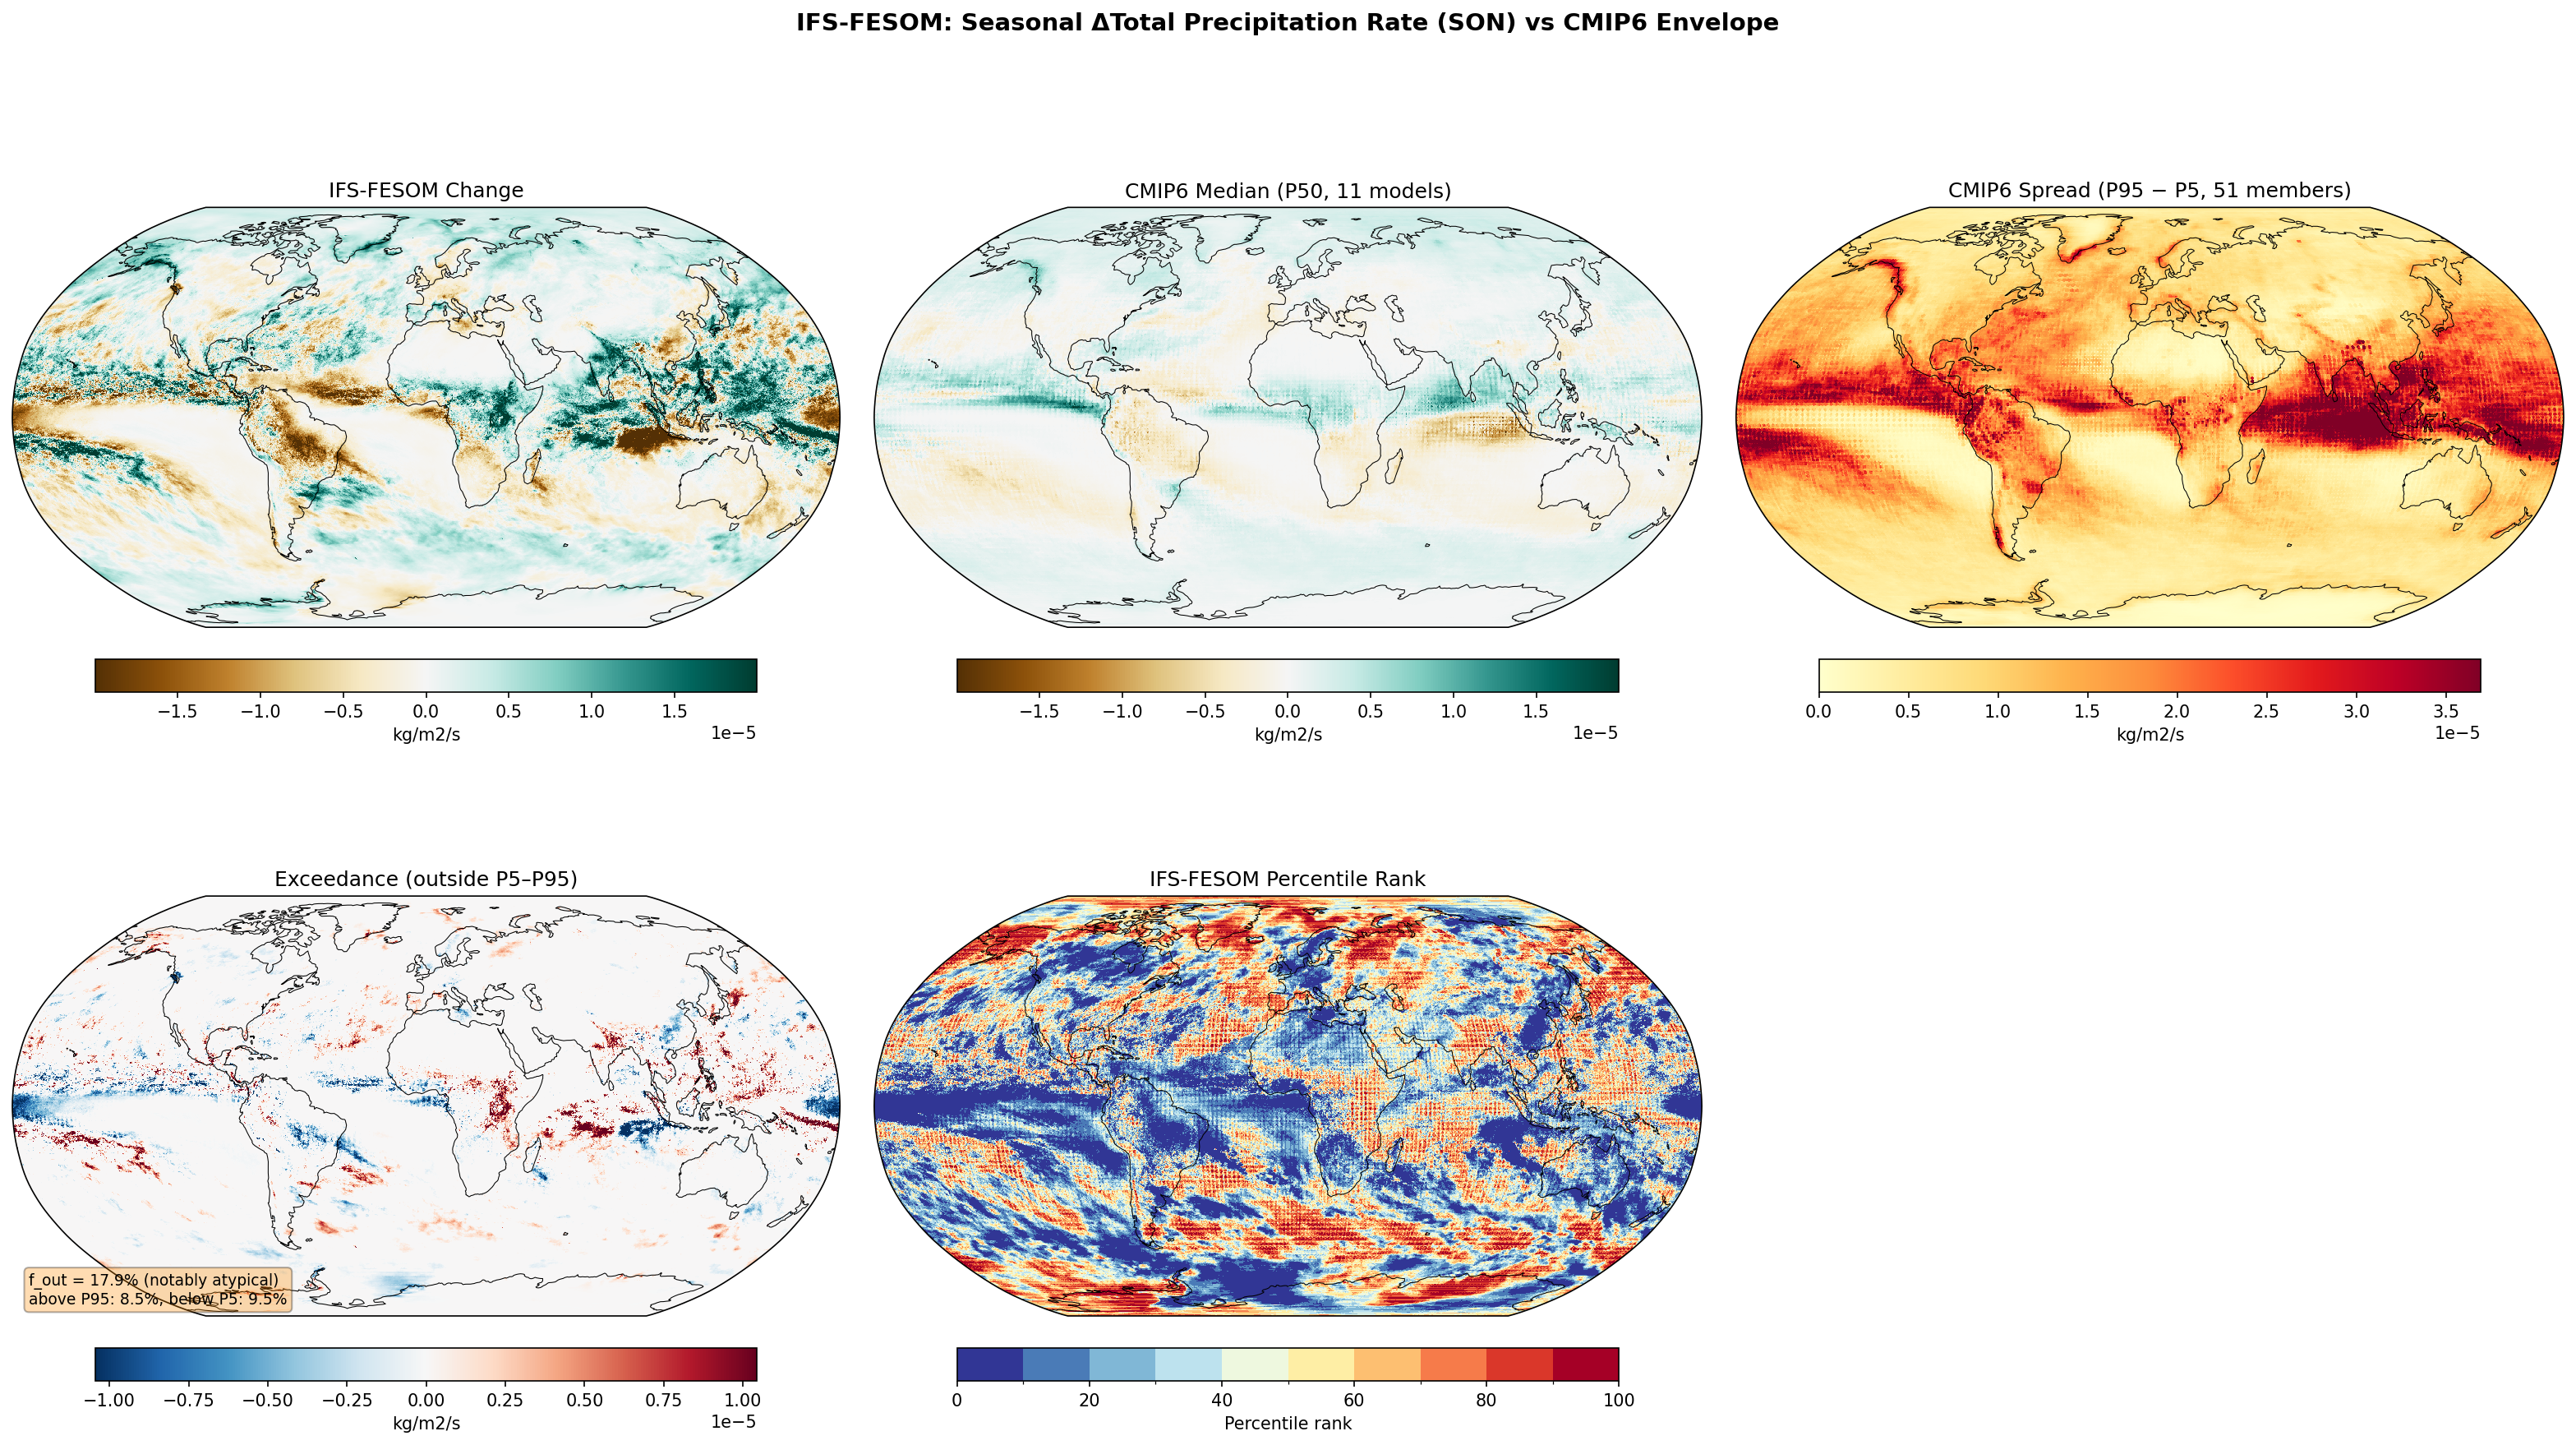
Seasonal Total Precipitation Rate Change — IFS-FESOM (SON) f_out 17.9%
Envelope Metrics
| f_out (outside P5–P95) | 17.9% notably atypical |
|---|---|
| Above P95 | 8.5% |
| Below P5 | 9.5% |
| CMIP6 ensemble | 11 models, 51 members |
| Variables | avg_tprate |
|---|---|
| Models | ifs-fesom |
| Units | kg/m2/s |
| Baseline | 1990-2014 |
| Future | 2040-2049 |
| Method | Per-season future mean minus historical mean. Compared to CMIP6 percentile envelope (P5, P50, P95). |
Summary medium
IFS-FESOM projects seasonal (SON) precipitation changes that are notably atypical (f_out = 17.9%) relative to the CMIP6 ensemble, driven primarily by sharper and more intense convective features in the tropics. The model shows distinct structural shifts in the ITCZ and SPCZ that fall outside the P5–P95 range of the coarser CMIP6 models.
Key Findings
- The area fraction outside the CMIP6 envelope is 17.9% (notably atypical), with deviations split between wetter (8.5%) and drier (9.5%) anomalies.
- The tropical Pacific exhibits alternating bands of exceedance (both above P95 and below P5), suggesting a meridional shift or sharpening of the ITCZ/SPCZ distinct from the broader CMIP6 response.
- Strong wetting in the Western Indian Ocean and drying over the Maritime Continent resemble an El Niño-like or positive IOD-like pattern, contributing significantly to the exceedance.
- IFS-FESOM simulates strong drying over the Amazon and Southern Africa, consistent in sign with CMIP6 but varying in local intensity.
Spatial Patterns
The most prominent patterns are in the deep tropics. The Tropical Pacific shows a complex 'double-ITCZ' type change structure with intense wetting bands flanked by drying. The Indian Ocean shows a dipole-like pattern (wet West/dry East). High latitudes generally show wetting, while subtropical drying zones (e.g., Mediterranean, SE Atlantic) are evident.
Model Agreement
IFS-FESOM largely agrees with the CMIP6 envelope in the extratropics (e.g., North Atlantic wetting, Southern Ocean features) and subtropical drying zones where the exceedance map is mostly white. Disagreement is concentrated in the convective tropics (ITCZ, SPCZ, Indian Ocean), where IFS-FESOM produces spatially finer and higher-magnitude anomalies.
Physical Interpretation
The 5 km resolution allows for better-resolved convective dynamics, leading to sharper precipitation gradients and more intense local anomalies than parameterized coarse-resolution models. The strong zonal dipole in the Indo-Pacific suggests a potential influence of internal variability (e.g., a decadal preference for El Niño-like conditions) in the short 2040–2049 window, or a distinct structural response of the Walker circulation in the high-resolution model.
Caveats
- The short 10-year analysis period (2040–2049) makes precipitation changes highly susceptible to internal variability (e.g., ENSO phasing), which may exaggerate differences against the multi-decadal/multi-member CMIP6 mean.
- Precipitation is inherently noisy; high exceedance in the tropics is expected when comparing high-resolution localized convection against coarse-resolution ensemble statistics.
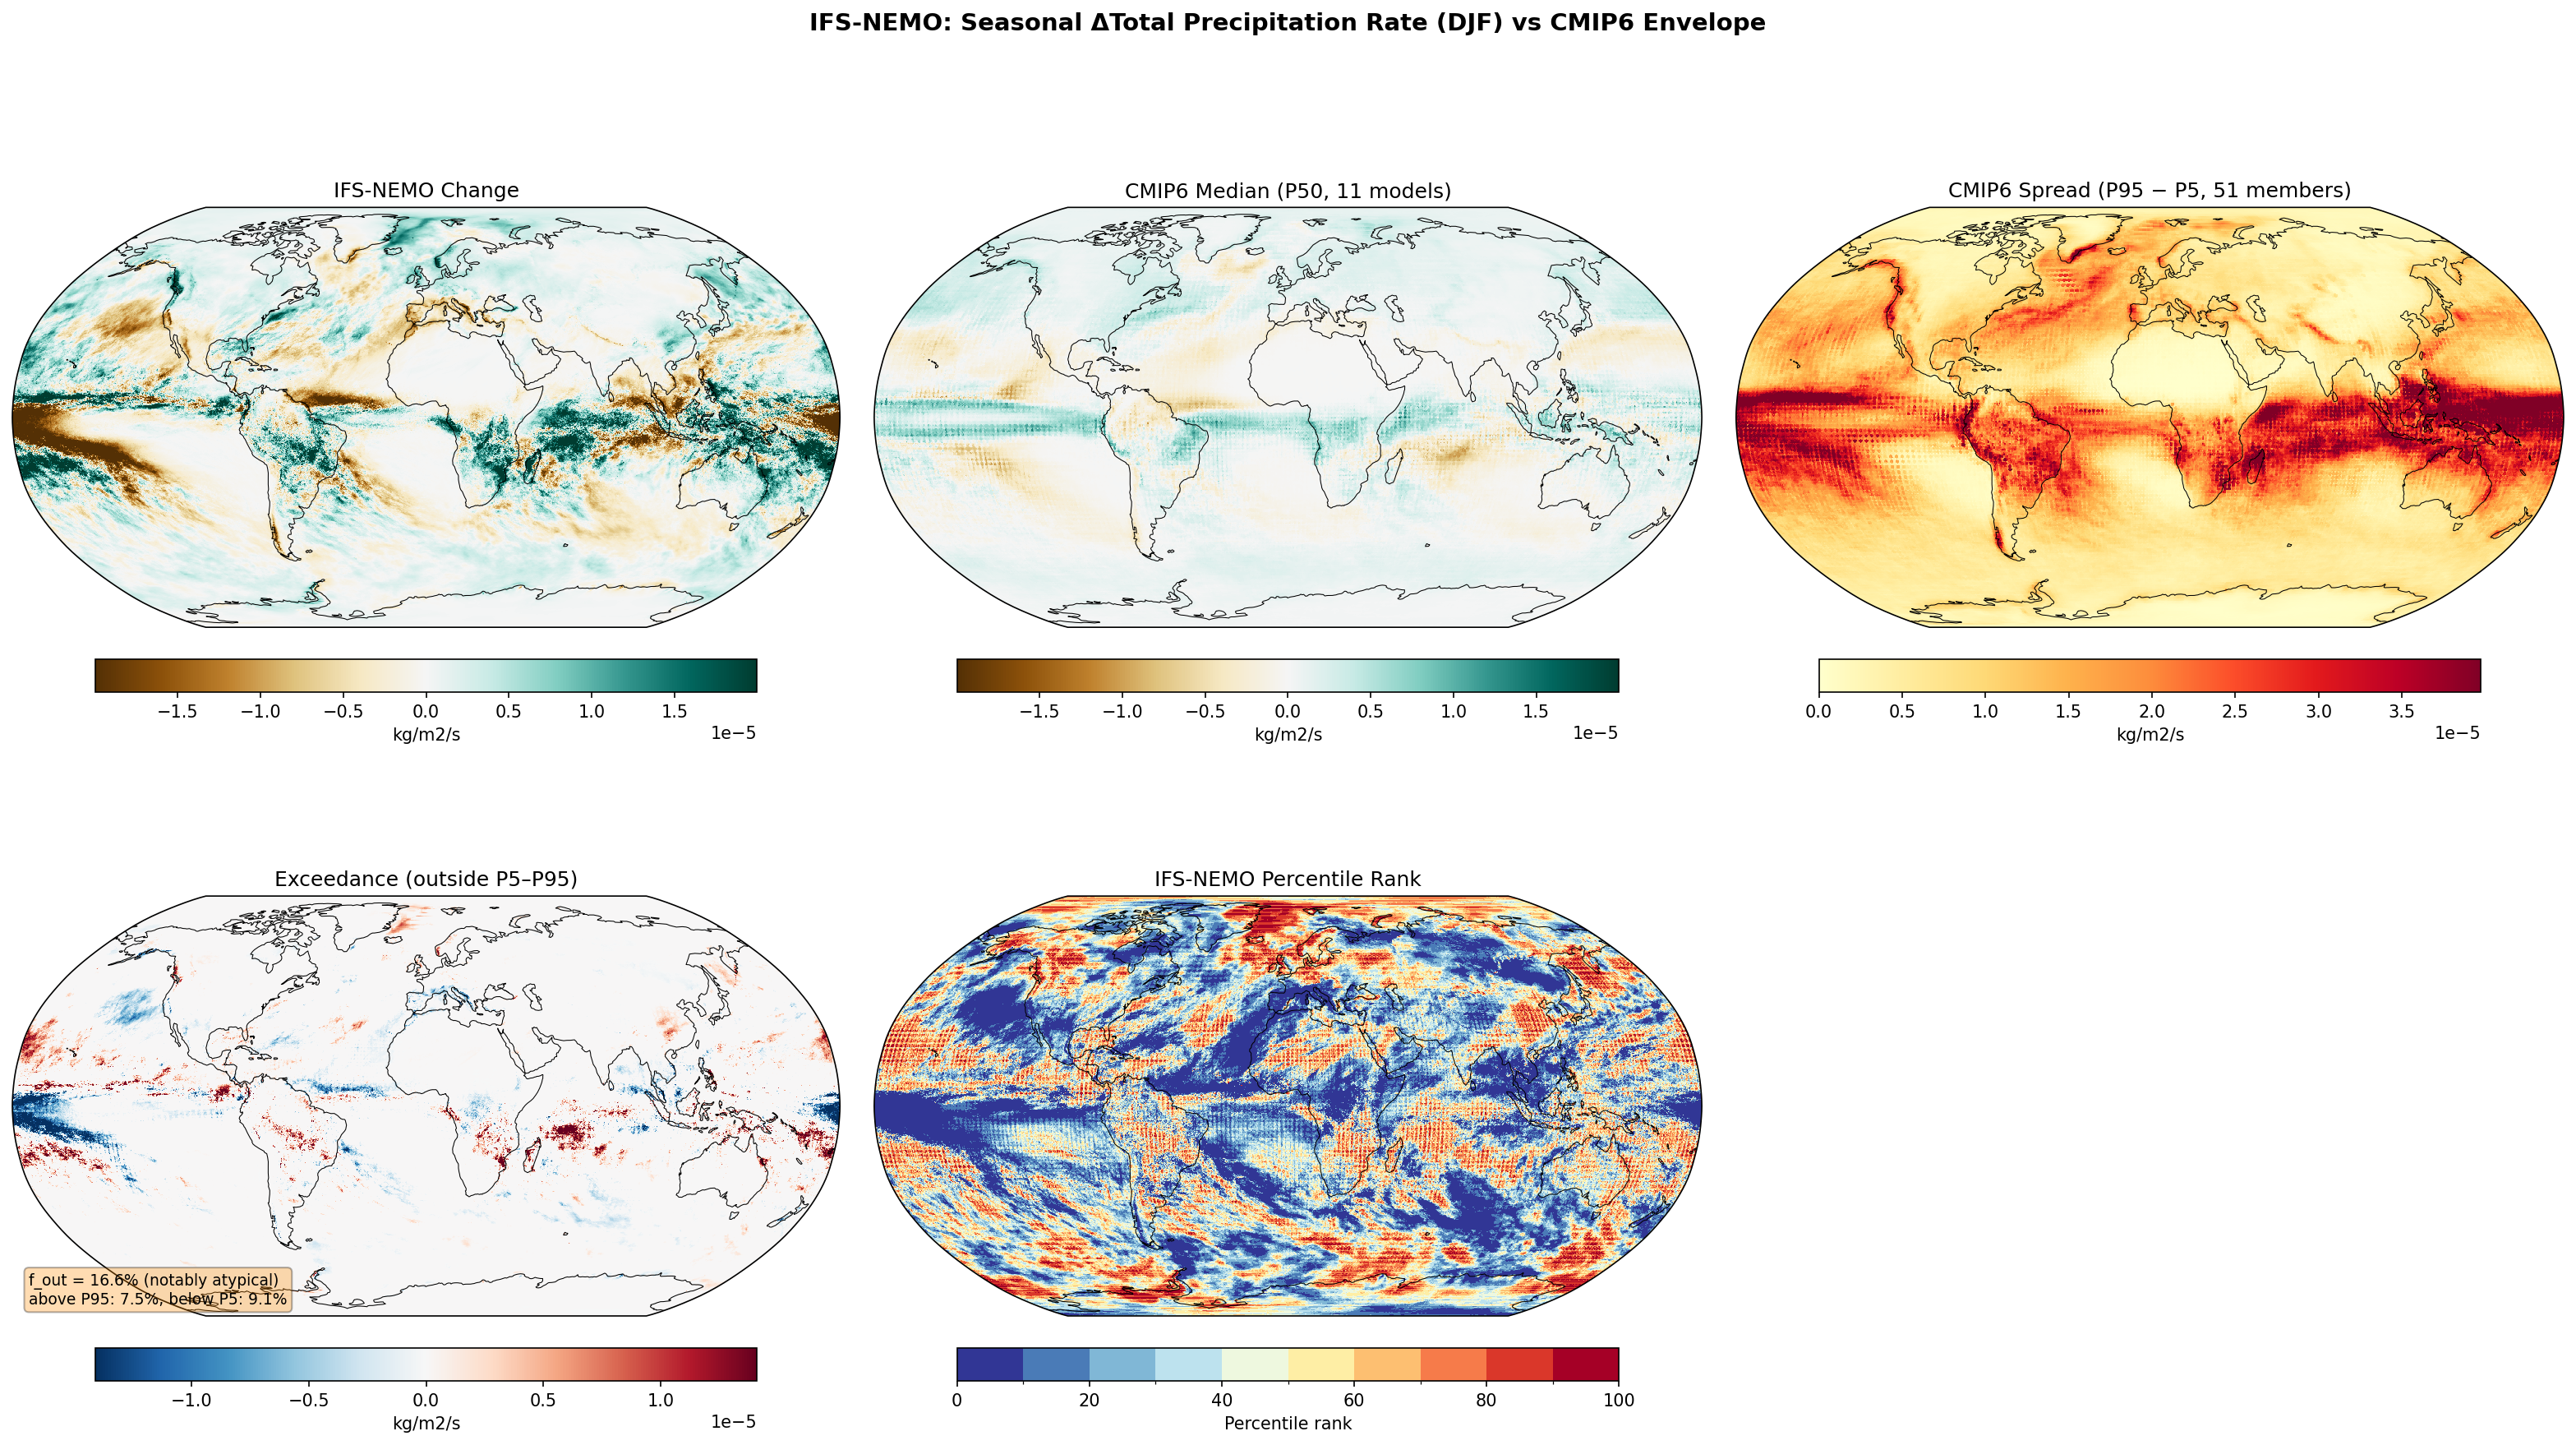
Seasonal Total Precipitation Rate Change — IFS-NEMO (DJF) f_out 16.6%
Envelope Metrics
| f_out (outside P5–P95) | 16.6% notably atypical |
|---|---|
| Above P95 | 7.5% |
| Below P5 | 9.1% |
| CMIP6 ensemble | 11 models, 51 members |
| Variables | avg_tprate |
|---|---|
| Models | ifs-nemo |
| Units | kg/m2/s |
| Baseline | 1990-2014 |
| Future | 2040-2049 |
| Method | Per-season future mean minus historical mean. Compared to CMIP6 percentile envelope (P5, P50, P95). |
Summary high
IFS-NEMO projects a notably atypical (f_out = 16.6%) precipitation response for DJF 2040-2049 compared to the CMIP6 envelope, dominated by a strong La Niña-like dipole in the tropical Pacific. While high-latitude wetting and Mediterranean drying patterns align with broad consensus, the model's distinct drying signal in the central equatorial Pacific contrasts sharply with the CMIP6 median's wetting tendency.
Key Findings
- IFS-NEMO exhibits a strong 'La Niña-like' change pattern: intense drying in the central/eastern equatorial Pacific and strong wetting over the Maritime Continent.
- The model shows significant exceedance (blue regions, below P5) in the central Pacific, indicating a drying response stronger than 95% of the CMIP6 ensemble.
- Amazonian drying is pronounced and spatially coherent, often falling below the CMIP6 P5 threshold.
- Changes in the North Atlantic storm track show wetting consistent with, but sharper than, the CMIP6 median.
Spatial Patterns
The dominant feature is a zonal dipole in the tropics: wetting in the Indo-Pacific warm pool (up to +1.5e-5 kg/m²/s) and drying in the central-to-eastern Pacific (down to -1.5e-5 kg/m²/s). Notable drying also occurs over the Amazon, Southern Africa, and the Mediterranean. Wetting bands are evident in the mid-to-high latitude storm tracks of both hemispheres.
Model Agreement
Disagreement is concentrated in the tropical Pacific. The CMIP6 median shows a 'warmer-get-wetter' / El Niño-like response along the equator, whereas IFS-NEMO shows strong dynamic drying (below P5). There is better qualitative agreement in the extratropics (e.g., North Atlantic wetting, Mediterranean drying), though IFS-NEMO often lies at the tails of the distribution (Percentile Rank near 0 or 100) due to sharper gradients.
Physical Interpretation
The pattern suggests a strengthening of the Walker Circulation or a negative phase of the Interdecadal Pacific Oscillation (IPO) within the simulation period, contrasting with the 'weakening Walker' consensus in coarser models. The localized exceedance may also reflect the high-resolution model's ability to resolve mesoscale convective organization and orographic interaction (e.g., Amazon, Maritime Continent) differently than parameterized CMIP6 physics.
Caveats
- The 10-year averaging period (2040-2049) is short; the strong La Niña-like signal may result from internal decadal variability (e.g., ENSO/PDO phasing) rather than a forced climate response.
- Comparing a single realization against a large ensemble naturally inflates exceedance due to unsuppressed internal variability in the single model.
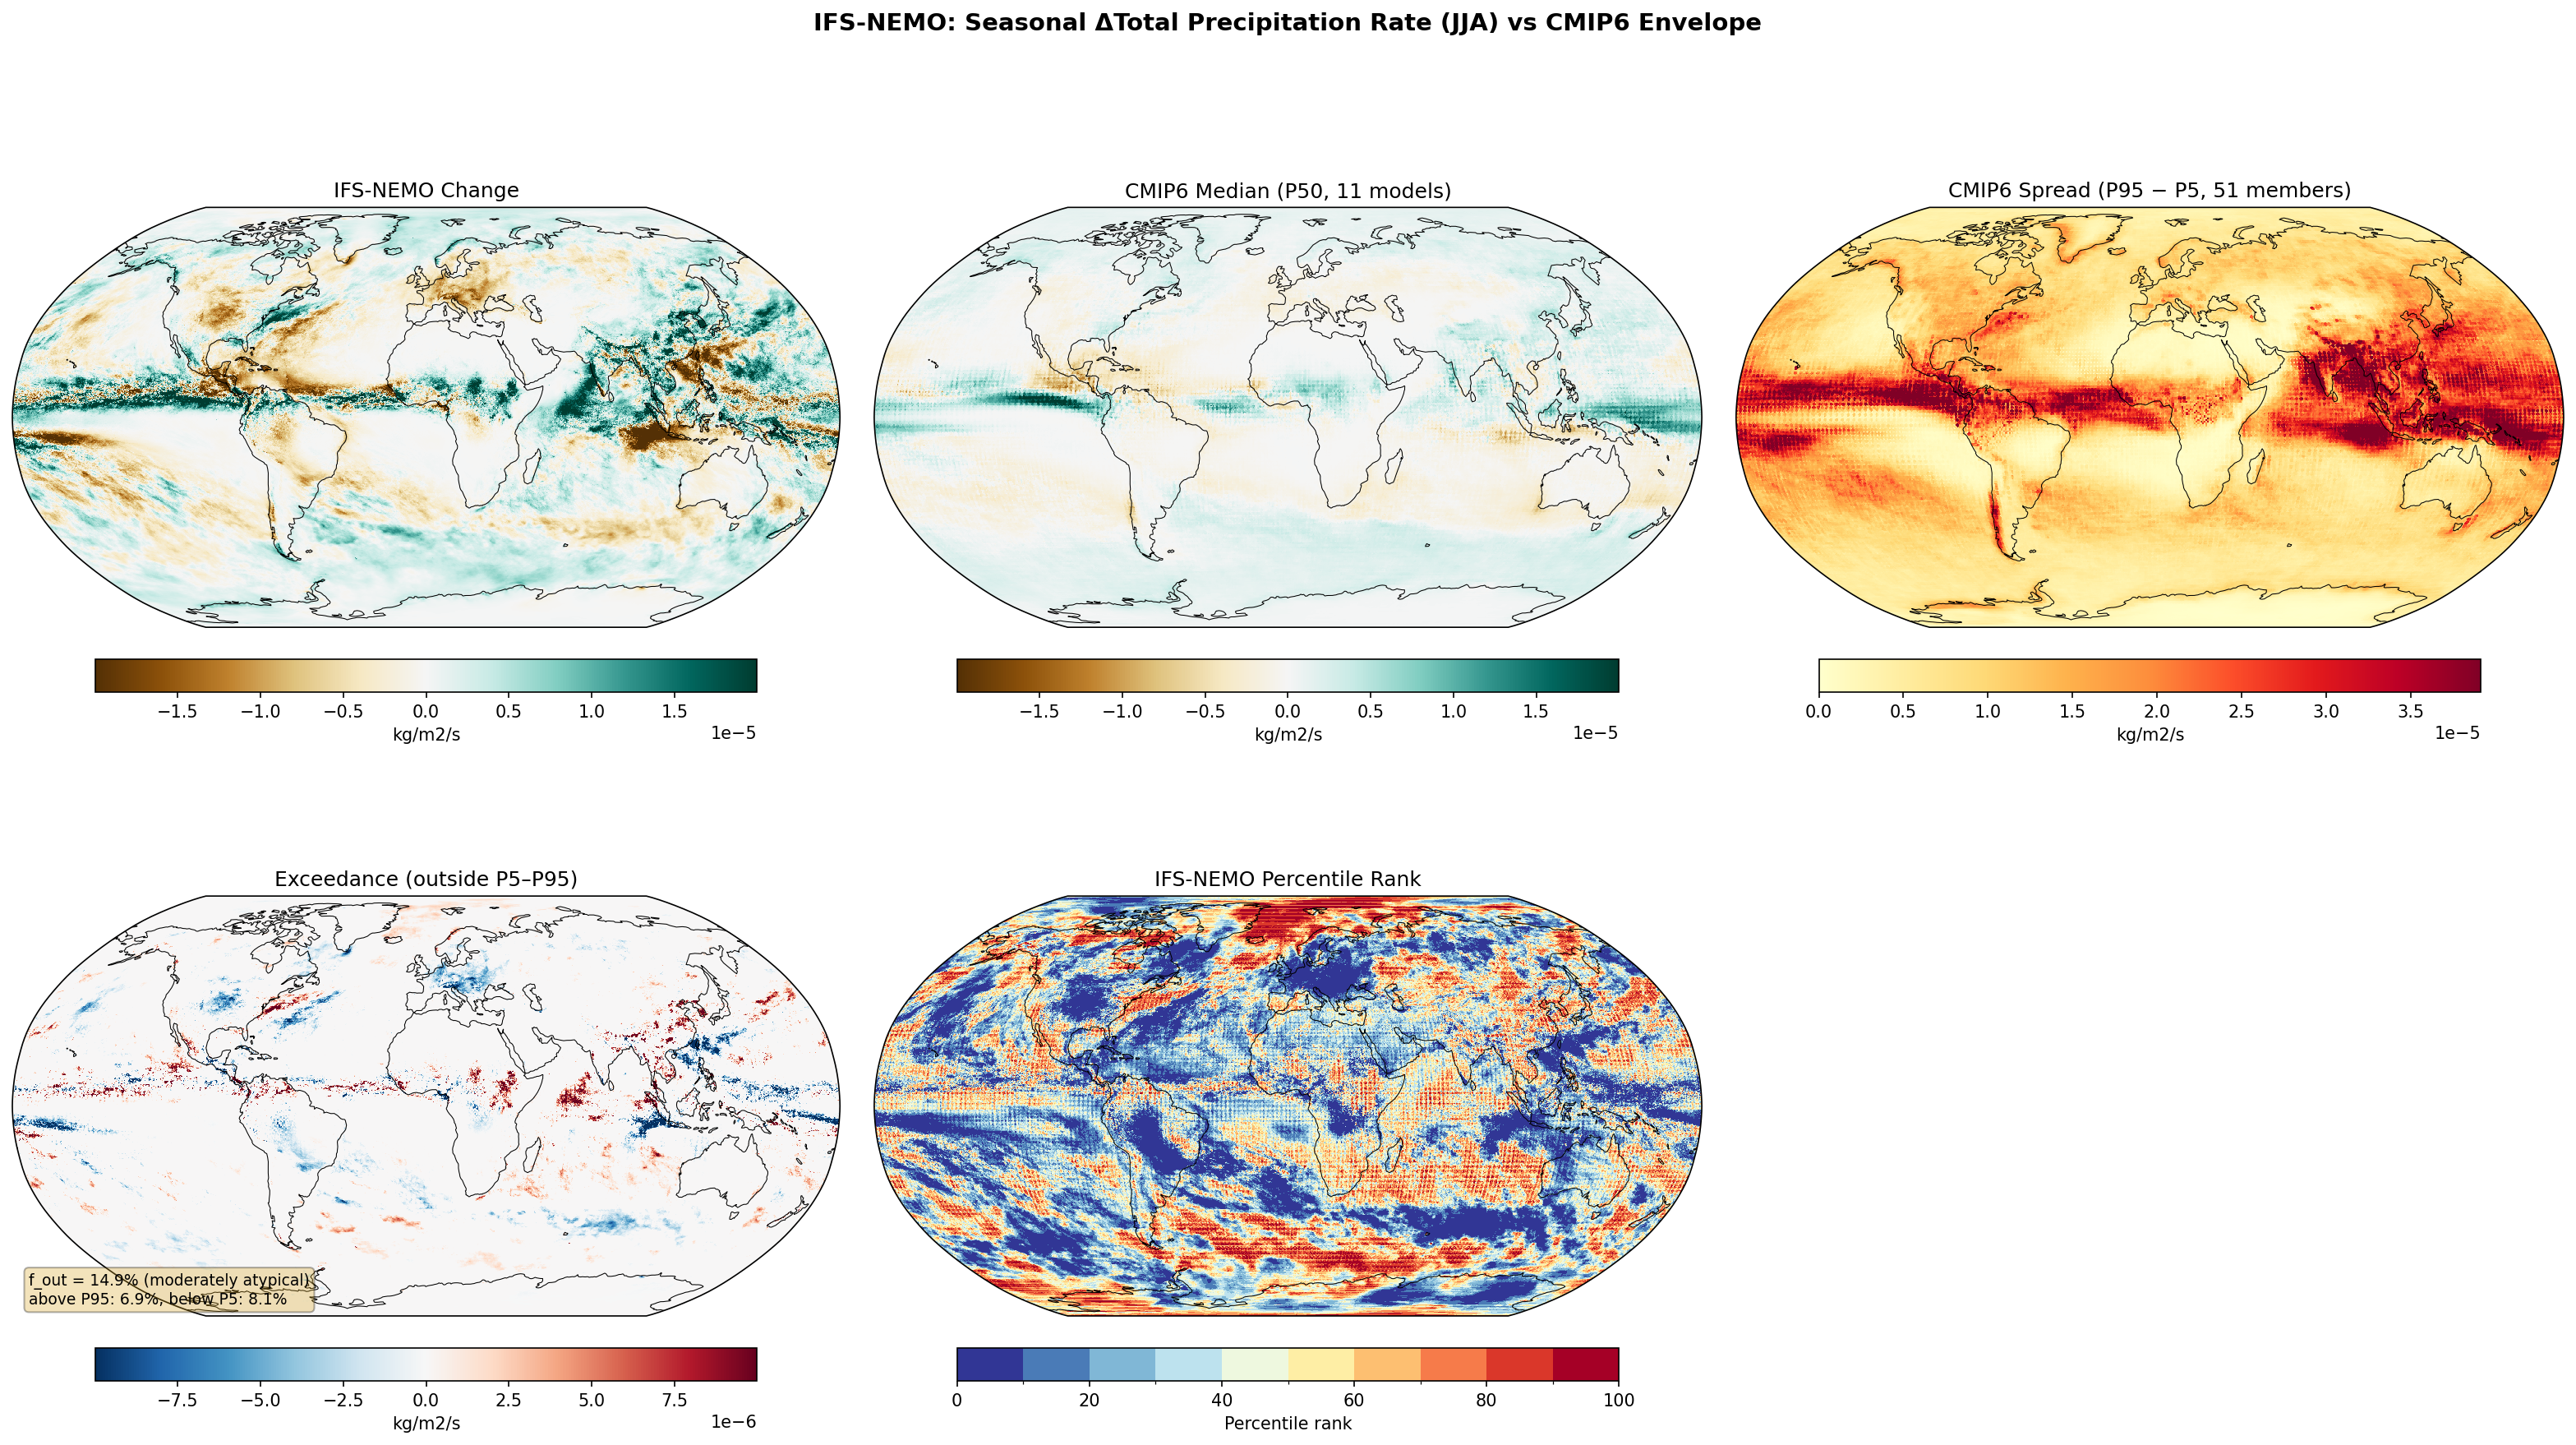
Seasonal Total Precipitation Rate Change — IFS-NEMO (JJA) f_out 14.9%
Envelope Metrics
| f_out (outside P5–P95) | 14.9% moderately atypical |
|---|---|
| Above P95 | 6.9% |
| Below P5 | 8.1% |
| CMIP6 ensemble | 11 models, 51 members |
| Variables | avg_tprate |
|---|---|
| Models | ifs-nemo |
| Units | kg/m2/s |
| Baseline | 1990-2014 |
| Future | 2040-2049 |
| Method | Per-season future mean minus historical mean. Compared to CMIP6 percentile envelope (P5, P50, P95). |
Summary high
IFS-NEMO projects seasonal JJA precipitation changes that generally align with broad CMIP6 patterns but exhibit sharper spatial gradients and stronger regional drying, resulting in a moderately atypical f_out of 14.9%. The model shows intensified drying over the Caribbean, Central America, and parts of the Amazon compared to the CMIP6 ensemble, alongside a more tightly confined ITCZ.
Key Findings
- 14.9% of the global area lies outside the CMIP6 P5–P95 envelope, classifying the result as moderately atypical.
- IFS-NEMO predicts significantly stronger drying (falling below the CMIP6 P5 threshold) in the Caribbean, Central America, and portions of the Amazon basin.
- The Intertropical Convergence Zone (ITCZ) shows a 'sharpening' effect, with narrow bands of exceedance (both wet and dry) suggesting a more spatially confined convective zone than the coarser CMIP6 mean.
- Complex exceedance patterns over the South Asian monsoon region likely reflect improved topographic resolution compared to standard CMIP6 models.
Spatial Patterns
The dominant signal is a tropical dipole with wetting along the ITCZ and drying in the subtropics. IFS-NEMO shows intense drying anomalies (< -1.5e-5 kg/m2/s) in Central America and the Amazon. In the tropical Pacific, alternating bands of blue (below P5) and red (above P95) exceedance indicate a meridional shift or narrowing of the rain belt relative to the CMIP6 ensemble. The North Atlantic exhibits a broad region of precipitation reduction exceeding the CMIP6 lower bound.
Model Agreement
IFS-NEMO agrees with the CMIP6 median on the sign of change in major regions like the Mediterranean (drying) and the core ITCZ (wetting). Disagreement is primarily in magnitude and spatial precision; IFS-NEMO is notably drier than the CMIP6 P5 boundary in the Caribbean/Central American region and parts of the Maritime Continent, suggesting a more sensitive hydrological response in these areas.
Physical Interpretation
The exceedance patterns likely stem from higher horizontal resolution (~5-10 km vs ~100 km for CMIP6). This allows for: (1) sharper resolution of convective rain bands (ITCZ); (2) stronger land-atmosphere coupling or resolution of topography affecting the Central American and Asian Monsoon hydroclimates; and (3) potentially distinct dynamical shifts in the North Atlantic storm track or subtropical highs leading to the observed Atlantic drying.
Caveats
- Precipitation is highly noisy; small spatial shifts in narrow features (like the ITCZ) can generate large local exceedance values without implying fundamental physical disagreement.
- Single-member realization vs. multi-model ensemble means internal variability contributes to the spread, particularly in the Southern Ocean.
Seasonal Total Precipitation Rate Change — IFS-NEMO (MAM) f_out 15.8%
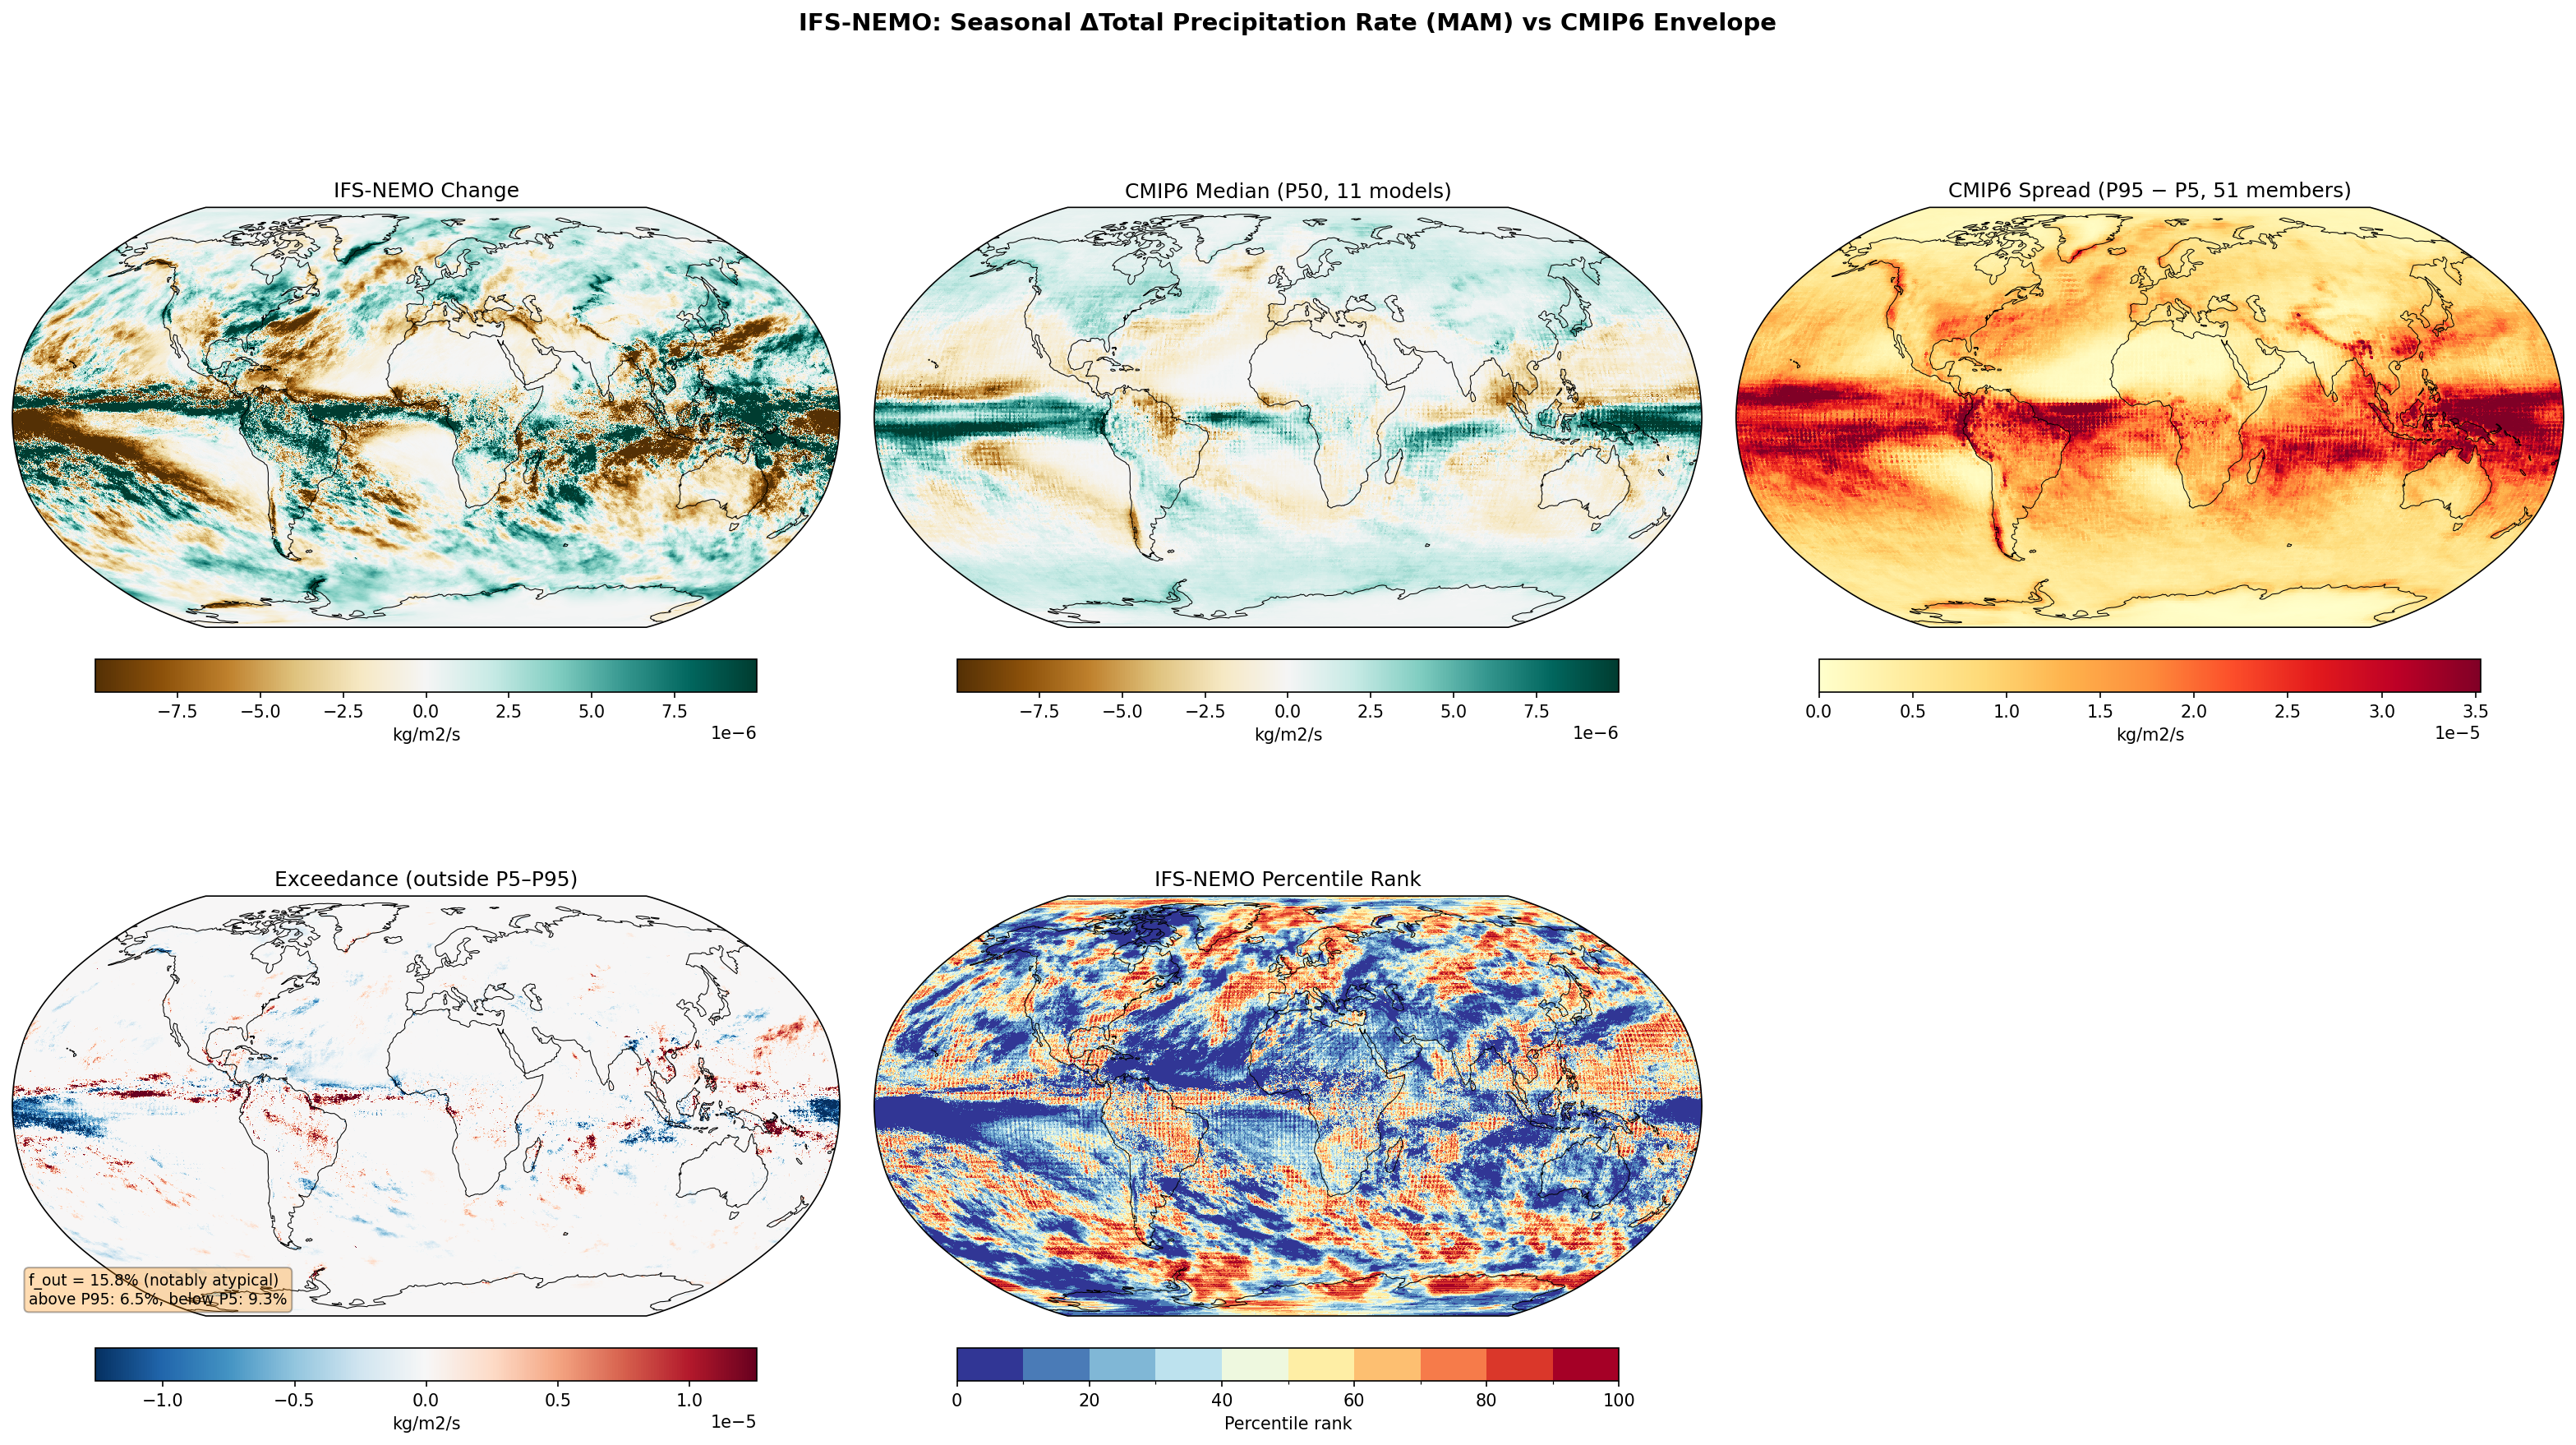
Envelope Metrics
| f_out (outside P5–P95) | 15.8% notably atypical |
|---|---|
| Above P95 | 6.5% |
| Below P5 | 9.3% |
| CMIP6 ensemble | 11 models, 51 members |
| Variables | avg_tprate |
|---|---|
| Models | ifs-nemo |
| Units | kg/m2/s |
| Baseline | 1990-2014 |
| Future | 2040-2049 |
| Method | Per-season future mean minus historical mean. Compared to CMIP6 percentile envelope (P5, P50, P95). |
Summary medium
IFS-NEMO projects a sharpened hydrological response in MAM (2040-2049) with 15.8% of the global area showing precipitation changes outside the CMIP6 P5–P95 envelope, classified as 'notably atypical'. The divergence is primarily driven by intensified tropical convective shifts and strong drying over the Amazon.
Key Findings
- IFS-NEMO simulates a much sharper intensification and narrowing of the ITCZ in the Pacific compared to the CMIP6 median, resulting in bands of wetting (above P95) and drying (below P5) that exceed ensemble limits.
- A pronounced drying signal is observed over the Amazon basin and tropical Atlantic, falling below the CMIP6 5th percentile, indicating a more severe reduction in wet-season precipitation than typical CMIP6 models.
- The Indian Ocean and Maritime Continent exhibit complex, high-magnitude dipole changes that are spatially distinct from the smoother CMIP6 response.
Spatial Patterns
The dominant feature is a 'wet-get-wetter, dry-get-drier' pattern with sharper gradients than CMIP6. Specifically: (1) Strong zonal bands of exceedance in the tropical Pacific (intense wetting on the equator, drying on flanks); (2) Coherent regions of exceedance (drying) over Northern South America; (3) Fine-scale orographic wetting signals in high latitudes that are locally intense.
Model Agreement
IFS-NEMO agrees with CMIP6 on the broad thermodynamic signal of high-latitude wetting and the general sign of tropical precipitation increases. However, it disagrees significantly on the spatial precision and magnitude of tropical circulation changes, where IFS-NEMO produces more localized and intense extremes.
Physical Interpretation
The high resolution (approx. 5 km) likely allows for more resolved convective distinctness, leading to a narrower, more intense ITCZ and sharper subsidence zones compared to parameterized convection in coarser CMIP6 models. The severe Amazon drying may reflect a stronger sensitivity of the South American Monsoon or Atlantic ITCZ positioning to warming in this model configuration.
Caveats
- Precipitation is highly variable; a 10-year averaging period may retain significant internal variability (e.g., ENSO phasing) that contributes to the high 'exceedance' fraction in the tropics.
- The strong drying over the Amazon should be checked against potential model drift or initialization shock, as land-surface coupling can be sensitive in short high-res runs.
Seasonal Total Precipitation Rate Change — IFS-NEMO (SON) f_out 15.1%
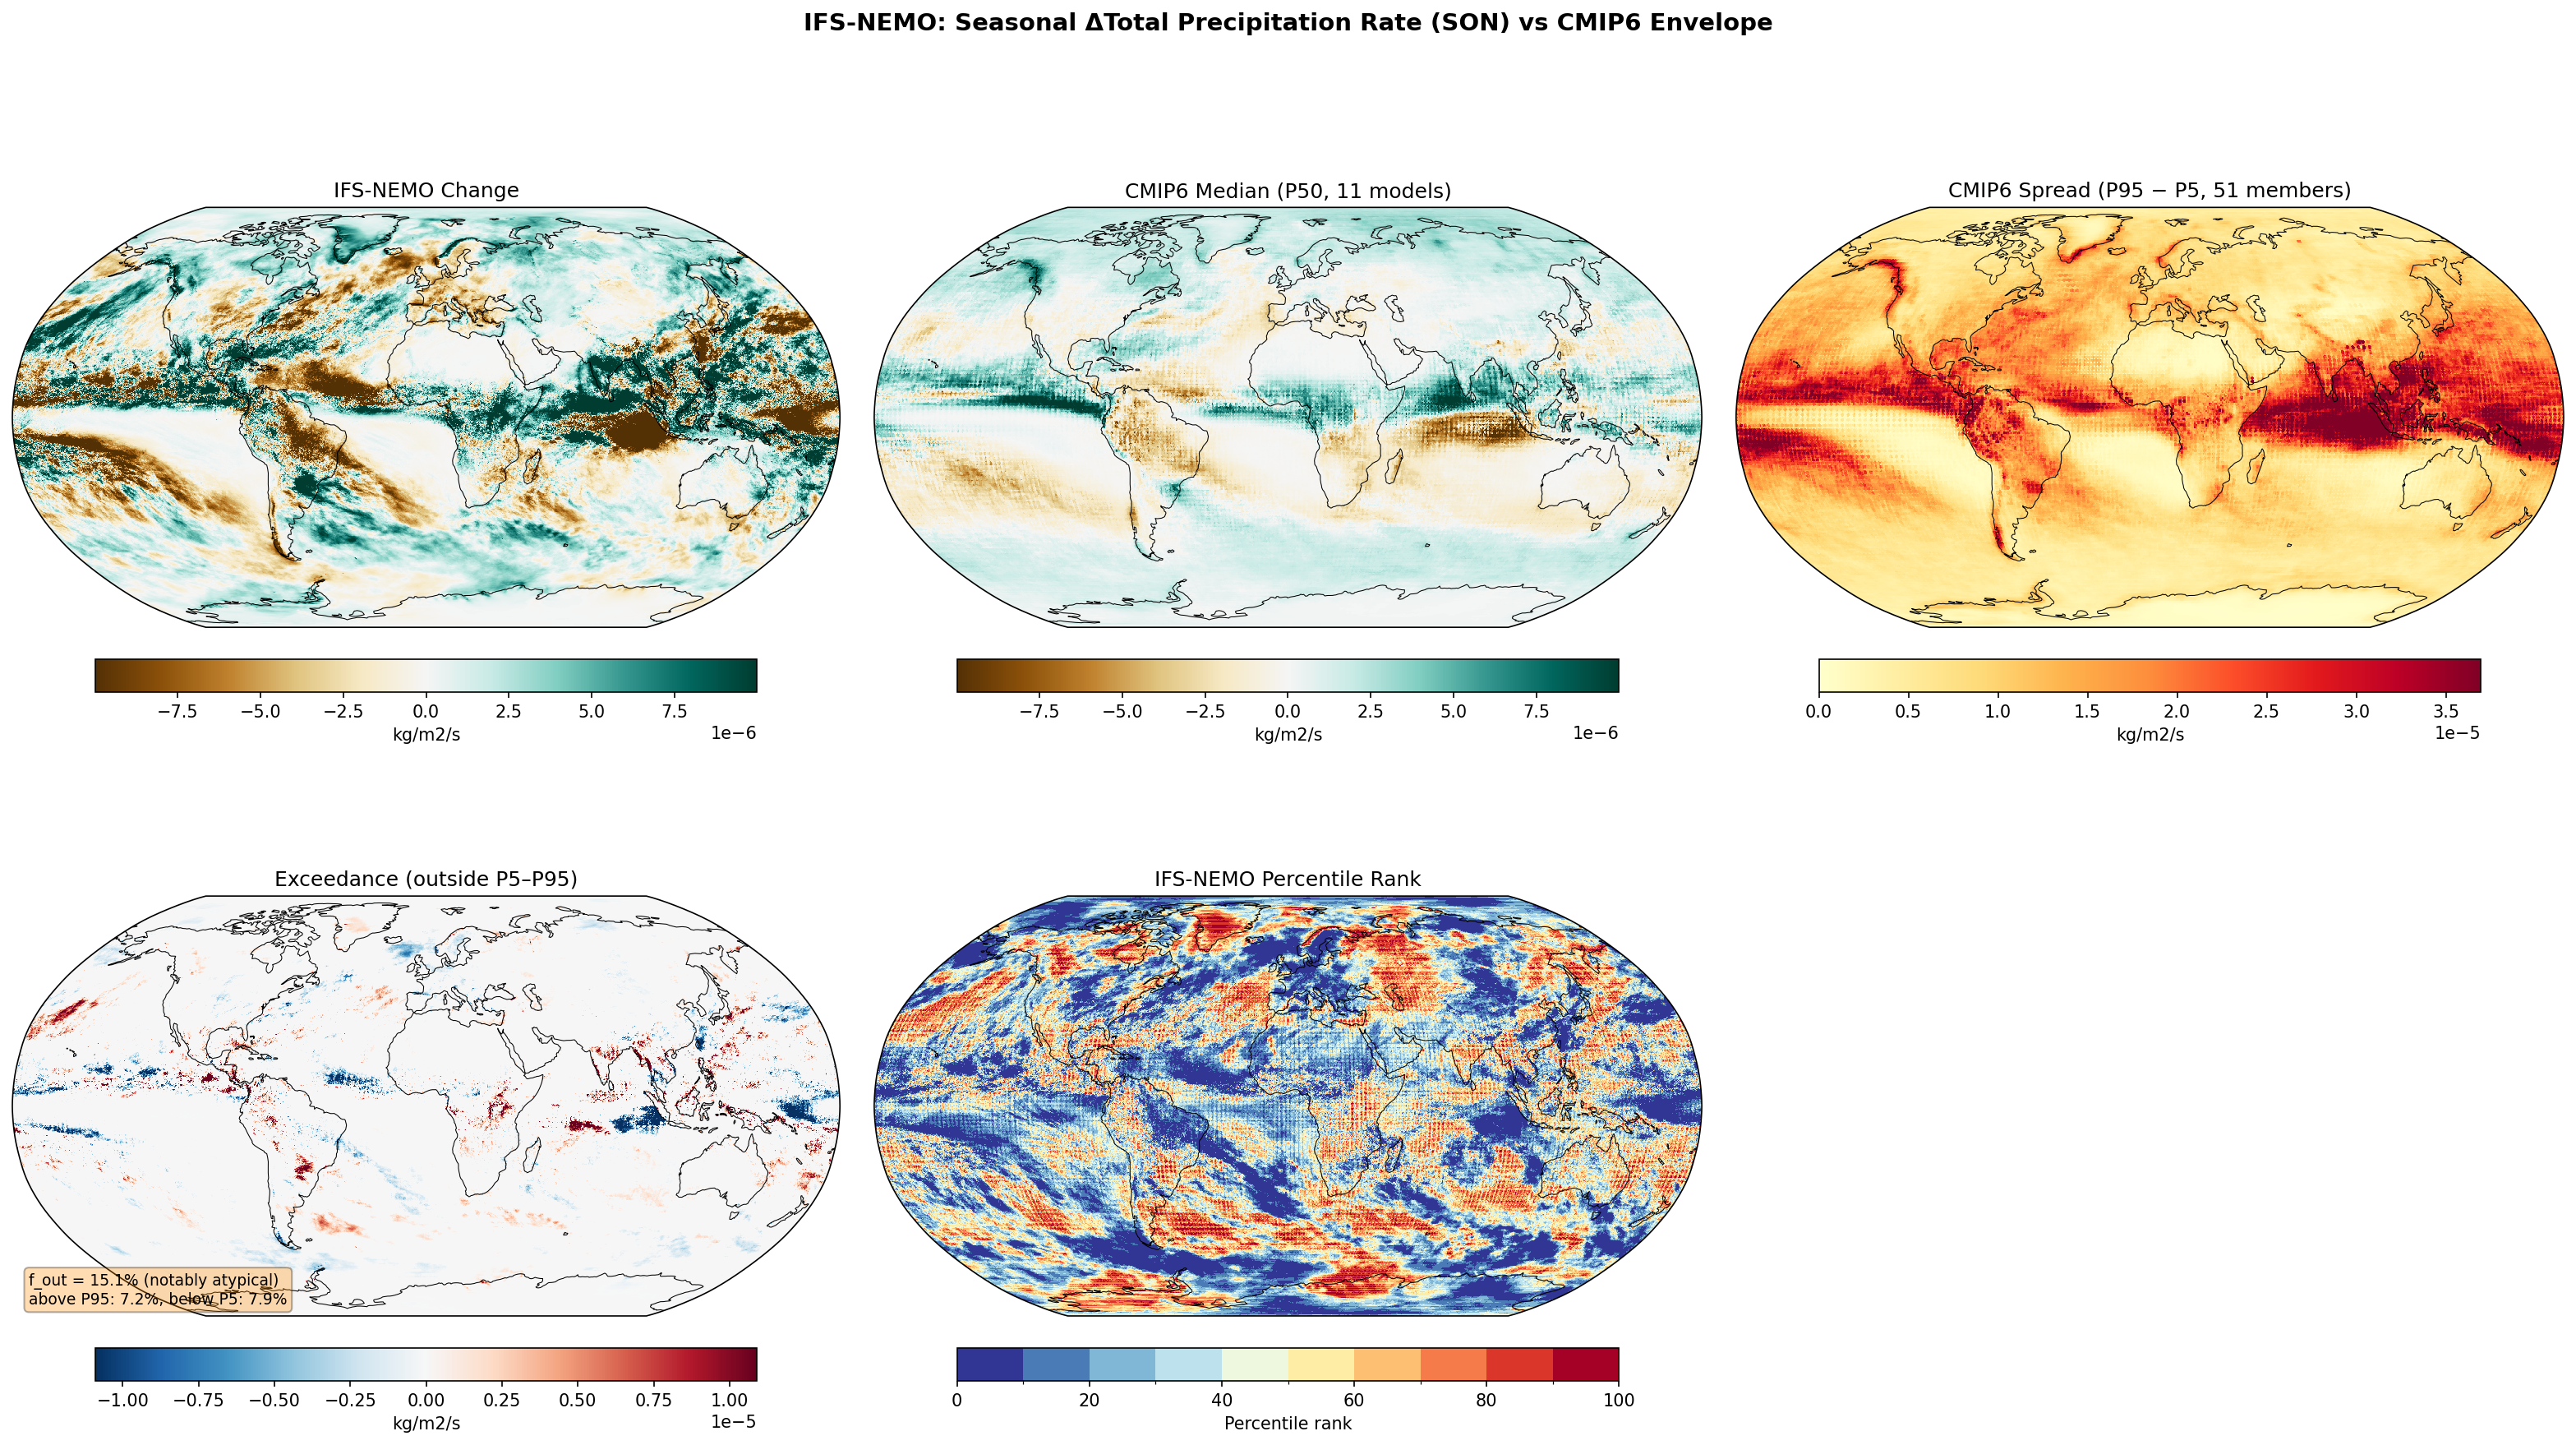
Envelope Metrics
| f_out (outside P5–P95) | 15.1% notably atypical |
|---|---|
| Above P95 | 7.2% |
| Below P5 | 7.9% |
| CMIP6 ensemble | 11 models, 51 members |
| Variables | avg_tprate |
|---|---|
| Models | ifs-nemo |
| Units | kg/m2/s |
| Baseline | 1990-2014 |
| Future | 2040-2049 |
| Method | Per-season future mean minus historical mean. Compared to CMIP6 percentile envelope (P5, P50, P95). |
Summary high
During the SON season, IFS-NEMO projects a precipitation change pattern deemed 'notably atypical' (f_out = 15.1%) relative to CMIP6, characterized by intensified drying over the Maritime Continent and Tropical Atlantic that exceeds the ensemble's lower bounds. While broad-scale features like high-latitude wetting and Mediterranean drying are consistent with the ensemble, IFS-NEMO exhibits sharper dynamical shifts in the tropical overturning circulations.
Key Findings
- IFS-NEMO shows strong drying over the Maritime Continent (Indonesia/Papua New Guinea) that falls significantly below the CMIP6 P5 threshold.
- Wetting in parts of the Indian Ocean and Central Pacific exceeds the CMIP6 P95 percentile, indicating a distinct spatial reorganization of tropical convection.
- There is robust agreement on drying in the Mediterranean and Southern Africa, and wetting at high latitudes, though IFS-NEMO resolves finer orographic gradients.
Spatial Patterns
The projection features a classic 'wet-get-wetter' signal at high latitudes and distinct drying in the subtropics. A prominent feature is the strong, cohesive drying block over the Maritime Continent and the Tropical North Atlantic. Conversely, the Indian Ocean displays a complex pattern of enhanced wetting bands that contrast with the broader CMIP6 spread.
Model Agreement
The model aligns well with CMIP6 on the sign of change in the extratropics (Mediterranean drying, Arctic/Antarctic wetting). The primary disagreement is in the deep tropics: IFS-NEMO is significantly drier than the ensemble over the Maritime Continent and Tropical Atlantic (blue regions in Exceedance map), and wetter in specific oceanic convergence zones (red regions), leading to the 15.1% f_out metric.
Physical Interpretation
The patterns reflect a thermodynamic intensification of the hydrological cycle combined with strong dynamical shifts. The specific drying over the Maritime Continent and wetting in the Central Pacific suggests a weakening of the Walker Circulation or a shift towards an El Niño-like/positive IOD-like mean state in the model's future climatology, shifting convection eastward more aggressively than the CMIP6 median.
Caveats
- The 10-year analysis period (2040-2049) may contain internal decadal variability (e.g., specific ENSO phasing) that creates apparent deviations from the smoothed CMIP6 multi-model mean.
- Grid-scale mismatches between the high-resolution IFS-NEMO and coarser CMIP6 models can inflate exceedance metrics, particularly in regions with sharp precipitation gradients.