Tier 2 Wet Bulb Temperature CMIP6 f_out 16.2%
CMIP6 Envelope Comparison
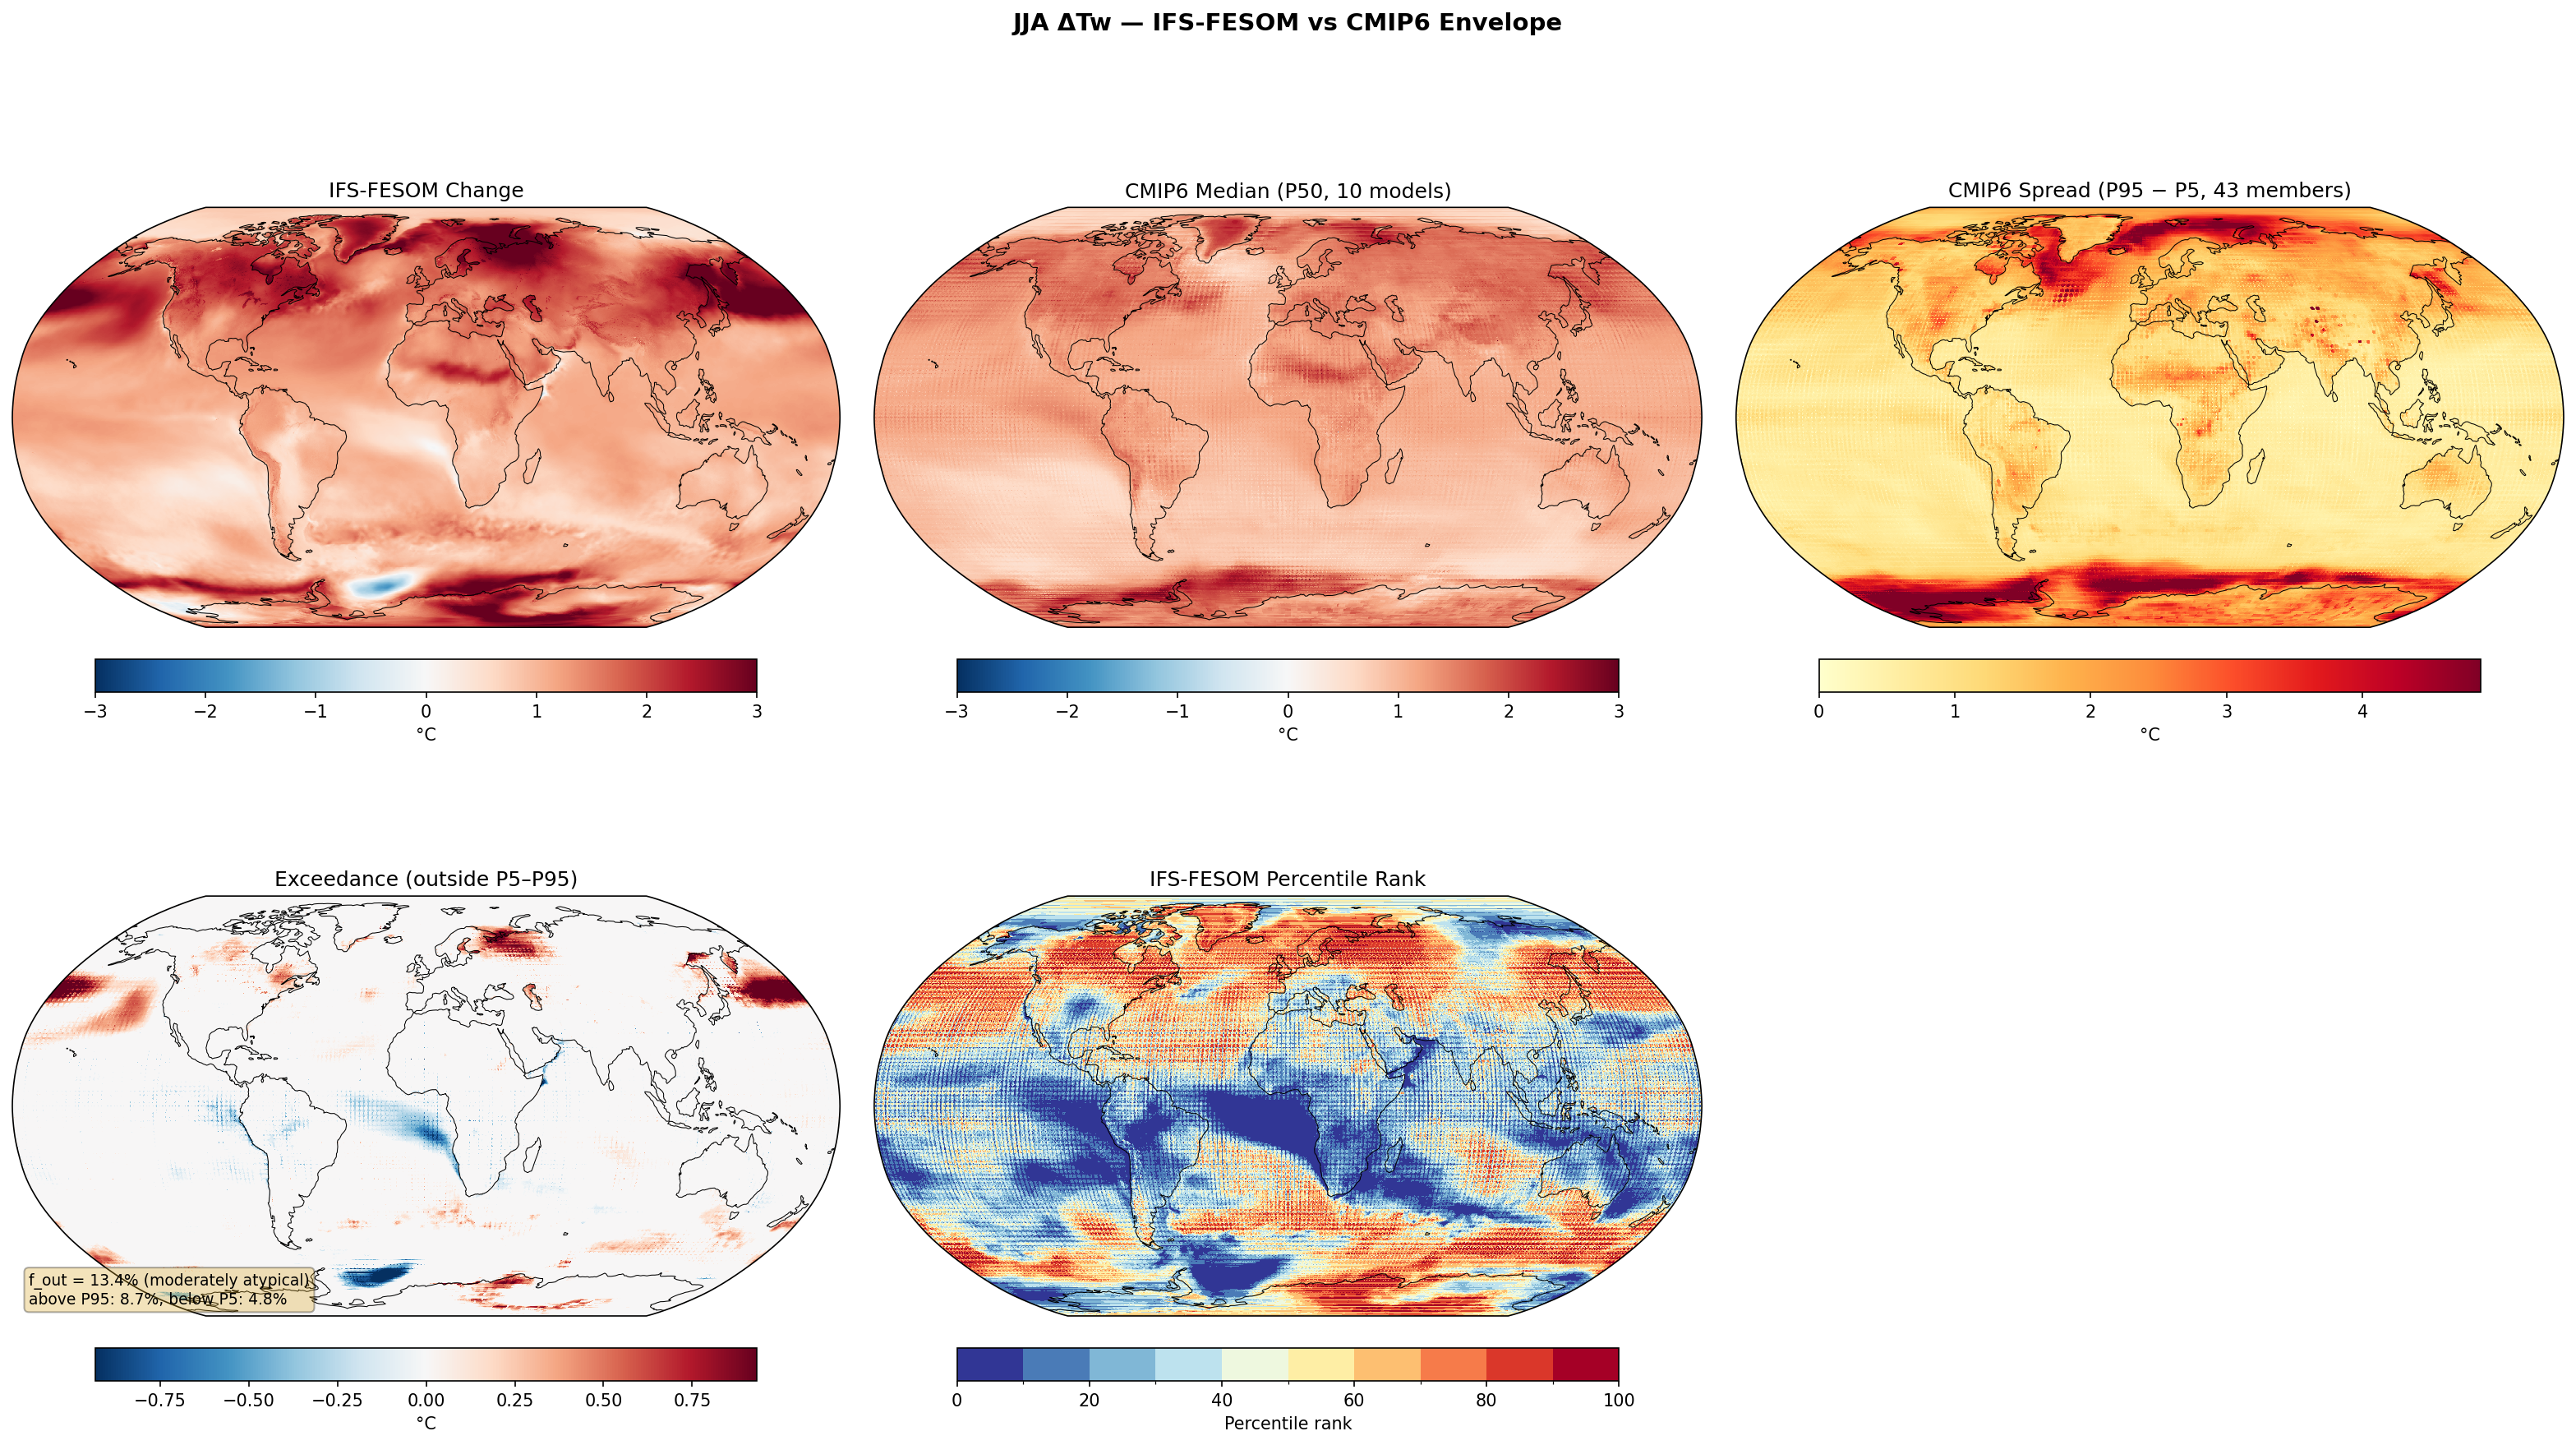
DestinE anomalies compared to the CMIP6 P5–P95 percentile envelope derived from 43 ensemble members across 10 models under SSP3-7.0.
Contributing models: ACCESS-ESM1-5, AWI-CM-1-1-MR, CNRM-CM6-1, CNRM-ESM2-1, EC-Earth3, FGOALS-g3, GISS-E2-1-G, INM-CM5-0, IPSL-CM6A-LR, MPI-ESM1-2-LR
Outside CMIP6 does not mean wrong — it indicates an uncommon response within the CMIP6 distribution.
Synthesis
Related diagnostics
Future JJA Wet Bulb Temperature
| Variables | avg_2t, avg_2d |
|---|---|
| Models | ifs-fesom, ifs-nemo |
| Units | K |
| Baseline | 1990-2014 |
| Future | 2040-2049 |
| Method | Stull (2011) from future JJA T and Td. |
Summary high
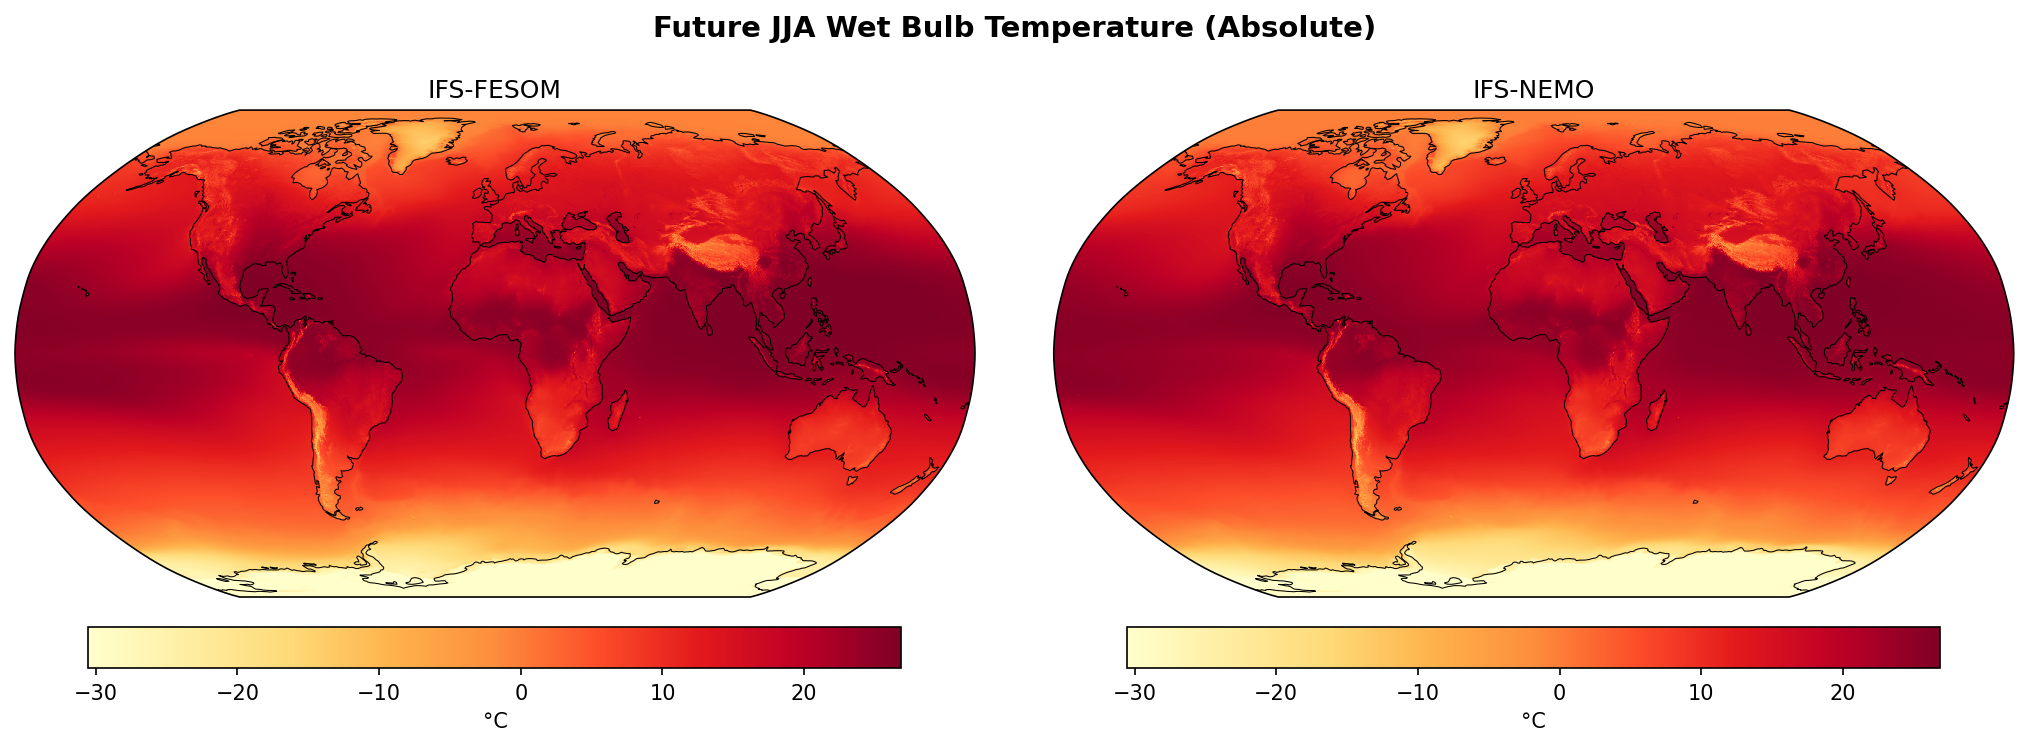
This figure presents the projected absolute Wet Bulb Temperature (Tw) for the boreal summer (JJA) averaged over the 2040–2049 period from two high-resolution DestinE coupled models, IFS-FESOM and IFS-NEMO.
Key Findings
- Both models project extensive regions of high mean wet bulb temperatures (dark red, >25°C) across the tropics and Northern Hemisphere subtropics, specifically in the Amazon Basin, Central Africa, India, and Southeast Asia.
- Topographic features are sharply resolved due to the high model resolution (~5 km), with mountain ranges like the Himalayas, Andes, and Rockies showing distinctly lower Tw values compared to adjacent lowlands.
- There is virtually no discernible difference in the large-scale spatial patterns or magnitudes between the IFS-FESOM and IFS-NEMO simulations for this variable.
Spatial Patterns
The spatial distribution follows a strong latitudinal gradient consistent with the JJA season (Northern Hemisphere summer). The highest values are concentrated in the Northern tropics and subtropics where high temperatures coincide with high humidity (e.g., monsoon regions). The Southern Hemisphere (austral winter) shows progressively lower values towards the pole, with Antarctica exhibiting the lowest values (< -20°C).
Model Agreement
IFS-FESOM and IFS-NEMO show exceptionally high agreement. Visually, the fields are nearly identical, suggesting that the choice of ocean model (FESOM vs NEMO) has limited impact on the climatological mean of atmospheric wet bulb temperature over this decadal period, or that both models are strongly constrained by similar atmospheric physics in the IFS component.
Physical Interpretation
The high Tw values in the Northern Hemisphere are driven by summer solar insolation heating land masses and ocean surfaces, driving up both air temperature and evaporation. The specific hotspots (e.g., Indo-Gangetic Plain, Amazon) correspond to regions with high moisture availability (monsoon flow or evapotranspiration), preventing evaporative cooling of the skin and raising Tw. Low values over topography result from lapse-rate cooling.
Caveats
- The figure displays seasonal means (JJA average), which are significantly lower than the instantaneous peak values relevant for the 35°C survivability threshold; high means, however, imply a higher baseline for heatwaves.
- Metadata states units are Kelvin, but colorbar labels (-30 to +20) clearly indicate degrees Celsius.
JJA Wet Bulb Temperature Change — IFS-FESOM vs CMIP6 Envelope f_out 13.4%
Envelope Metrics
| f_out (outside P5–P95) | 13.4% moderately atypical |
|---|---|
| Above P95 | 8.7% |
| Below P5 | 4.8% |
| CMIP6 ensemble | 10 models, 43 members |
| Variables | avg_2t, avg_2d |
|---|---|
| Models | ifs-fesom |
| Units | K |
| Baseline | 1990-2014 |
| Future | 2040-2049 |
| Method | Tw from Stull (2011) using T and RH. CMIP6 RH direct from hurs. Compared to CMIP6 percentile envelope (P5, P50, P95). |
Summary high
IFS-FESOM projects widespread JJA wet-bulb temperature (Tw) increases for 2040-2049, exhibiting a moderately atypical spatial pattern (13.4% outside CMIP6 envelope) characterized by suppressed warming in the North Atlantic and intensified warming in high-latitude oceans compared to CMIP6.
Key Findings
- A pronounced 'warming hole' signal is visible in the North Atlantic, where IFS-FESOM Tw change is below the CMIP6 5th percentile, indicating significantly weaker warming or cooling.
- The North Pacific and sectors of the Southern Ocean/Antarctic coast show Tw increases exceeding the CMIP6 95th percentile.
- Tropical ocean basins (Atlantic, Indian) generally show lower percentile ranks (10th-30th), suggesting a muted tropical Tw response compared to the CMIP6 median.
- Over major landmasses (Africa, South America, Eurasia), the model largely tracks the CMIP6 median, though parts of Northern Canada and Siberia show elevated warming (70th-90th percentile).
Spatial Patterns
The most striking feature is the dipole in oceanic response: suppressed warming (deep blue percentile) in the North Atlantic subpolar gyre and tropical basins versus enhanced warming (red exceedance) in the North Pacific and sea-ice marginal zones (Barents/Kara, Antarctic coast). Land patterns are more homogeneous and centered within the ensemble spread.
Model Agreement
With an f_out of 13.4%, the model is 'moderately atypical'. Agreement is highest over continental mid-latitudes. Disagreement is concentrated in dynamic ocean regions (North Atlantic, Southern Ocean) where high-resolution ocean physics (eddies, convection) likely diverge from coarse CMIP6 parameterizations.
Physical Interpretation
The North Atlantic anomaly strongly suggests a more vigorous AMOC slowdown or distinct convection response in the high-resolution FESOM ocean compared to the standard CMIP6 mean. The exceedance in high latitudes likely reflects stronger sea-ice loss feedbacks (open water increasing latent heat/humidity) or differences in surface fluxes in the eddy-resolving regime. The muted tropical response may relate to IFS-specific cloud feedbacks or evaporative cooling efficiencies.
Caveats
- JJA represents winter in the Southern Hemisphere; large Tw anomalies there are thermodynamically interesting but less relevant for human heat stress impact than in the Northern Hemisphere.
- The wet-bulb temperature is a derived proxy (Stull 2011) and depends on the accuracy of both Temperature and Relative Humidity fields.
JJA Wet Bulb Temperature Change — IFS-NEMO vs CMIP6 Envelope f_out 16.2%
Envelope Metrics
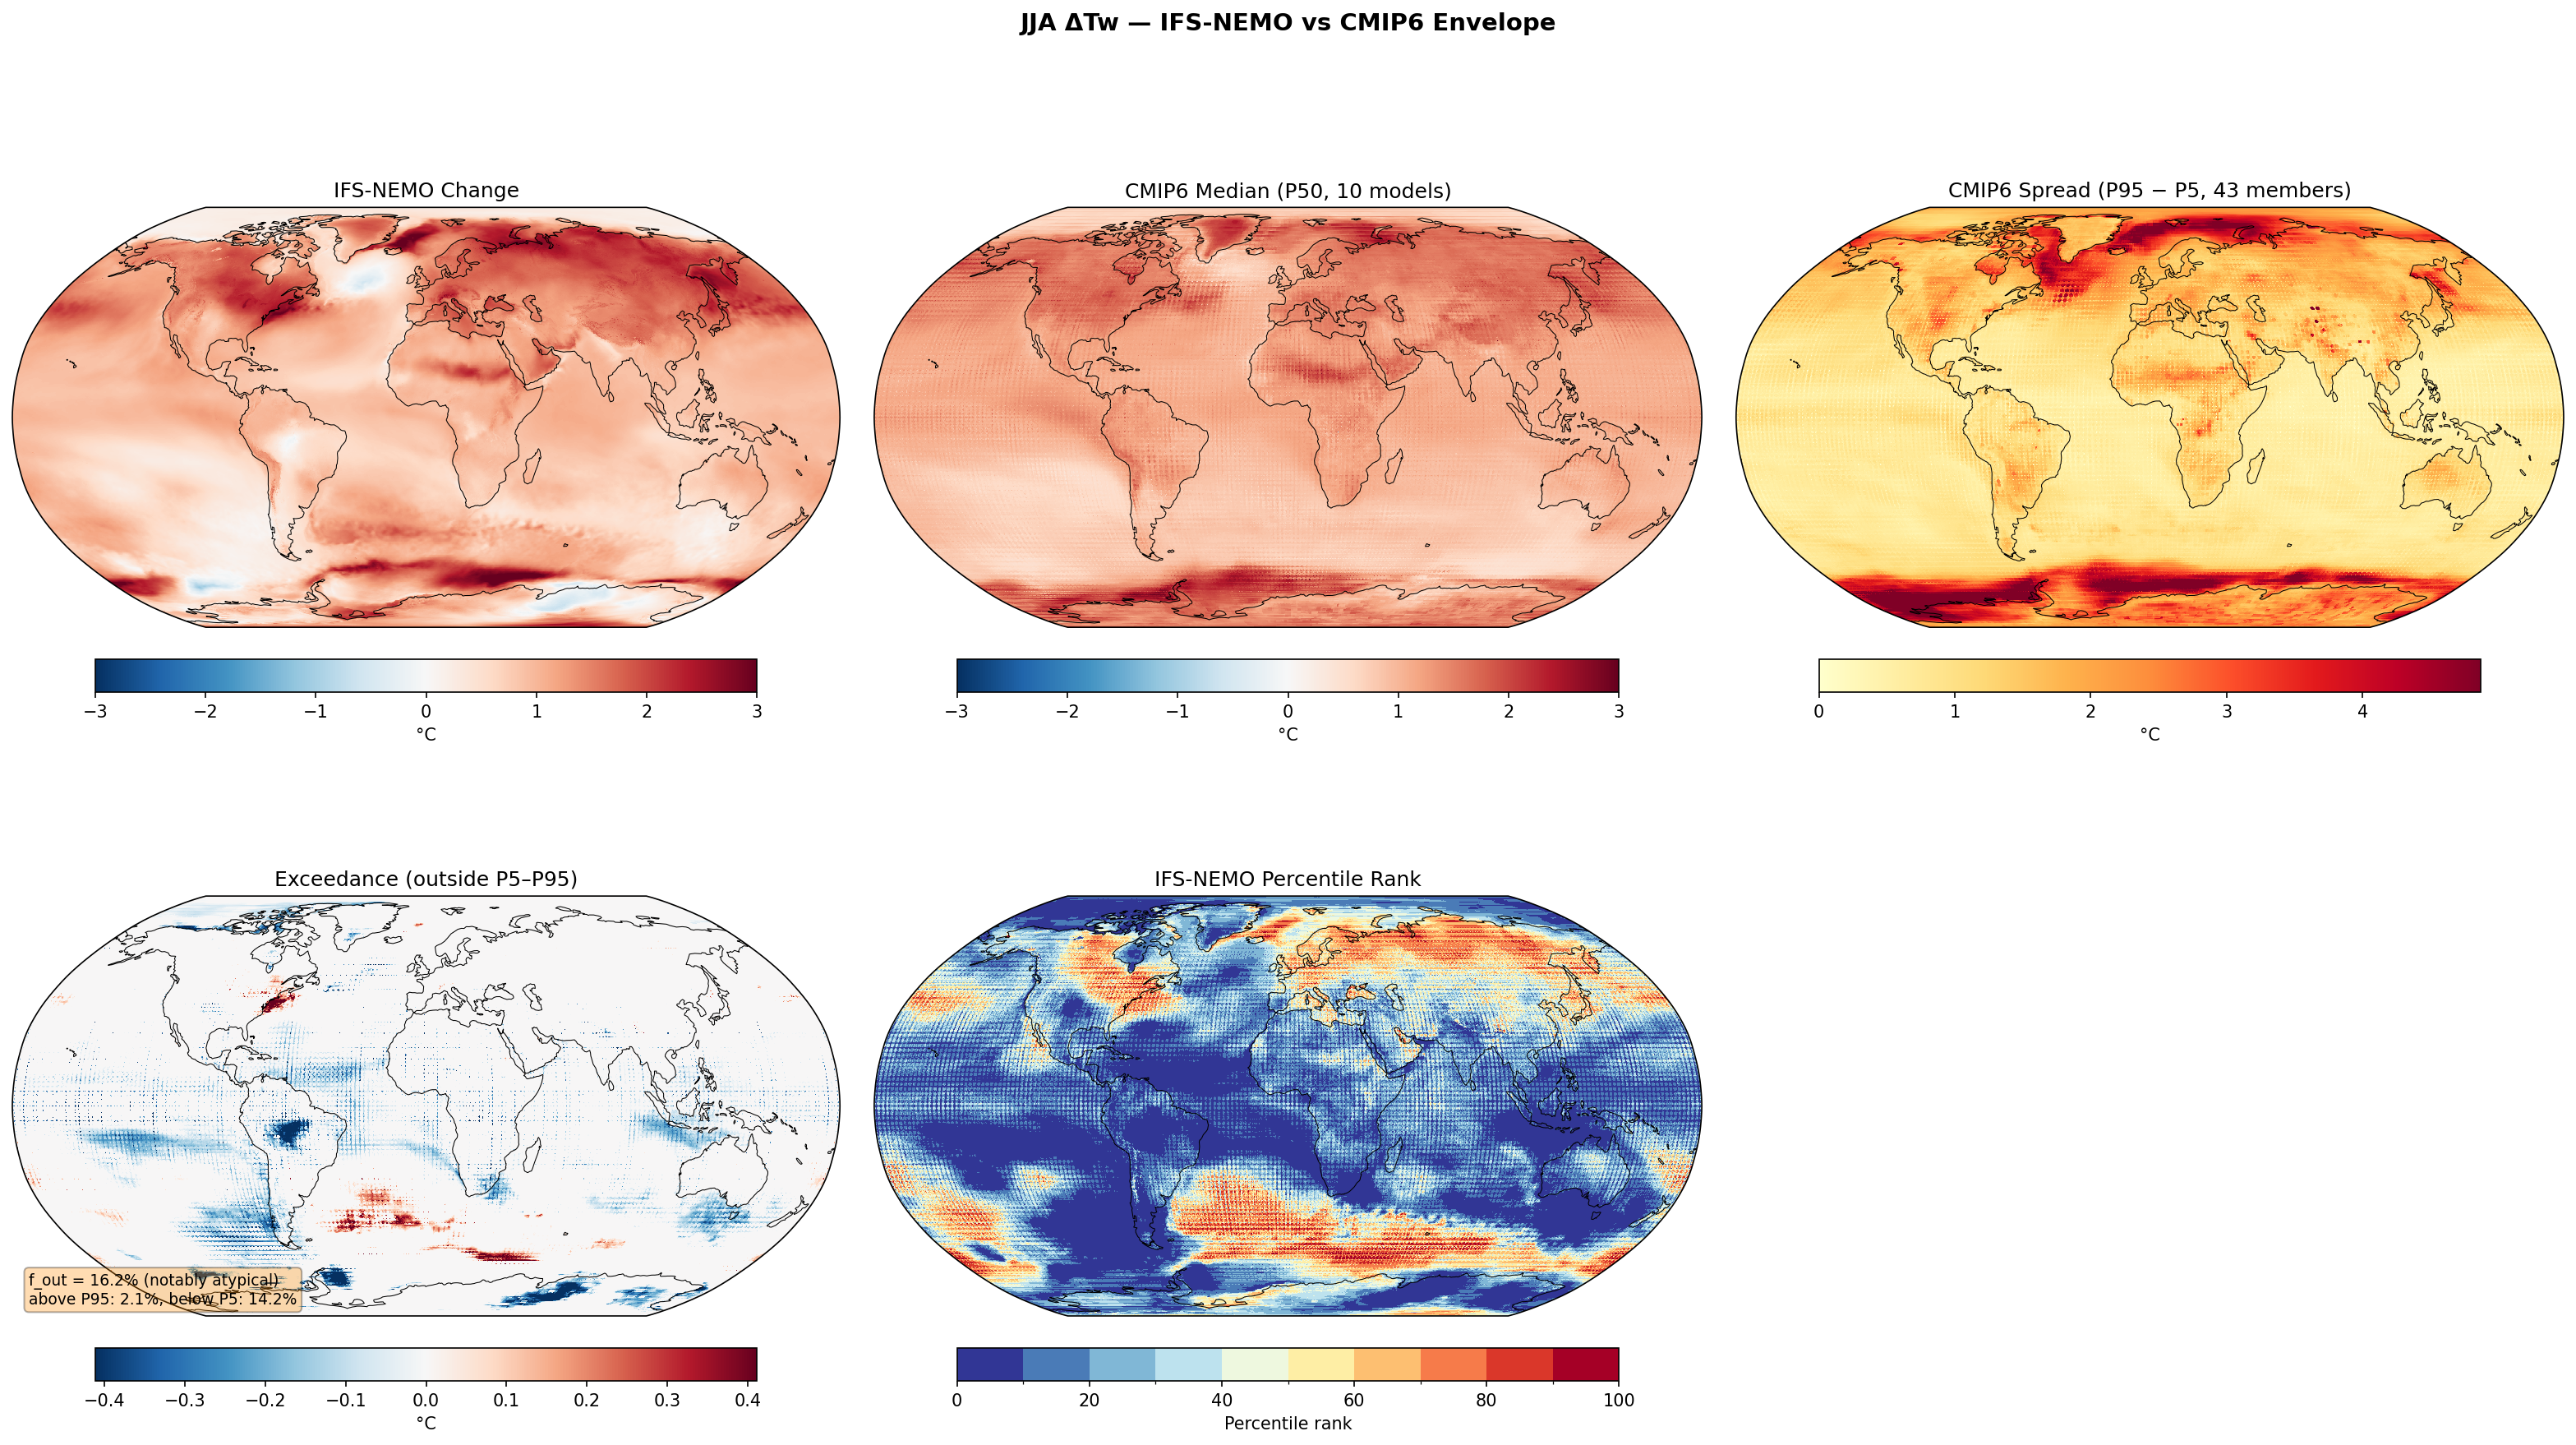
| f_out (outside P5–P95) | 16.2% notably atypical |
|---|---|
| Above P95 | 2.1% |
| Below P5 | 14.2% |
| CMIP6 ensemble | 10 models, 43 members |
| Variables | avg_2t, avg_2d |
|---|---|
| Models | ifs-nemo |
| Units | K |
| Baseline | 1990-2014 |
| Future | 2040-2049 |
| Method | Tw from Stull (2011) using T and RH. CMIP6 RH direct from hurs. Compared to CMIP6 percentile envelope (P5, P50, P95). |
Summary high
IFS-NEMO projects substantially lower JJA wet-bulb temperature increases ($\Delta T_w$) than the CMIP6 ensemble over vast oceanic regions, particularly in the Southern Hemisphere and tropics, leading to a notably atypical $f_{out}$ of 16.2% (mostly below the P5 threshold). However, the model exhibits a classic high-resolution structural signal in the North Atlantic, with a sharper 'warming hole' and an intense Gulf Stream warming spike that exceeds the CMIP6 P95.
Key Findings
- IFS-NEMO is an outlier on the lower end (below P5) for $\Delta T_w$ over 14.2% of the globe, dominated by the Southern Hemisphere oceans, tropical Pacific, and parts of the North Atlantic.
- A concentrated region of $\Delta T_w$ increase exceeding the CMIP6 P95 is visible in the Gulf Stream extension, likely reflecting resolved western boundary current dynamics absent in coarse models.
- The North Atlantic warming hole is deeper and more distinct in IFS-NEMO than in the CMIP6 median, falling below the P5 envelope boundary.
Spatial Patterns
The dominant pattern is widespread 'blue' exceedance (IFS-NEMO < CMIP6 P5) across the Southern Ocean, South Atlantic, and Indian Ocean. In the Northern Hemisphere, land masses generally fall within the CMIP6 envelope (ranks 30-70), while the North Atlantic presents a dipole: a deep cooling signal (below P5) south of Greenland and intense warming (above P95) off the US East Coast. Tropical land areas (e.g., Amazon, Central Africa) also show patches below the P5 threshold.
Model Agreement
Agreement is strongest over Northern Hemisphere land masses (North America, Eurasia) where IFS-NEMO lies near the CMIP6 median (ranks 40-60). Disagreement is pronounced over global oceans, where IFS-NEMO consistently predicts less wet-bulb warming than the CMIP6 ensemble, except for specific dynamical features like the Gulf Stream.
Physical Interpretation
The widespread lower $\Delta T_w$ (below P5) suggests IFS-NEMO has a lower transient climate response or stronger oceanic heat uptake efficiency than the subset of 'hot' CMIP6 models influencing the SSP3-7.0 envelope. The localized exceedance (red) in the Gulf Stream and the deep cooling (blue) in the North Atlantic subpolar gyre are signatures of high-resolution ocean circulation: the model resolves the sharp thermal gradients and potential AMOC-related slowdown more acutely than coarse-resolution CMIP6 models, which tend to diffuse these features.
Caveats
- Wet-bulb temperature combines temperature and humidity; regions below P5 could result from either less warming or stronger drying (humidity decrease).
- JJA represents winter in the Southern Hemisphere, where signal-to-noise ratios for wet-bulb change are physically different than in the summer hemisphere.
JJA Wet Bulb Temperature Change
| Variables | avg_2t, avg_2d |
|---|---|
| Models | ifs-fesom, ifs-nemo, CMIP6-MMM |
| Units | K |
| Baseline | 1990-2014 |
| Future | 2040-2049 |
| Method | Tw from Stull (2011) approximation using T and RH (RH from Magnus formula via T and Td). |
Summary high
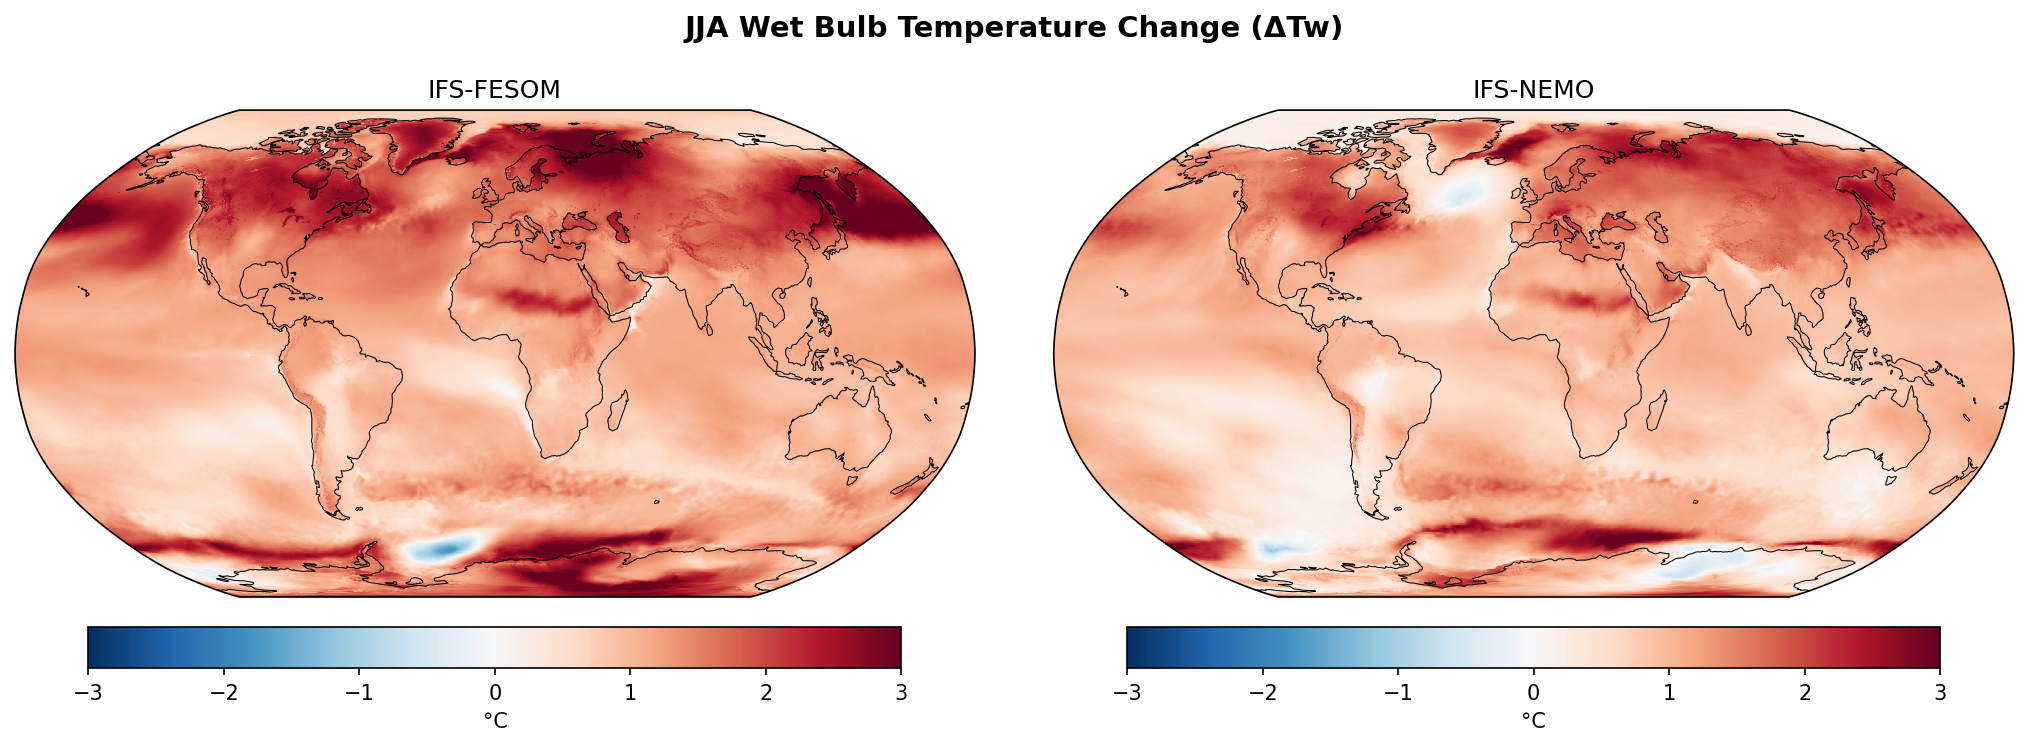
This figure compares the change in JJA wet-bulb temperature (Tw) projected for the 2040s relative to the 1990-2014 baseline across IFS-FESOM, IFS-NEMO, and the CMIP6 multi-model mean. While all models show widespread warming particularly over Northern Hemisphere land, the two DestinE models exhibit strikingly different responses in the North Atlantic.
Key Findings
- IFS-NEMO exhibits a distinct 'warming hole' (absolute cooling of 1–2°C) in the subpolar North Atlantic, a feature absent in IFS-FESOM and the CMIP6 mean.
- IFS-FESOM projects stronger and more widespread warming over the North Atlantic and North Pacific compared to IFS-NEMO.
- Both DestinE models resolve localized cooling patches in the Southern Ocean (Weddell Sea area) that are smoothed out or absent in the CMIP6 multi-model mean.
- Northern Hemisphere land masses experience the largest Tw increases (>2°C), indicating combined heat and humidity stress during boreal summer.
Spatial Patterns
The dominant pattern is land-amplified warming in the Northern Hemisphere. A major divergence occurs in the North Atlantic: IFS-NEMO shows a localized blue (cooling) patch south of Greenland, whereas IFS-FESOM shows intense red (warming). Both DestinE models show sharper gradients and more granular features along coastlines and orography compared to the smoother CMIP6 field.
Model Agreement
There is strong agreement on the magnitude of warming over continental regions (North America, Eurasia) and the Arctic. The primary disagreement is the sign of change in the subpolar North Atlantic, where IFS-NEMO diverges significantly from IFS-FESOM and the CMIP6 average.
Physical Interpretation
The rise in Tw is thermodynamically driven by higher temperatures and specific humidity (Clausius-Clapeyron). The cooling hole in IFS-NEMO strongly suggests a dynamic slowdown of the Atlantic Meridional Overturning Circulation (AMOC), reducing northward heat transport. The absence of this feature in IFS-FESOM implies structural differences in ocean coupling or state stability. Southern Ocean cooling likely reflects high-resolution sea-ice dynamics or deep convection variability not resolved in standard CMIP6 models.
Caveats
- The analysis period is short (10 years), so internal decadal variability (e.g., AMOC phases) may exaggerate differences between the single-realization DestinE runs.
- The wet-bulb proxy calculation relies on daily averages, which may smooth out diurnal extremes important for heat stress assessment.