Tier 1 Freshwater Flux (P−E) CMIP6 f_out 19.5%
CMIP6 Envelope Comparison
DestinE anomalies compared to the CMIP6 P5–P95 percentile envelope derived from 51 ensemble members across 11 models under SSP3-7.0.
Contributing models: ACCESS-ESM1-5, AWI-CM-1-1-MR, CNRM-CM6-1, CNRM-ESM2-1, EC-Earth3, FGOALS-g3, GISS-E2-1-G, INM-CM5-0, IPSL-CM6A-LR, MPI-ESM1-2-LR, MRI-ESM2-0
Outside CMIP6 does not mean wrong — it indicates an uncommon response within the CMIP6 distribution.
Synthesis
Related diagnostics
Evaporation Change
| Variables | avg_tprate, avg_ie |
|---|---|
| Models | ifs-fesom, ifs-nemo |
| Units | kg/m2/s |
| Baseline | 1990-2014 |
| Future | 2040-2049 |
| Method | Future mean minus historical mean of avg_ie. |
Summary high
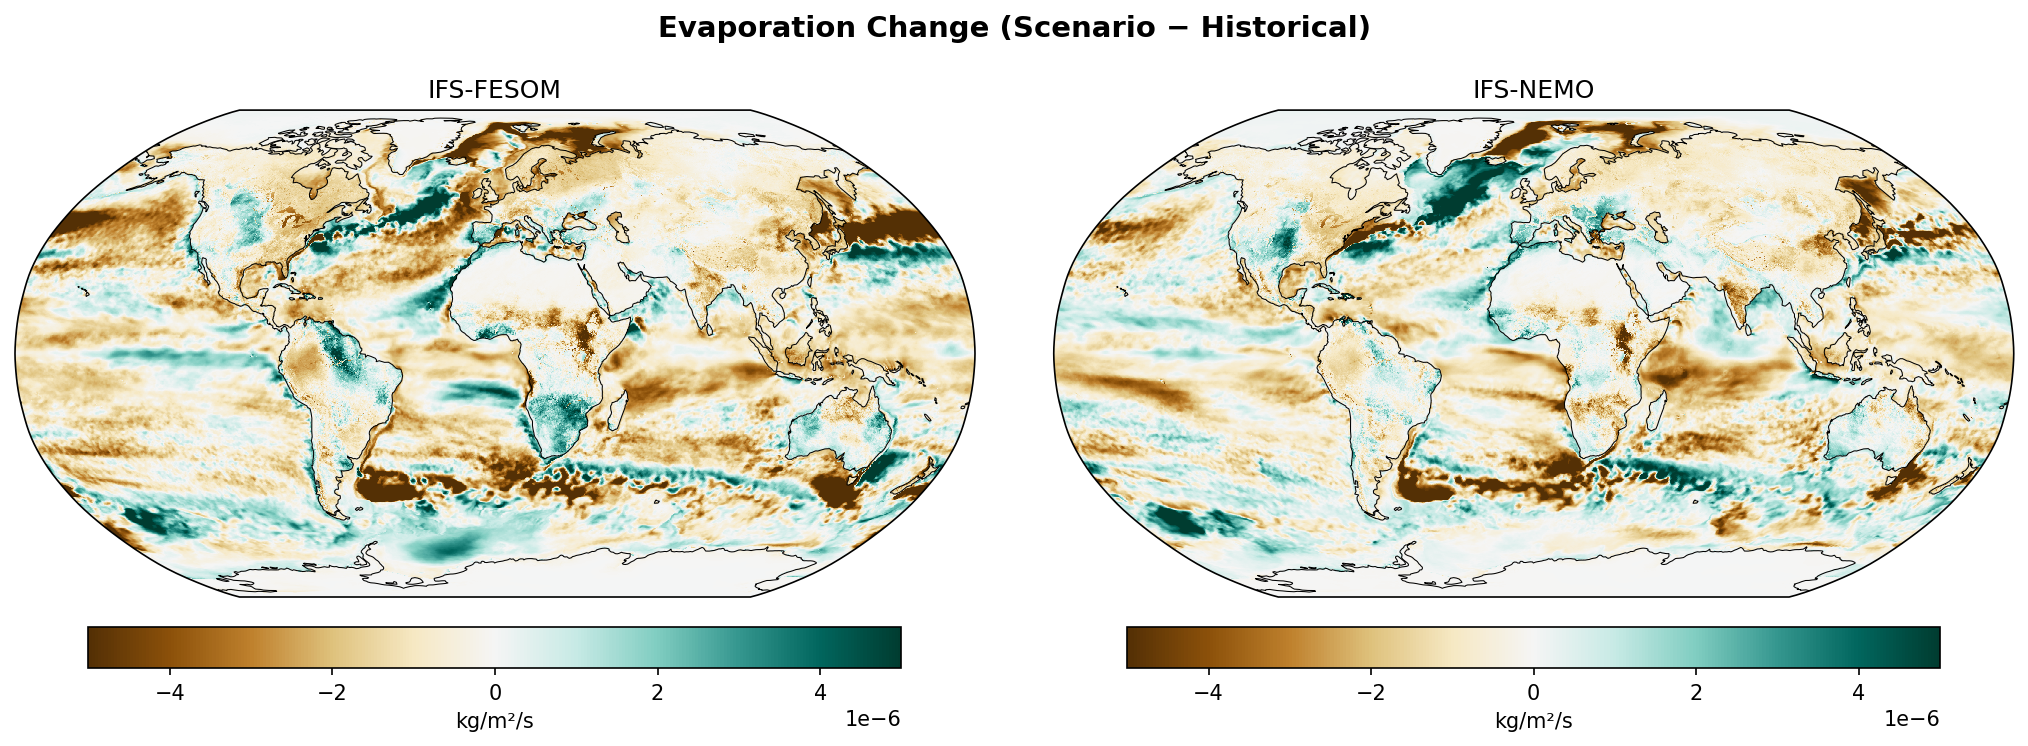
This figure displays the projected change in evaporation rates (2040–2049 vs 1990–2014) for two high-resolution coupled models, IFS-FESOM and IFS-NEMO. Both models show highly consistent spatial patterns dominated by Arctic sea-ice loss signals and North Atlantic circulation changes.
Key Findings
- Arctic Amplification Signal: Strong positive evaporation anomalies (green) across the Arctic Ocean, consistent with sea-ice retreat exposing warmer open water to the atmosphere.
- North Atlantic Dipole: A distinct pattern of increased evaporation along the Gulf Stream/North Atlantic Current path and decreased evaporation (brown) in the subpolar gyre, indicative of the 'warming hole' associated with AMOC slowdown.
- Tropical Hydrology: Notable increases in evaporation over wet land regions (Amazon, Congo Basin) and parts of the tropical oceans, reflecting an intensified hydrological cycle.
- Model Consistency: IFS-FESOM and IFS-NEMO exhibit remarkable agreement in both the spatial distribution and magnitude of changes, suggesting the atmospheric component (IFS) or robust large-scale ocean responses dominate over differences in ocean discretization.
Spatial Patterns
The most prominent feature is the high-latitude increase in evaporation, particularly in the Arctic. In the North Atlantic, a sharp gradient exists between the enhanced evaporation in the subtropics/mid-latitudes and suppressed evaporation south of Greenland. Over land, increases are concentrated in the deep tropics, while arid regions (Sahara, Australia) show negligible change.
Model Agreement
The two models (IFS-FESOM and IFS-NEMO) show very high agreement. Differences are subtle and difficult to distinguish at global scale, indicating that the choice of ocean model (unstructured vs. structured grid) does not strongly alter the fundamental evaporation response to the SSP3-7.0 forcing over this time horizon.
Physical Interpretation
1. Arctic Increase: Removal of sea ice insulation allows large latent heat fluxes from the ocean to the atmosphere. 2. North Atlantic Dipole: The 'warming hole' (suppressed surface warming or cooling) in the subpolar gyre reduces the saturation vapor pressure at the surface, decreasing evaporation relative to the baseline, while warming along the current path enhances it. 3. Global Increase: General thermodynamic response where a warmer atmosphere drives higher evaporative demand over wet surfaces.
Caveats
- The analysis period (2040s) is relatively near-term, so internal climate variability may still influence regional patterns (especially in the North Atlantic).
- Units are small (kg/m²/s), with maximum plotted changes around 0.35-0.4 mm/day, representing moderate shifts rather than extreme regime changes outside the Arctic.
P−E Change (Freshwater Flux)
| Variables | avg_tprate, avg_ie |
|---|---|
| Models | ifs-fesom, ifs-nemo |
| Units | kg/m2/s |
| Baseline | 1990-2014 |
| Future | 2040-2049 |
| Method | Δ(P−E) = Δ(avg_tprate) − Δ(avg_ie). |
Summary high
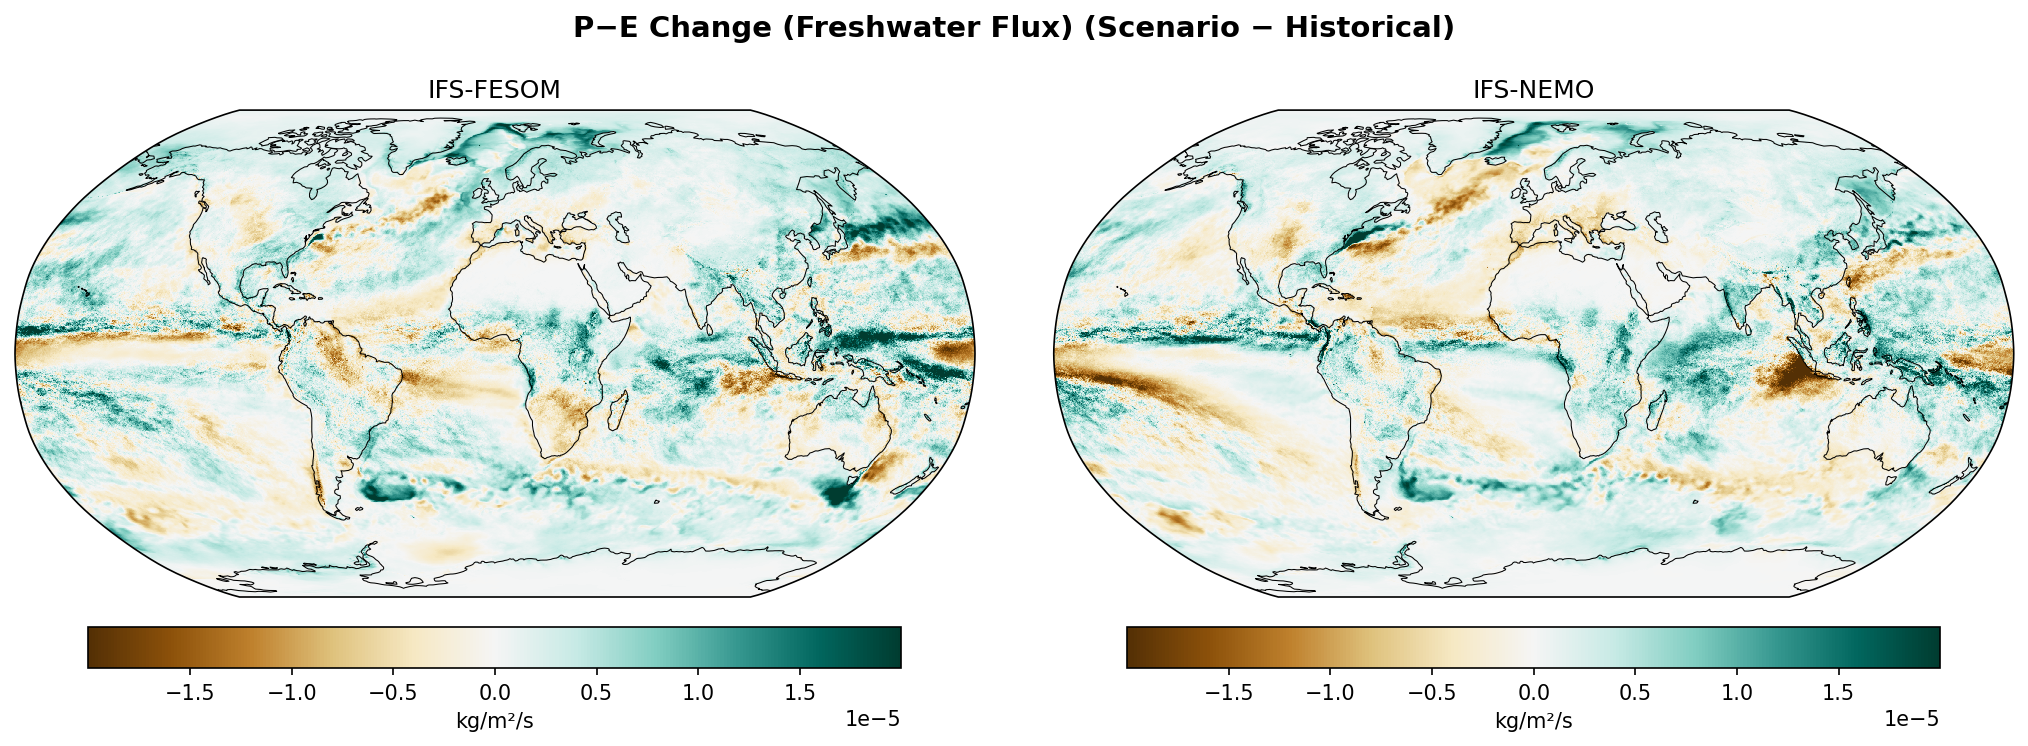
The figure presents the projected change in freshwater flux (P-E) for the 2040s (SSP3-7.0) relative to the 1990-2014 baseline for two high-resolution coupled models, IFS-FESOM and IFS-NEMO, showing a global intensification of the hydrological cycle.
Key Findings
- Both models exhibit a robust 'wet-gets-wetter, dry-gets-drier' thermodynamic response, particularly in the tropical oceans and high latitudes.
- A sharp zonal dipole in the Tropical Pacific indicates a narrowing or southward shift of the ITCZ, characterized by a distinct drying band on its northern flank.
- IFS-FESOM projects a more severe and widespread drying signal over the Amazon basin compared to the more mixed response in IFS-NEMO.
- Eddy-scale features are visible in the P-E changes along major western boundary currents (Gulf Stream, Kuroshio), reflecting high-resolution air-sea coupling.
Spatial Patterns
The most prominent feature is the intensification of tropical rainfall patterns. The Tropical Pacific shows a 'double-band' structure with wetting near the equator and strong drying (brown) just north of it (~5-10°N). The North Atlantic exhibits broad wetting in the subpolar gyre and drying in the subtropics and Mediterranean. The Maritime Continent and eastern Indian Ocean show strong drying, particularly intense in IFS-NEMO. Over land, the Amazon and Southern Africa generally dry, while the Sahel and high-latitude Eurasia wet.
Model Agreement
IFS-FESOM and IFS-NEMO show high agreement on the large-scale oceanic patterns (Pacific ITCZ narrowing, Atlantic thermodynamic response). Disagreements are most notable in terrestrial hydroclimate sensitivity, specifically over the Amazon (IFS-FESOM is drier) and the intensity of drying over the Maritime Continent (IFS-NEMO is stronger). IFS-FESOM also displays sharper, more granular features along western boundary currents, likely due to the unstructured grid's resolution of mesoscale eddies.
Physical Interpretation
The broad patterns are driven by the Clausius-Clapeyron relationship: a warmer atmosphere holds more moisture, increasing moisture convergence in existing convergence zones (ITCZ, storm tracks) and evaporation in divergence zones. The specific Pacific banding suggests dynamic changes to the Hadley circulation width. The fine-scale structures in the Gulf Stream/Kuroshio regions demonstrate the influence of resolved ocean eddies on local evaporation and precipitation, a process often parameterized or absent in standard resolution CMIP6 models.
Caveats
- The analysis compares a short future period (2040-2049) against a baseline, meaning internal decadal variability (e.g., ENSO phases) may significantly modulate the forced climate change signal.
- No statistical significance masking is applied, so some smaller regional anomalies may be noise.
Precipitation Change
| Variables | avg_tprate, avg_ie |
|---|---|
| Models | ifs-fesom, ifs-nemo, CMIP6-MMM |
| Units | kg/m2/s |
| Baseline | 1990-2014 |
| Future | 2040-2049 |
| Method | Future mean minus historical mean of avg_tprate. |
Summary medium
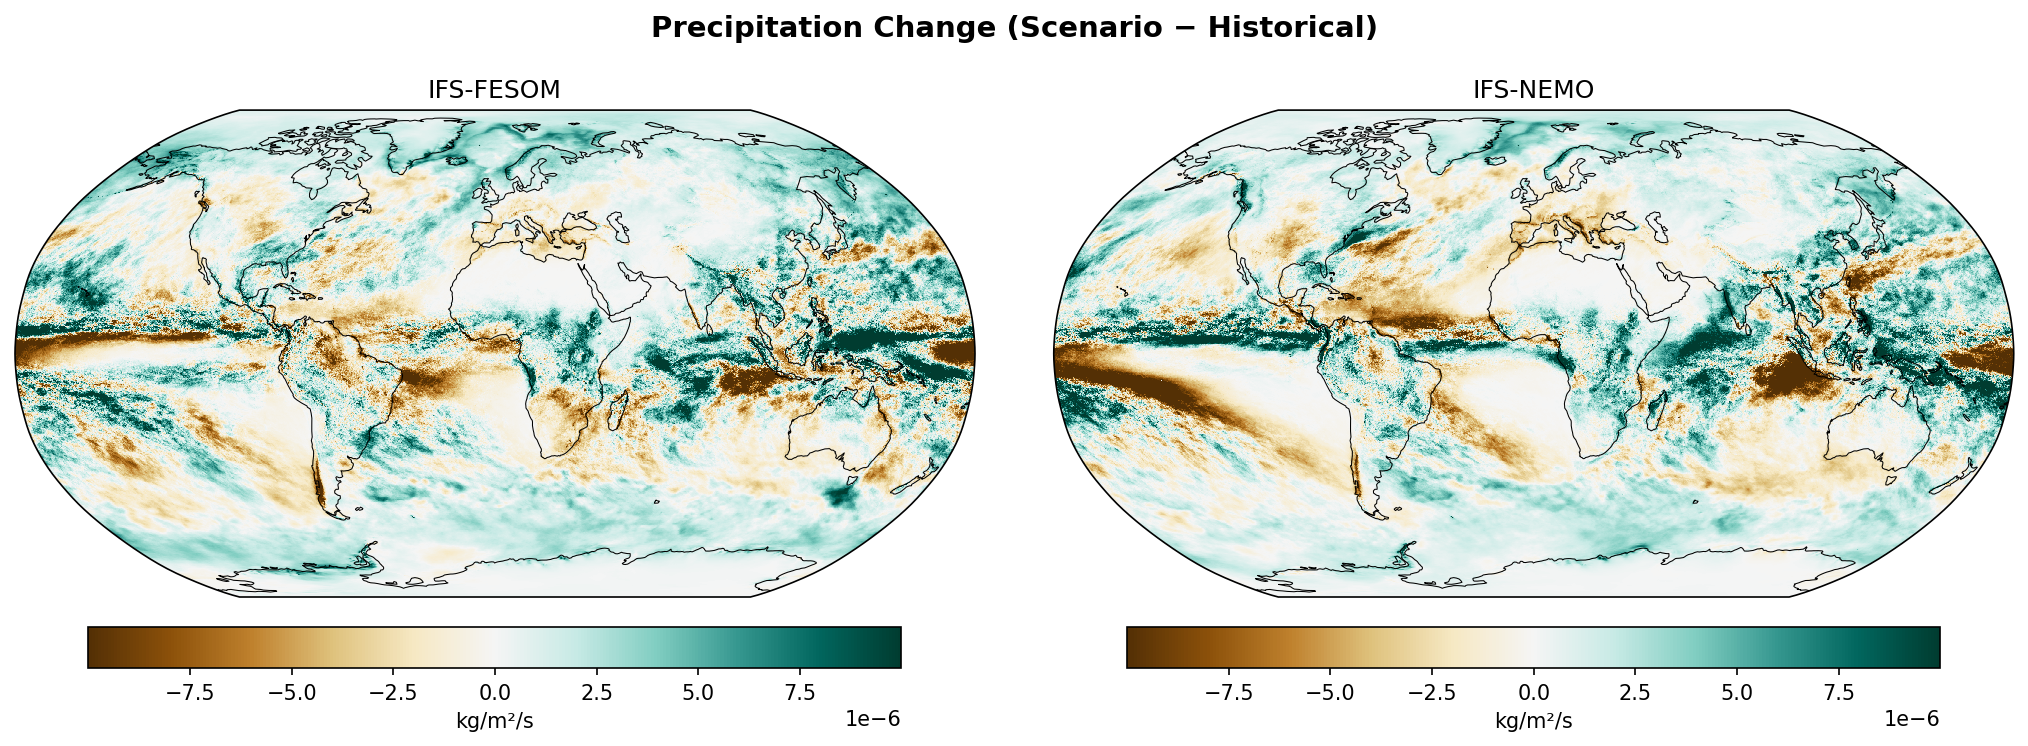
This figure compares projected precipitation changes (2040–2049 vs. 1990–2014) from two high-resolution DestinE models (IFS-FESOM, IFS-NEMO) against the CMIP6 multi-model mean (MMM), highlighting the added granularity and distinct tropical dynamical responses in the high-resolution simulations.
Key Findings
- IFS-NEMO exhibits a prominent, intense drying band in the southern tropical Pacific and Maritime Continent, a feature significantly stronger than in IFS-FESOM or the CMIP6 MMM.
- Both DestinE models resolve sharp, localized wetting patterns over the Sahel and Central Africa, contrasting with the smoother, broader wetting signal in the CMIP6 mean.
- High-latitude wetting (Arctic, Southern Ocean) and subtropical drying (Mediterranean, Southern Africa) are consistent across all panels, reflecting robust large-scale thermodynamic drivers.
- The CMIP6 'double ITCZ' precipitation increase pattern in the Pacific is replaced by more complex, spatially distinct convective shifts in the high-resolution models.
Spatial Patterns
The CMIP6-MMM displays smooth, zonally oriented bands of wetting in the ITCZ and high latitudes, with broad subtropical drying. In contrast, IFS-FESOM and IFS-NEMO show highly heterogeneous, granular patterns. IFS-NEMO specifically shows a strong dipole in the Indian Ocean (wet west, dry east) and a massive drying feature extending from the Maritime Continent into the South Pacific. IFS-FESOM shows a 'noisier' tropical Pacific response with mixed wetting and drying cells, suggesting active convective reorganization.
Model Agreement
There is broad qualitative agreement on the thermodynamic signal: wetting in high latitudes and drying in subtropical semi-arid regions (e.g., Mediterranean, Chile, SW Australia). Significant disagreement exists in the tropical oceans, particularly the Pacific and Indian Oceans, where DestinE models show sharper gradients and different zonal placements of anomalies compared to the smoothed CMIP6 ensemble. The intense drying in the IFS-NEMO South Pacific is a notable divergence.
Physical Interpretation
The large-scale pattern is driven by the 'wet-get-wetter' mechanism (Clausius-Clapeyron relation), intensifying moisture transport to convergence zones and high latitudes. The divergence in the tropics is likely due to two factors: (1) High-resolution models resolving mesoscale convective organization and orographic interaction (e.g., distinct African rainbands) that coarse models parameterize; and (2) Internal climate variability. The DestinE plots represent a single decadal realization, so the strong tropical anomalies (like the IFS-NEMO Pacific drying) likely include unforced decadal variability (e.g., ENSO phasing) superimposed on the climate change signal.
Caveats
- The 10-year averaging period for DestinE is insufficient to filter out internal decadal variability (e.g., ENSO), which heavily contaminates precipitation change signals in the tropics compared to the 30-year, multi-member CMIP6 mean.
- The strong drying in the IFS-NEMO South Pacific may reflect a model-specific bias adjustment or a specific ENSO phase rather than a forced trend.
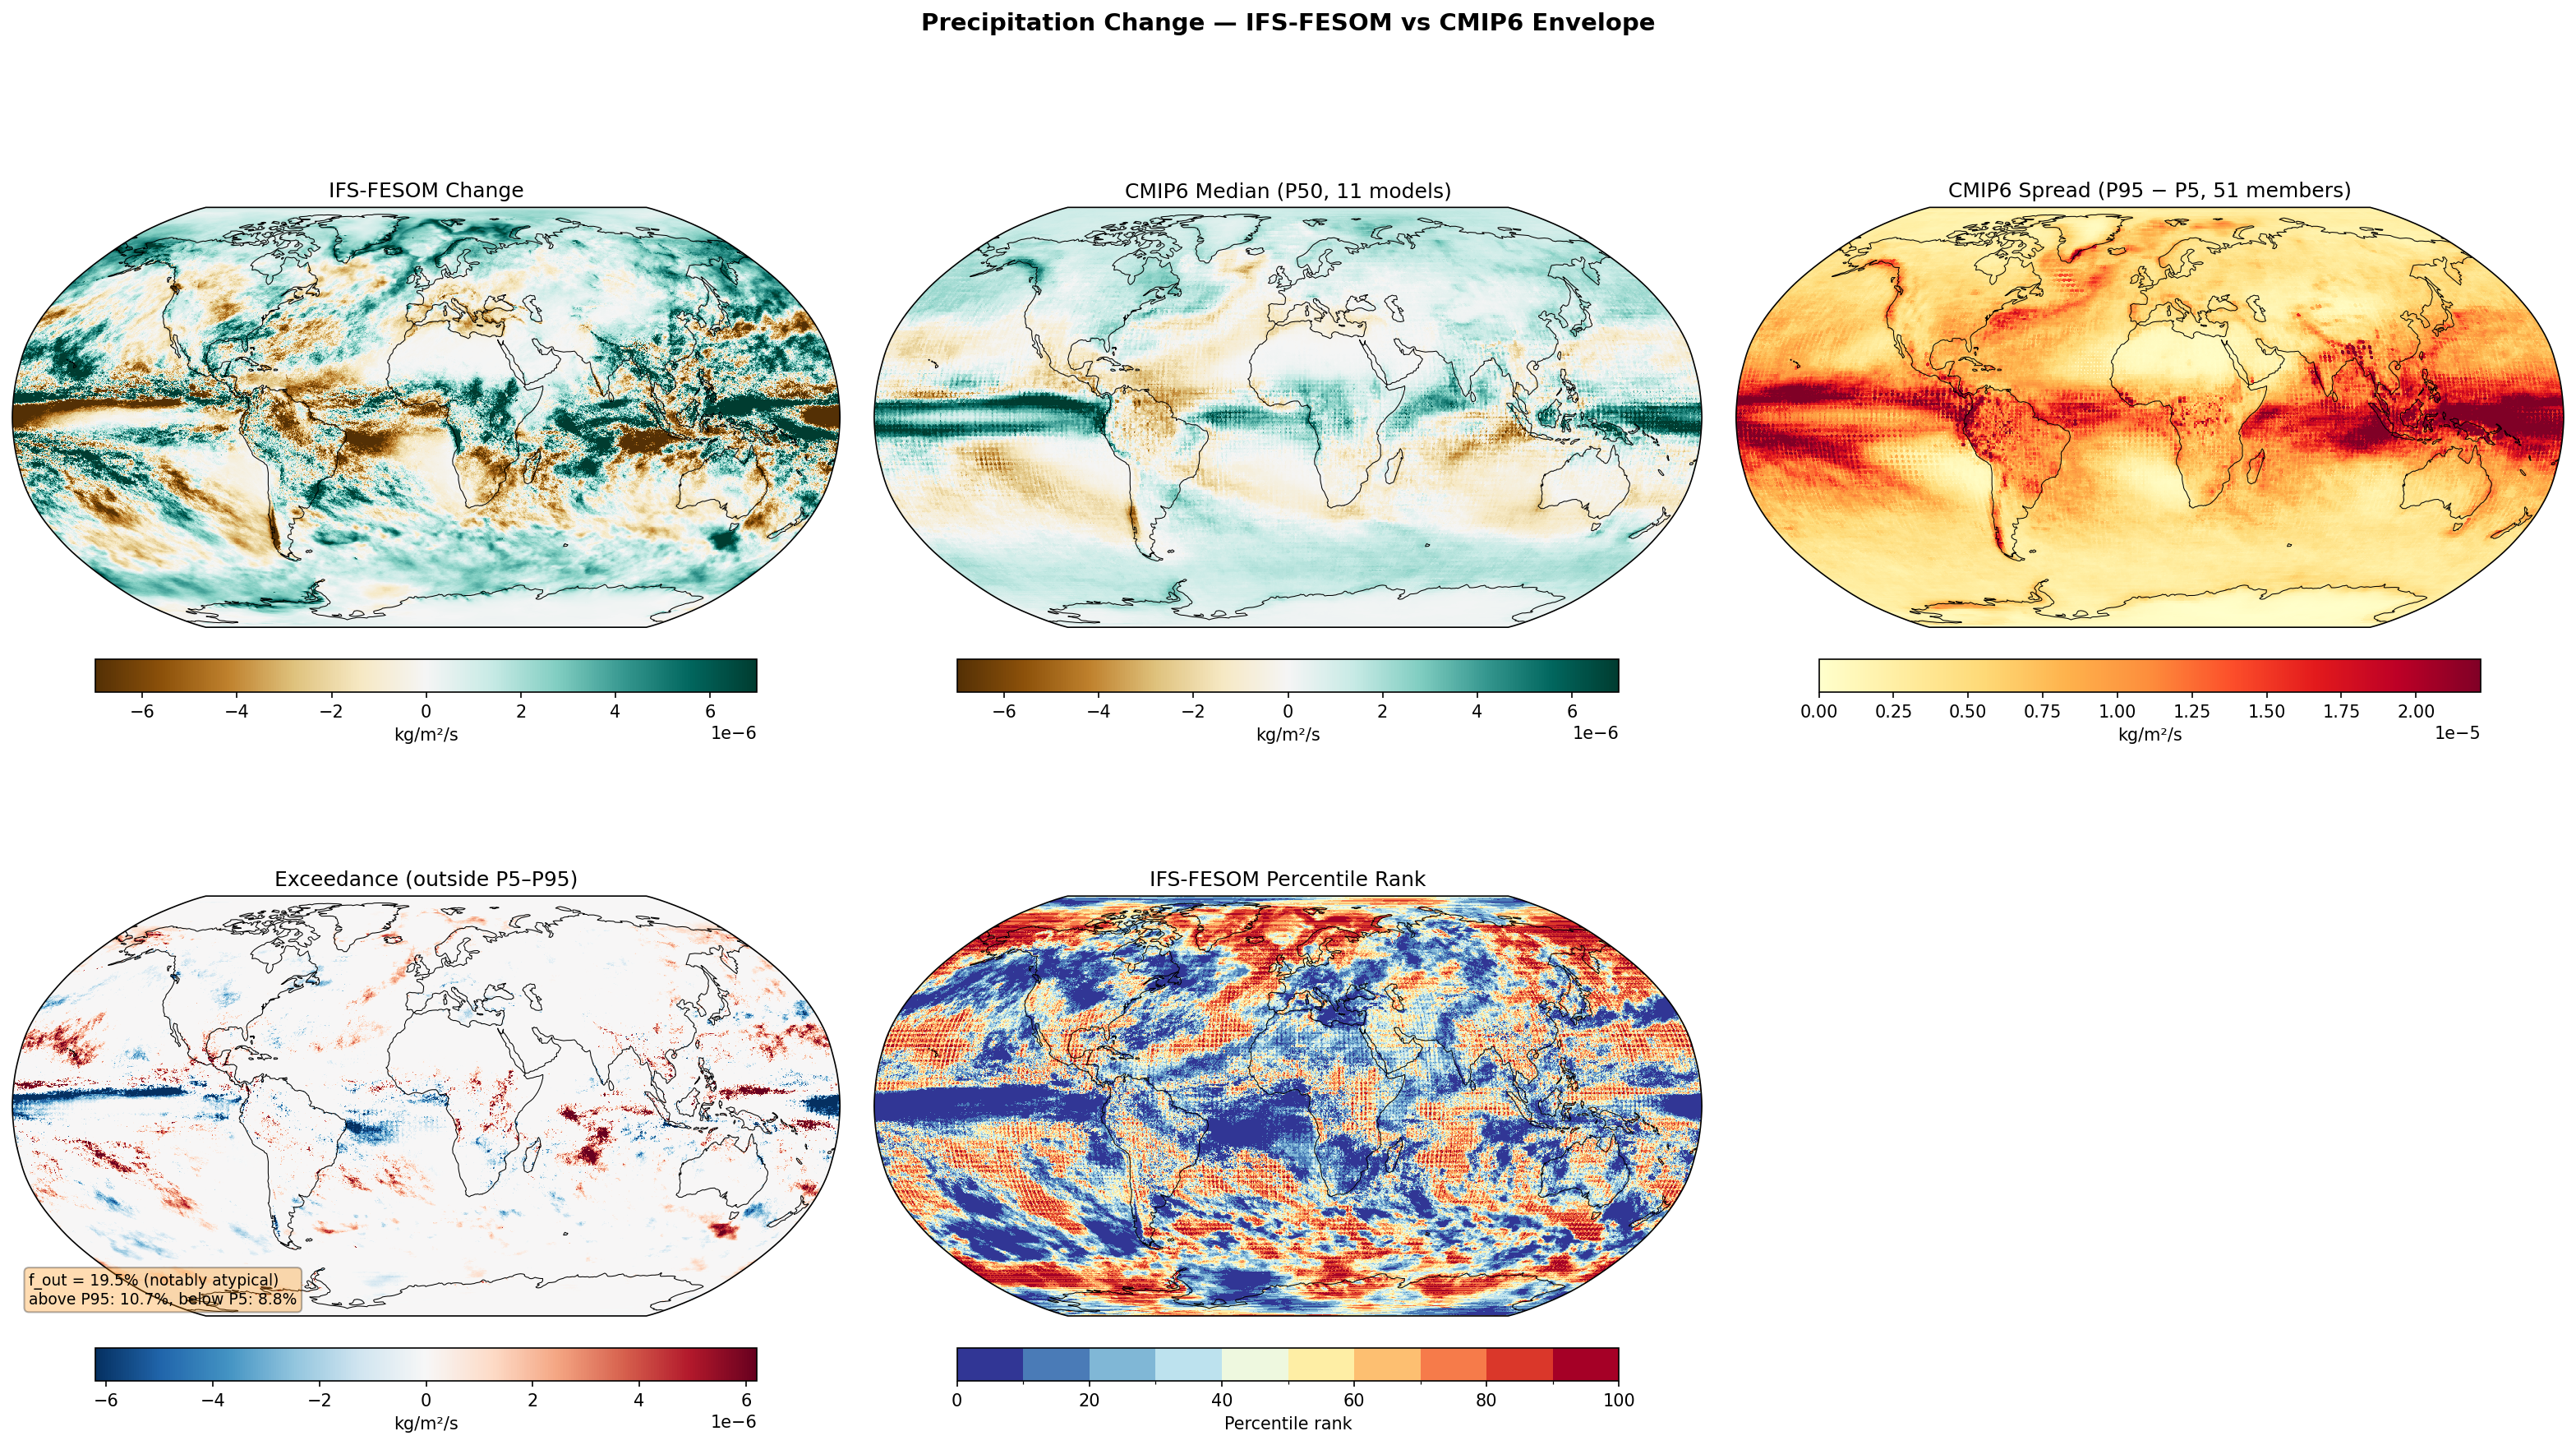
Precipitation Change — IFS-FESOM vs CMIP6 Envelope f_out 19.5%
Envelope Metrics
| f_out (outside P5–P95) | 19.5% notably atypical |
|---|---|
| Above P95 | 10.7% |
| Below P5 | 8.8% |
| CMIP6 ensemble | 11 models, 51 members |
| Variables | avg_tprate, avg_ie |
|---|---|
| Models | ifs-fesom |
| Units | kg/m2/s |
| Baseline | 1990-2014 |
| Future | 2040-2049 |
| Method | Future mean minus historical mean of avg_tprate. Compared to CMIP6 percentile envelope (P5, P50, P95). |
Summary high
IFS-FESOM exhibits a notably atypical precipitation response (f_out = 19.5%) compared to the CMIP6 ensemble, characterized primarily by sharper, more intense dynamical shifts in the Tropical Pacific ITCZ and enhanced wetting in the Southern Ocean.
Key Findings
- A sharp meridional dipole in Tropical Pacific precipitation change exceeds CMIP6 bounds, with intense drying north of the equator (below P5) and wetting south of it (above P95).
- IFS-FESOM projects stronger precipitation increases in the Southern Ocean and parts of the Arctic than 95% of the CMIP6 models.
- While the magnitude of change differs, the sign of change in key drying regions like the Mediterranean and Southern Africa is consistent with the CMIP6 median.
Spatial Patterns
The most prominent pattern is the zonally elongated banding in the tropics, where IFS-FESOM resolves a much narrower and more intense ITCZ shift than the smoother CMIP6 fields. High latitudes show broad areas of 'excessive' wetting (red in exceedance panel).
Model Agreement
The model diverges significantly in the tropics (19.5% area outside envelope), likely due to resolution differences. However, it agrees well with the CMIP6 ensemble on the broad thermodynamic signal of subtropical drying (Mediterranean, Chile, Australia) and high-latitude wetting (though IFS magnitude is larger).
Physical Interpretation
The disagreement in the tropics is likely resolution-driven; the 5 km grid allows for sharper gradients in moisture convergence and vertical velocity, resulting in narrower, more intense rain bands than coarse CMIP6 parametrizations. The specific Pacific pattern suggests a stronger southward shift or contraction of the ITCZ. The high-latitude wetting suggests a robust thermodynamic intensification of the hydrological cycle or more active storm tracks in IFS-FESOM.
Caveats
- The 10-year analysis period (2040-2049) is short, meaning internal variability (e.g., decadal ENSO or IOD phasing) could conflate with the forced climate change signal, particularly in the Tropical Pacific.
- The high f_out (19.5%) indicates structural differences, but 'exceedance' here likely reflects added value in resolving sharp dynamical features rather than model error.
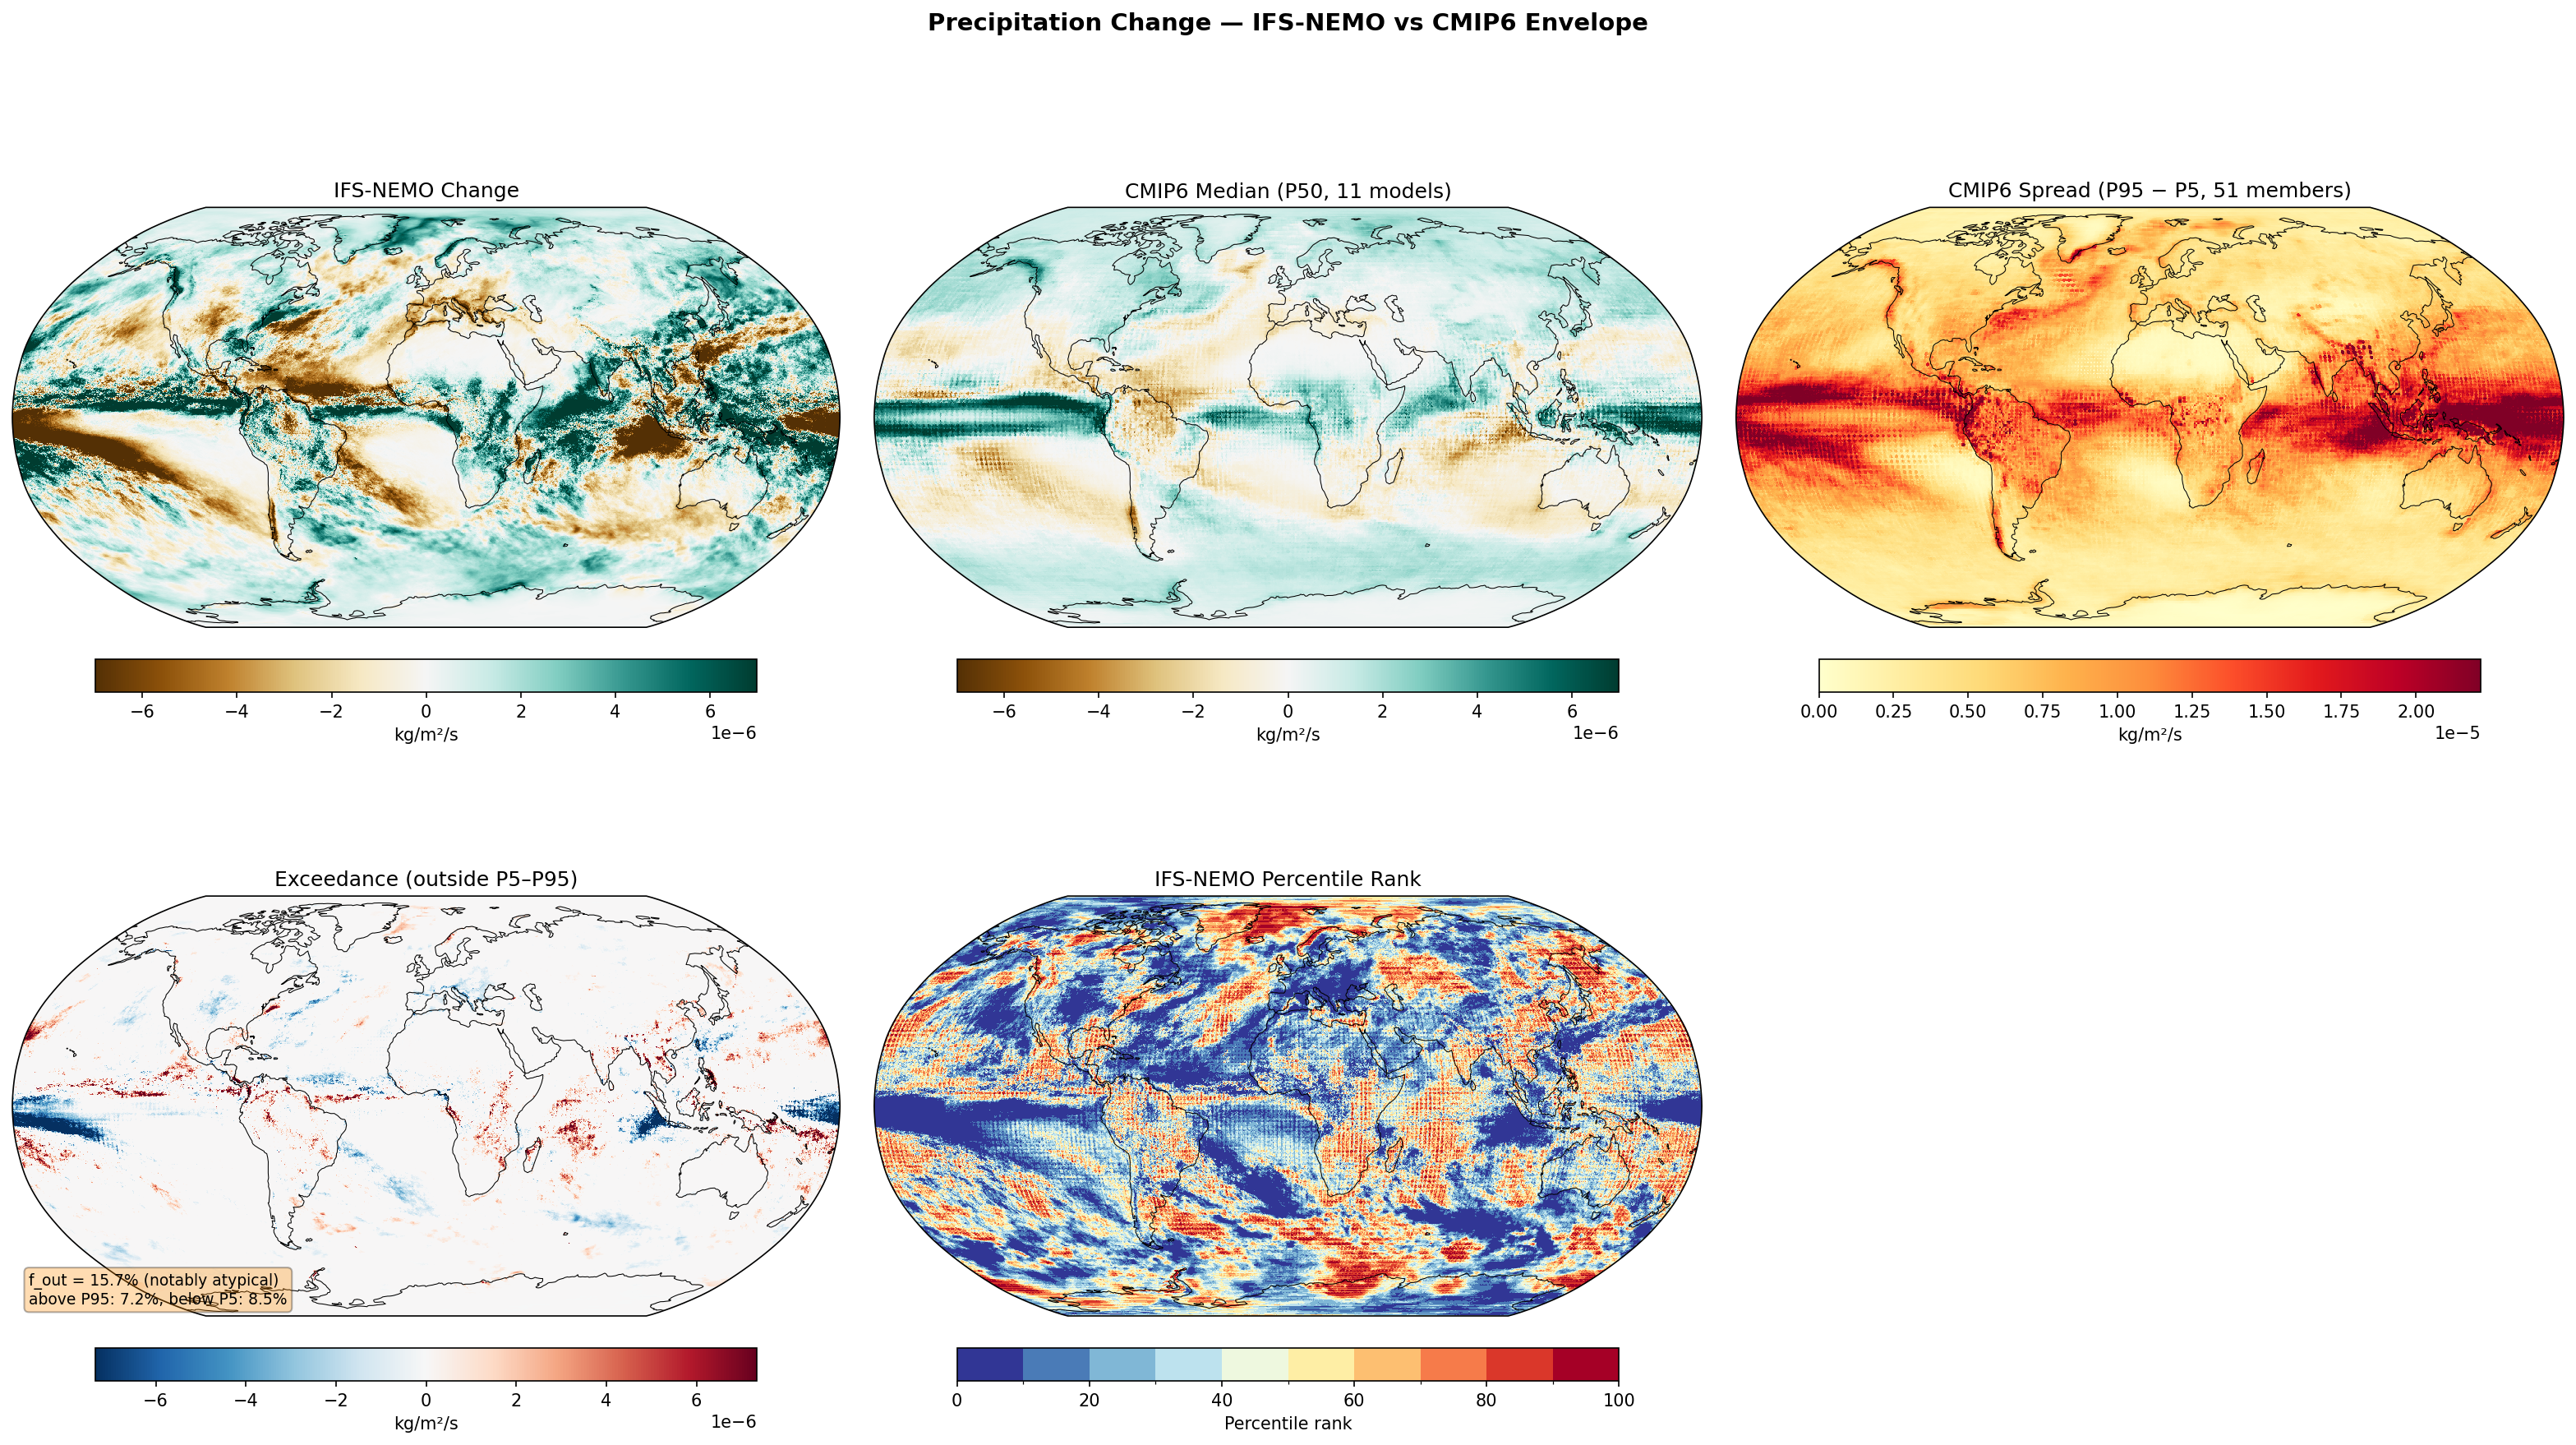
Precipitation Change — IFS-NEMO vs CMIP6 Envelope f_out 15.7%
Envelope Metrics
| f_out (outside P5–P95) | 15.7% notably atypical |
|---|---|
| Above P95 | 7.2% |
| Below P5 | 8.5% |
| CMIP6 ensemble | 11 models, 51 members |
| Variables | avg_tprate, avg_ie |
|---|---|
| Models | ifs-nemo |
| Units | kg/m2/s |
| Baseline | 1990-2014 |
| Future | 2040-2049 |
| Method | Future mean minus historical mean of avg_tprate. Compared to CMIP6 percentile envelope (P5, P50, P95). |
Summary high
IFS-NEMO exhibits a sharpened hydrological cycle response compared to CMIP6, with notably atypical precipitation changes (f_out = 15.7%) concentrated in the tropical rain belts and North Atlantic.
Key Findings
- IFS-NEMO shows a globally atypical response (15.7% area outside CMIP6 envelope), split fairly evenly between regions wetter (7.2% > P95) and drier (8.5% < P5) than the ensemble.
- Tropical precipitation changes are significantly sharper than the CMIP6 median, with dipole patterns in the Exceedance map indicating meridional shifts or narrowing of the ITCZ/SPCZ not captured by coarser models.
- A distinct region in the North Atlantic (40°N–60°N) falls below the CMIP6 P5 threshold, showing drying or lack of wetting where the CMIP6 ensemble typically projects wetting.
Spatial Patterns
The model projects intense wetting along the Equatorial Pacific and high latitudes, contrasting with strong drying over the Mediterranean, Amazon, and subtropical ocean gyres. The spatial structure is highly granular, reflecting resolved mesoscale features and orographic interactions absent in the smoother CMIP6 median.
Model Agreement
Broad agreement exists on large-scale zonal changes (wetting high latitudes, drying subtropics), but IFS-NEMO diverges significantly at dynamical boundaries. The North Atlantic anomaly and the sharper tropical convective bands constitute the primary areas of disagreement (exceedance).
Physical Interpretation
The high resolution of IFS-NEMO allows for narrower, more intense convergence zones (ITCZ) than standard CMIP6 models, resulting in 'outlier' values at the flanks of these zones. The North Atlantic anomaly likely relates to differences in the North Atlantic Current path or a stronger local response to AMOC slowing (the 'warming hole' effect reducing evaporation/precipitation) in the eddy-permitting ocean component.
Caveats
- The 10-year averaging period (2040–2049) is short for precipitation, meaning internal decadal variability likely amplifies the apparent disagreement (spread) and exceedance.
- High f_out may partly result from the 'double penalty' effect where high-resolution features are spatially displaced relative to the smoothed ensemble mean.