Tier 3 Regional Dashboards CMIP6
CMIP6 Multi-Model Mean Context
Comparison with CMIP6 conventional-resolution ensemble mean (up to 8 models under SSP3-7.0, regridded to 0.25°).
Contributing models: MPI-ESM1-2-LR, GISS-E2-1-G, IPSL-CM6A-LR, ACCESS-ESM1-5, EC-Earth3, CNRM-CM6-1, AWI-CM-1-1-MR, CNRM-ESM2-1, FGOALS-g3, INM-CM5-0, MRI-ESM2-0
Synthesis
Related diagnostics
Regional Dashboard: Arctic (>66.5°N)
| Variables | avg_2t, avg_tprate, avg_tcwv, avg_tcc |
|---|---|
| Models | ifs-fesom, ifs-nemo |
| Units | K |
| Baseline | 1990-2014 |
| Future | 2040-2049 |
| Method | Area-averaged over bounding box (66.5–90.0°N, -180.0–180.0°E). HealPix equal-area cells. |
Summary high
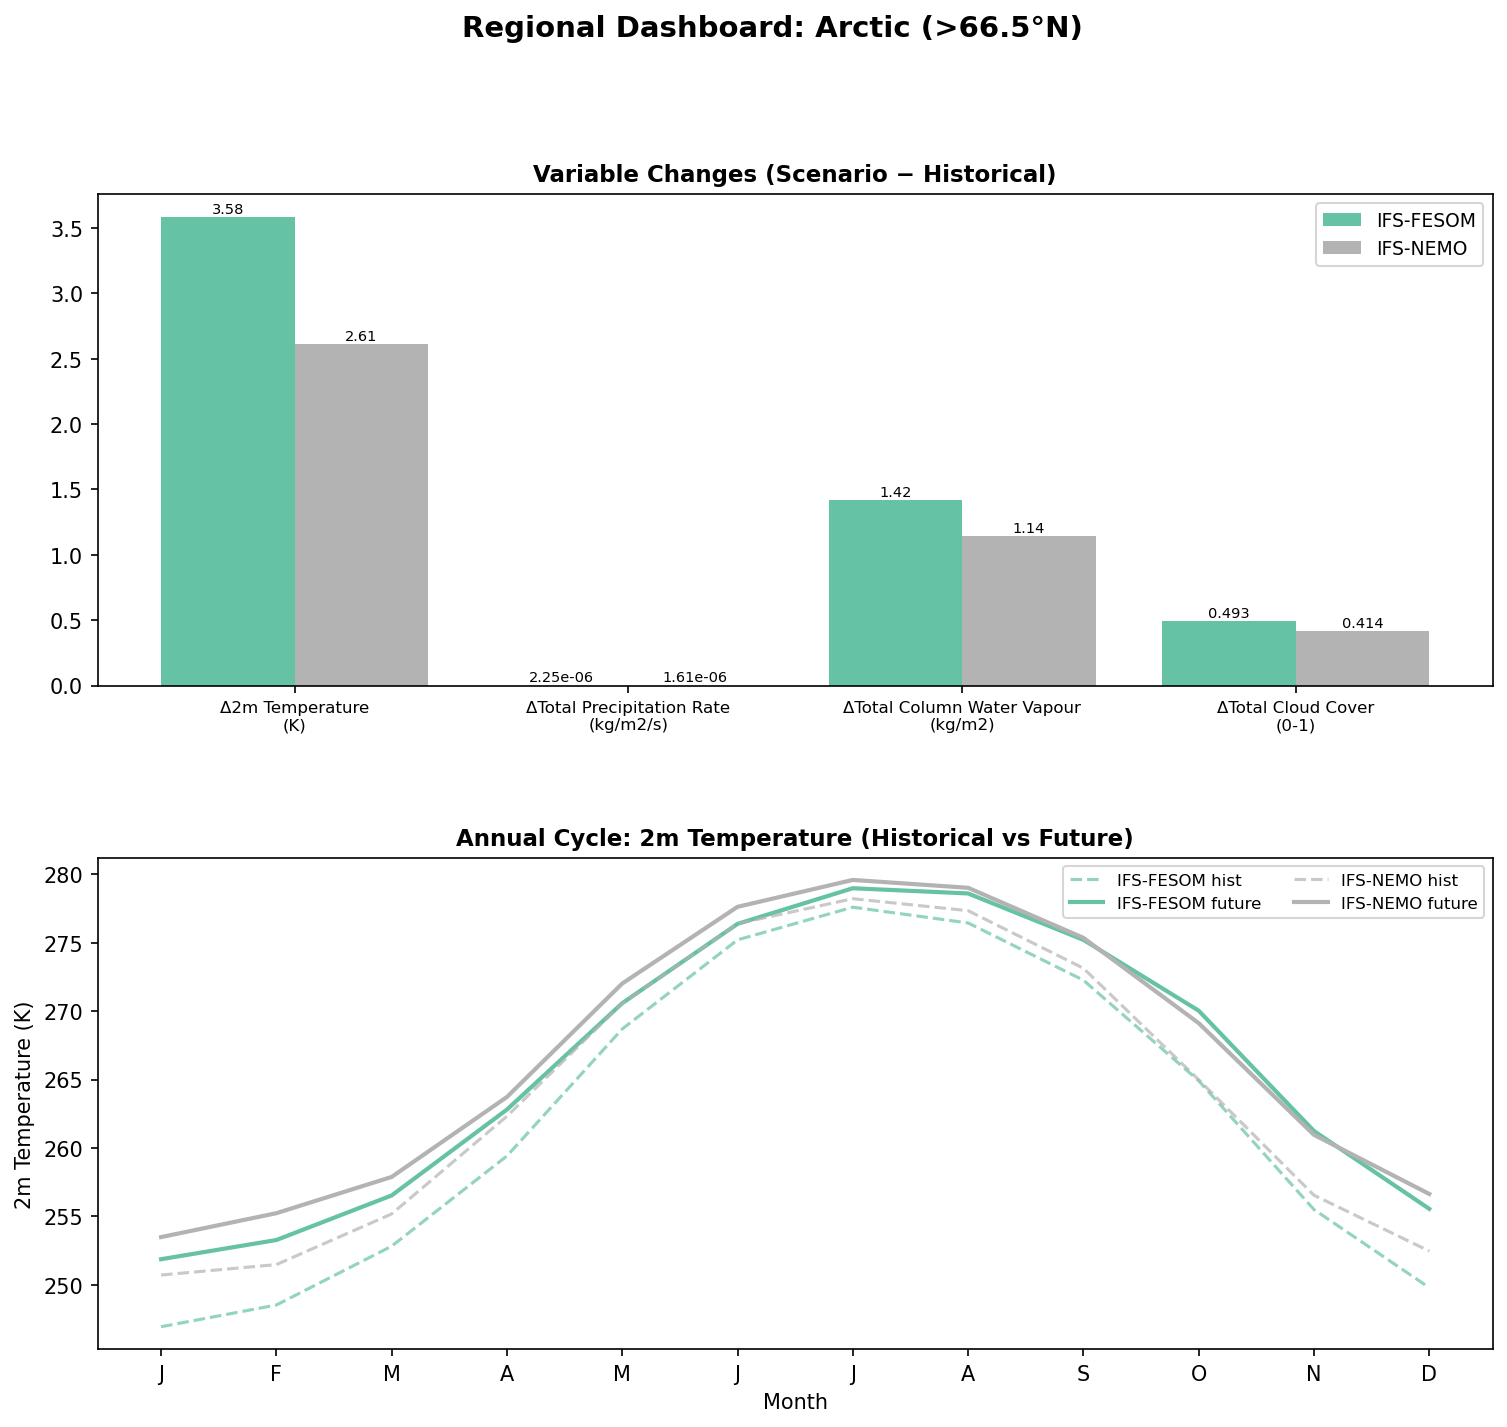
This regional dashboard for the Arctic (>66.5°N) compares projected climate changes (2040-2049 vs 1990-2014) from IFS-FESOM and IFS-NEMO against the CMIP6 ensemble, highlighting Arctic amplification and hydrological intensification.
Key Findings
- IFS-FESOM projects stronger Arctic warming (+3.58 K) than IFS-NEMO (+2.61 K); IFS-FESOM is above the CMIP6 median (+3.2 K), while IFS-NEMO is below it.
- Both models show intensification of the hydrological cycle, with increases in Total Column Water Vapour (TCWV) and Cloud Cover that scale with the warming (larger in IFS-FESOM).
- Historical winter temperatures (Jan-Mar) show a significant discrepancy: IFS-FESOM is ~4 K colder than IFS-NEMO, indicating different baseline sea-ice/ocean states.
Spatial Patterns
While the figure is area-averaged, the annual cycle reveals a strong seasonal signature: warming is heavily concentrated in winter months (Arctic Amplification), with winter increases of ~3-5 K compared to negligible summer warming. The historical winter cold bias in IFS-FESOM relative to IFS-NEMO suggests different initial sea-ice conditions.
Model Agreement
Both DestinE models fall within the CMIP6 P5-P95 spread for all variables. IFS-FESOM aligns closely with the CMIP6 median for temperature and exceeds it for TCWV, while IFS-NEMO predicts more conservative changes, lying in the lower half of the CMIP6 distribution for temperature and moisture.
Physical Interpretation
The results are consistent with Arctic Amplification mechanisms. The stronger warming in IFS-FESOM likely stems from a stronger ice-albedo or sea-ice insulation feedback, facilitated by its colder, likely icier historical baseline compared to IFS-NEMO. The greater warming in IFS-FESOM drives a larger increase in atmospheric moisture capacity (Clausius-Clapeyron relation), reflected in the higher delta-TCWV.
Caveats
- The 'Total Cloud Cover' axis label (0-1) conflicts with the CMIP6 error bars which extend to values (e.g., +2.8) that would be physically impossible for a fractional change; these likely represent percentage changes.
- Precipitation changes are positive but appear negligible on the shared y-axis scale, requiring rescaling for detailed assessment.
Regional Dashboard: Mediterranean
| Variables | avg_2t, avg_tprate, avg_tcwv, avg_tcc |
|---|---|
| Models | ifs-fesom, ifs-nemo |
| Units | K |
| Baseline | 1990-2014 |
| Future | 2040-2049 |
| Method | Area-averaged over bounding box (30.0–46.0°N, -6.0–36.0°E). HealPix equal-area cells. |
Summary high
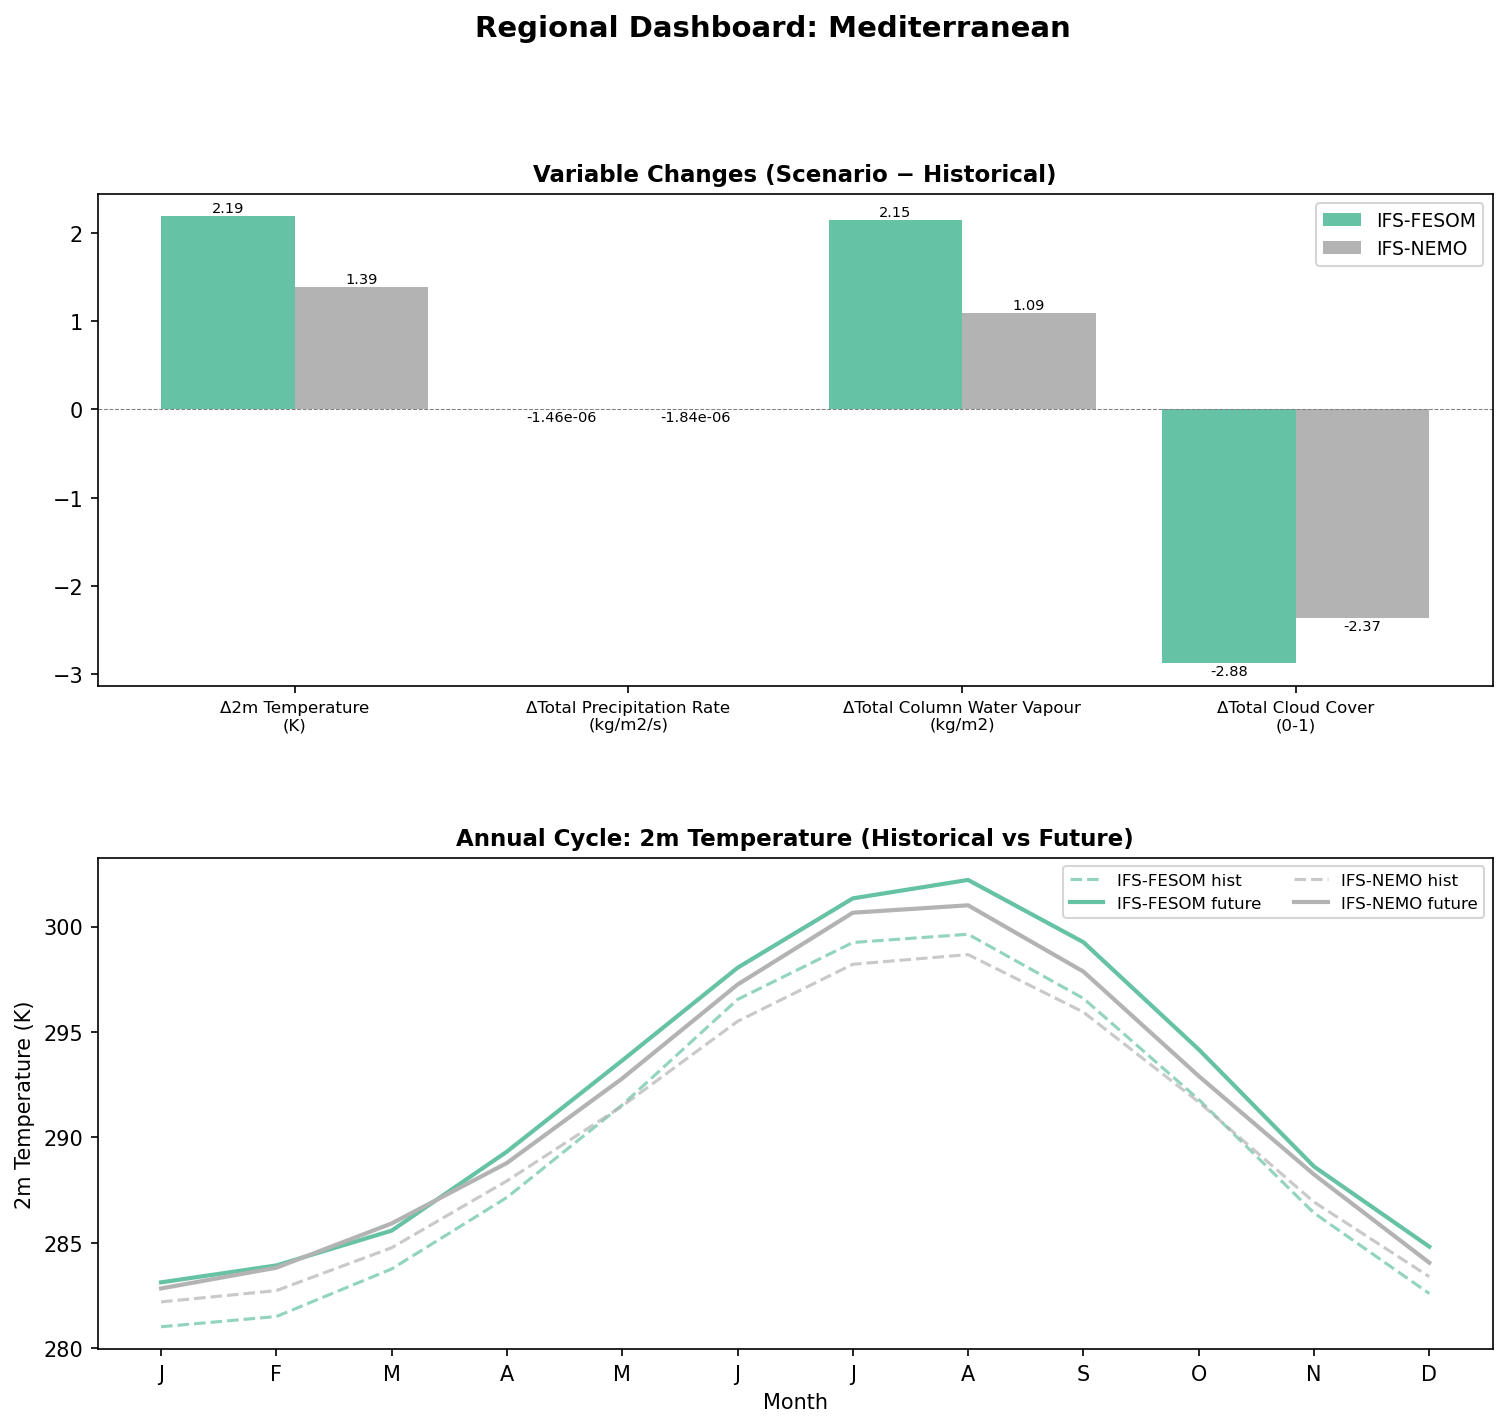
This regional dashboard for the Mediterranean (30–46°N, -6–36°E) displays projected changes for the 2040–2049 period relative to 1990–2014. Both IFS-FESOM and IFS-NEMO project a consistent drying and warming trend, with IFS-FESOM predicting significantly stronger warming and atmospheric moistening than IFS-NEMO and the CMIP6 median.
Key Findings
- IFS-FESOM predicts a temperature increase of +2.19 K, exceeding the CMIP6 upper quartile and significantly higher than IFS-NEMO (+1.39 K), which aligns with the CMIP6 median.
- Both DestinE models project a reduction in total cloud cover (-2.88% for IFS-FESOM, -2.37% for IFS-NEMO), which is stronger than the CMIP6 median reduction (~-1.6%).
- Precipitation decreases in both models (~-1.5 to -1.8e-6 kg/m²/s), confirming the robust Mediterranean drying signal found in CMIP6.
- IFS-FESOM exhibits a larger seasonal amplitude in the historical baseline (colder winters, warmer summers) compared to IFS-NEMO.
Spatial Patterns
While the figure presents spatially aggregated data, the results represent the Mediterranean basin (sea and surrounding land). The signals shown—warming, drying, and cloud reduction—are characteristic of the projected intensification of summer anti-cyclonic conditions in this region.
Model Agreement
There is complete sign agreement across IFS-FESOM, IFS-NEMO, and the CMIP6 ensemble for all variables: increasing Temperature and Water Vapour; decreasing Precipitation and Cloud Cover. However, magnitude disagreement is notable: IFS-FESOM acts as a 'hotter' member, lying near the CMIP6 P95 for temperature and water vapour, whereas IFS-NEMO acts as a central estimate closer to the CMIP6 P50.
Physical Interpretation
The projected changes are consistent with the amplification of the Mediterranean climate change hotspot driven by northward expansion of the Hadley cell and enhanced subsidence. The reduction in cloud cover (likely low-level clouds) acts as a positive feedback, increasing surface solar radiation and amplifying warming. The higher warming in IFS-FESOM drives a correspondingly larger increase in Total Column Water Vapour via the Clausius-Clapeyron relation, despite the reduction in precipitation (which is dynamically limited).
Caveats
- The unit label for Total Cloud Cover says '(0-1)' but values are ~-2.88; these are interpreted as percentage points (absolute change * 100).
- The large difference in baseline seasonal cycle between IFS-FESOM and IFS-NEMO (bottom panel) suggests structural differences in how the ocean models regulate surface heat fluxes in this semi-enclosed basin.
Regional Dashboard: North Atlantic
| Variables | avg_2t, avg_tprate, avg_tcwv, avg_tcc |
|---|---|
| Models | ifs-fesom, ifs-nemo |
| Units | K |
| Baseline | 1990-2014 |
| Future | 2040-2049 |
| Method | Area-averaged over bounding box (30.0–65.0°N, -80.0–0.0°E). HealPix equal-area cells. |
Summary high
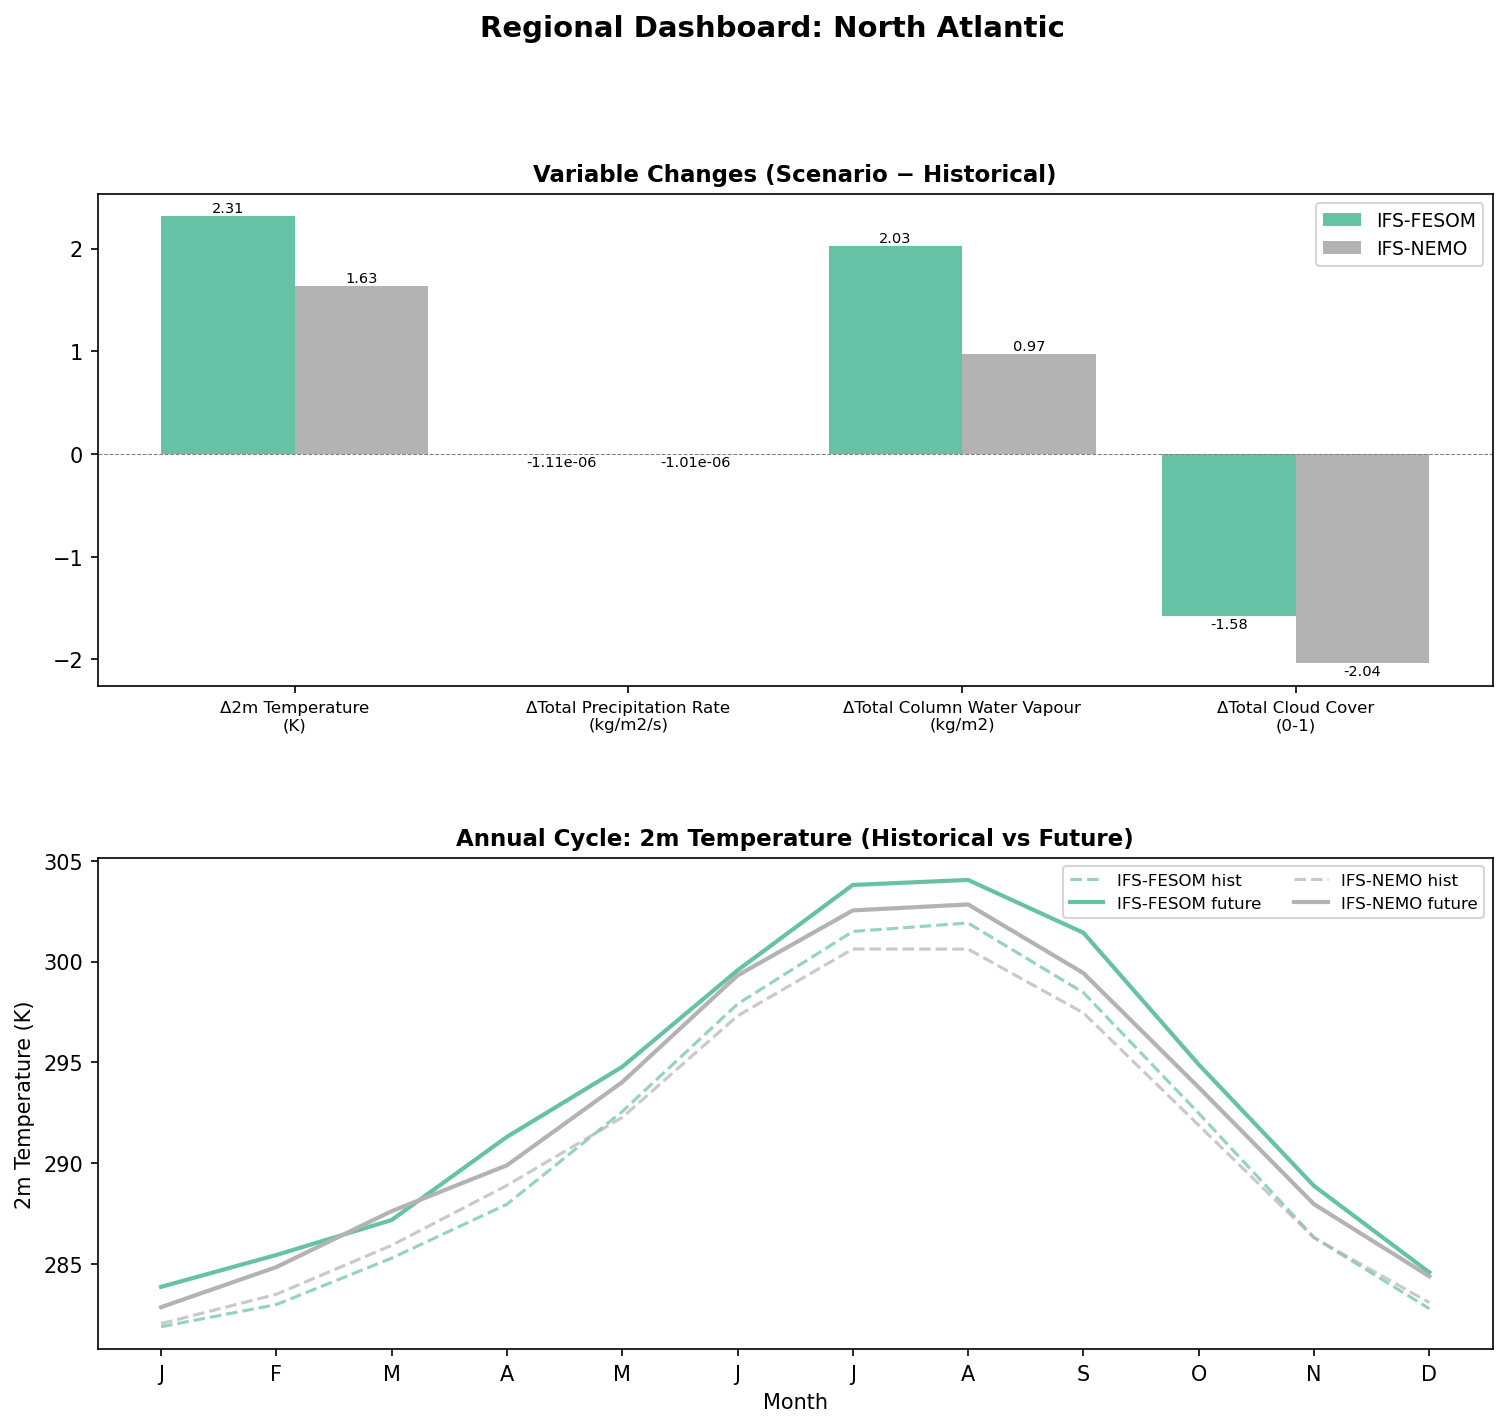
This North Atlantic regional dashboard highlights a strong warming signal in the high-resolution DestinE models, particularly IFS-FESOM, which projects warming significantly exceeding the CMIP6 ensemble range, likely driven by strong cloud reduction feedbacks and non-linear water vapour increases.
Key Findings
- IFS-FESOM projects a surface warming of +2.31 K, which is well above the CMIP6 95th percentile (~1.9 K) and more than double the CMIP6 median (~1.1 K).
- IFS-NEMO projects +1.63 K warming, falling within the upper quartile of the CMIP6 distribution but still warmer than the multi-model median.
- Both models show a decrease in total cloud cover (IFS-FESOM: -1.58%, IFS-NEMO: -2.04%), which is stronger than the CMIP6 median reduction, suggesting a positive radiative feedback contributing to the enhanced warming.
- Total Column Water Vapour (TCWV) increases are substantially larger in IFS-FESOM (+2.03 kg/m²) compared to IFS-NEMO (+0.97 kg/m²). This is consistent with IFS-FESOM's higher baseline temperature (visible in the annual cycle) enhancing the Clausius-Clapeyron response.
- The annual cycle analysis shows a systematic warm bias in IFS-FESOM compared to IFS-NEMO in both historical and future periods, with the largest offset occurring in late summer (August-September).
Spatial Patterns
As this figure presents spatially aggregated data for the North Atlantic (30–65°N), specific spatial structures are not visible. However, the annual cycle indicates that the thermal distinctiveness of IFS-FESOM (warmer baseline) and the warming signal are persistent year-round, peaking slightly in the late summer oceanic lag period.
Model Agreement
The DestinE models agree on the direction of change for all variables: increased Temperature and TCWV, decreased Cloud Cover, and negligible change in Precipitation. They disagree on magnitude, with IFS-FESOM consistently showing higher sensitivity (warmer/moister) than IFS-NEMO. Both models sit on the 'warmer/less cloudy' side of the CMIP6 ensemble spread.
Physical Interpretation
The extreme warming in IFS-FESOM appears driven by a combination of reduced cloud cover (allowing more shortwave radiation) and a strong water vapour feedback. The large difference in $\Delta$TCWV between the models is physically consistent with the non-linearity of the Clausius-Clapeyron relation: because IFS-FESOM has a warmer historical baseline than IFS-NEMO, a similar relative warming results in a much larger absolute increase in atmospheric moisture.
Caveats
- The 'Total Cloud Cover' axis label (0-1) is likely incorrect; values like -2.04 suggest the unit is percentage points (0-100 scale).
- Precipitation changes are exceptionally small (~-1e-6 kg/m²/s), indicating that despite the thermodynamic changes, the dynamical drivers of mean precipitation in this region remain relatively stable in the aggregate.
Regional Dashboard: Sahel
| Variables | avg_2t, avg_tprate, avg_tcwv, avg_tcc |
|---|---|
| Models | ifs-fesom, ifs-nemo |
| Units | K |
| Baseline | 1990-2014 |
| Future | 2040-2049 |
| Method | Area-averaged over bounding box (10.0–20.0°N, -18.0–40.0°E). HealPix equal-area cells. |
Summary medium
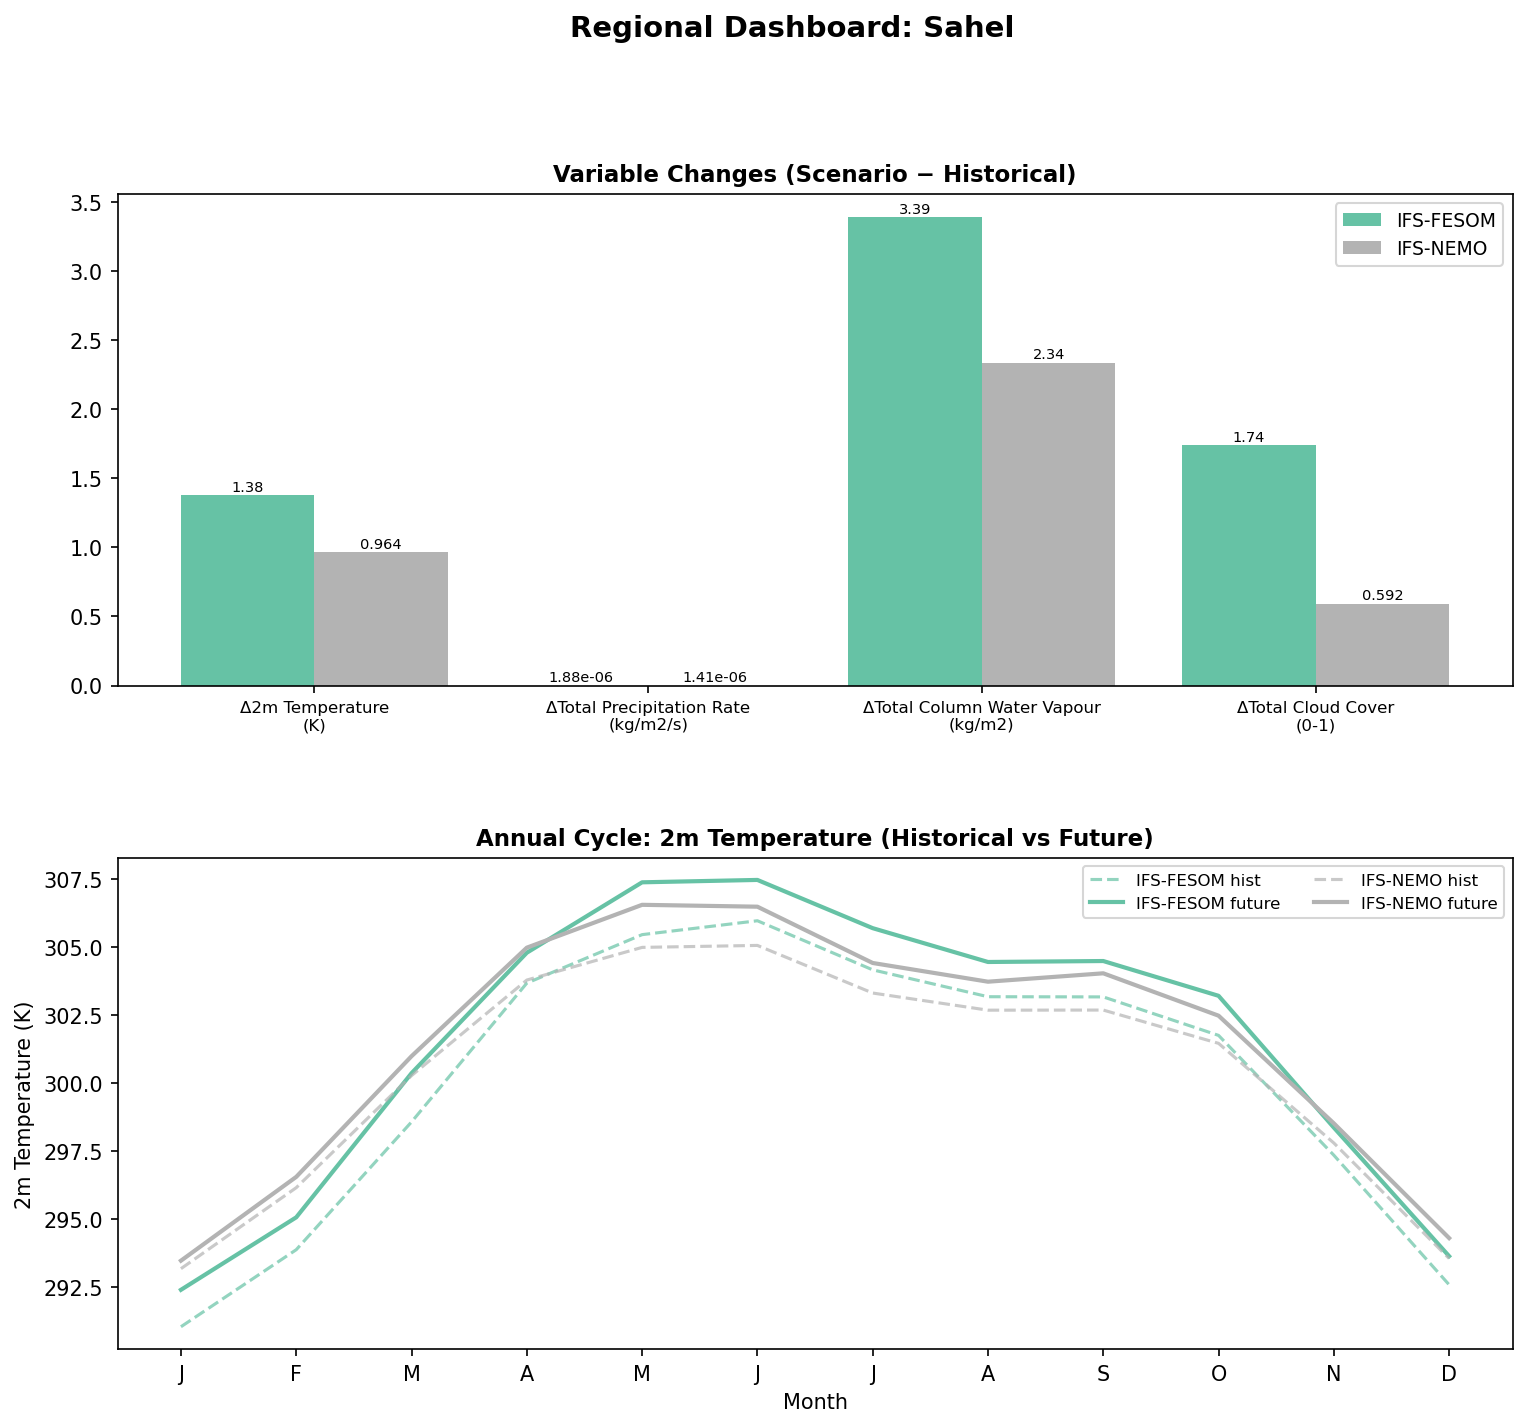
Regional analysis for the Sahel (10–20°N) showing projected changes in hydro-thermodynamic variables and the seasonal temperature cycle. Both DestinE models predict a warmer, moister, and cloudier future, though with lower warming magnitudes than the CMIP6 median.
Key Findings
- DestinE models project moderate warming (+0.96 K for IFS-NEMO, +1.38 K for IFS-FESOM), which is notably lower than the CMIP6 median (~1.6 K); IFS-NEMO falls near the CMIP6 5th percentile.
- IFS-FESOM predicts a strong increase in Total Cloud Cover (+1.74 units, likely %), lying at the upper extreme (P95) of the CMIP6 envelope, while the CMIP6 median suggests little to no change.
- Total Column Water Vapour increases in both models (+2.34 to +3.39 kg/m²), scaling with the temperature change, though IFS-FESOM is significantly moister and more sensitive than IFS-NEMO.
- Annual cycle analysis reveals a systematic cold offset in IFS-FESOM compared to IFS-NEMO during the winter/dry season (Jan–Mar), with a difference of ~2–3 K in baseline temperatures.
Spatial Patterns
While spatially averaged, the temporal 'pattern' in the annual cycle shows the pre-monsoon heat peak in May/June is well captured. The warming signal appears relatively consistent throughout the year, but the historical baseline difference between the two DestinE models is most pronounced in the dry season.
Model Agreement
The two DestinE models agree on the sign of change for all variables (warmer, wetter, cloudier) but differ in magnitude, with IFS-FESOM consistently showing higher sensitivity. Both models diverge from the CMIP6 median on cloud cover (DestinE positive vs CMIP6 neutral/negative) and temperature (DestinE lower warming).
Physical Interpretation
The projected increase in cloud cover and precipitation (though small) suggests an intensification or northward shift of the West African Monsoon. The associated increase in cloud albedo likely suppresses surface solar radiation, providing a negative feedback that results in reduced surface warming compared to the CMIP6 ensemble. The high resolution of DestinE models may be resolving convective cloud systems differently than coarser CMIP6 models.
Caveats
- The unit label for Total Cloud Cover is marked '(0-1)' but values (~1.74) indicate percentage points; analysis assumes percentage.
- The extremely large CMIP6 spread in cloud cover change indicates low model consensus for Sahelian cloud feedbacks.
- IFS-FESOM's cold bias in the historical dry season warrants investigation into land-surface or aerosol initialization.
Regional Dashboard: South Asian Monsoon
| Variables | avg_2t, avg_tprate, avg_tcwv, avg_tcc |
|---|---|
| Models | ifs-fesom, ifs-nemo |
| Units | K |
| Baseline | 1990-2014 |
| Future | 2040-2049 |
| Method | Area-averaged over bounding box (5.0–30.0°N, 60.0–100.0°E). HealPix equal-area cells. |
Summary high
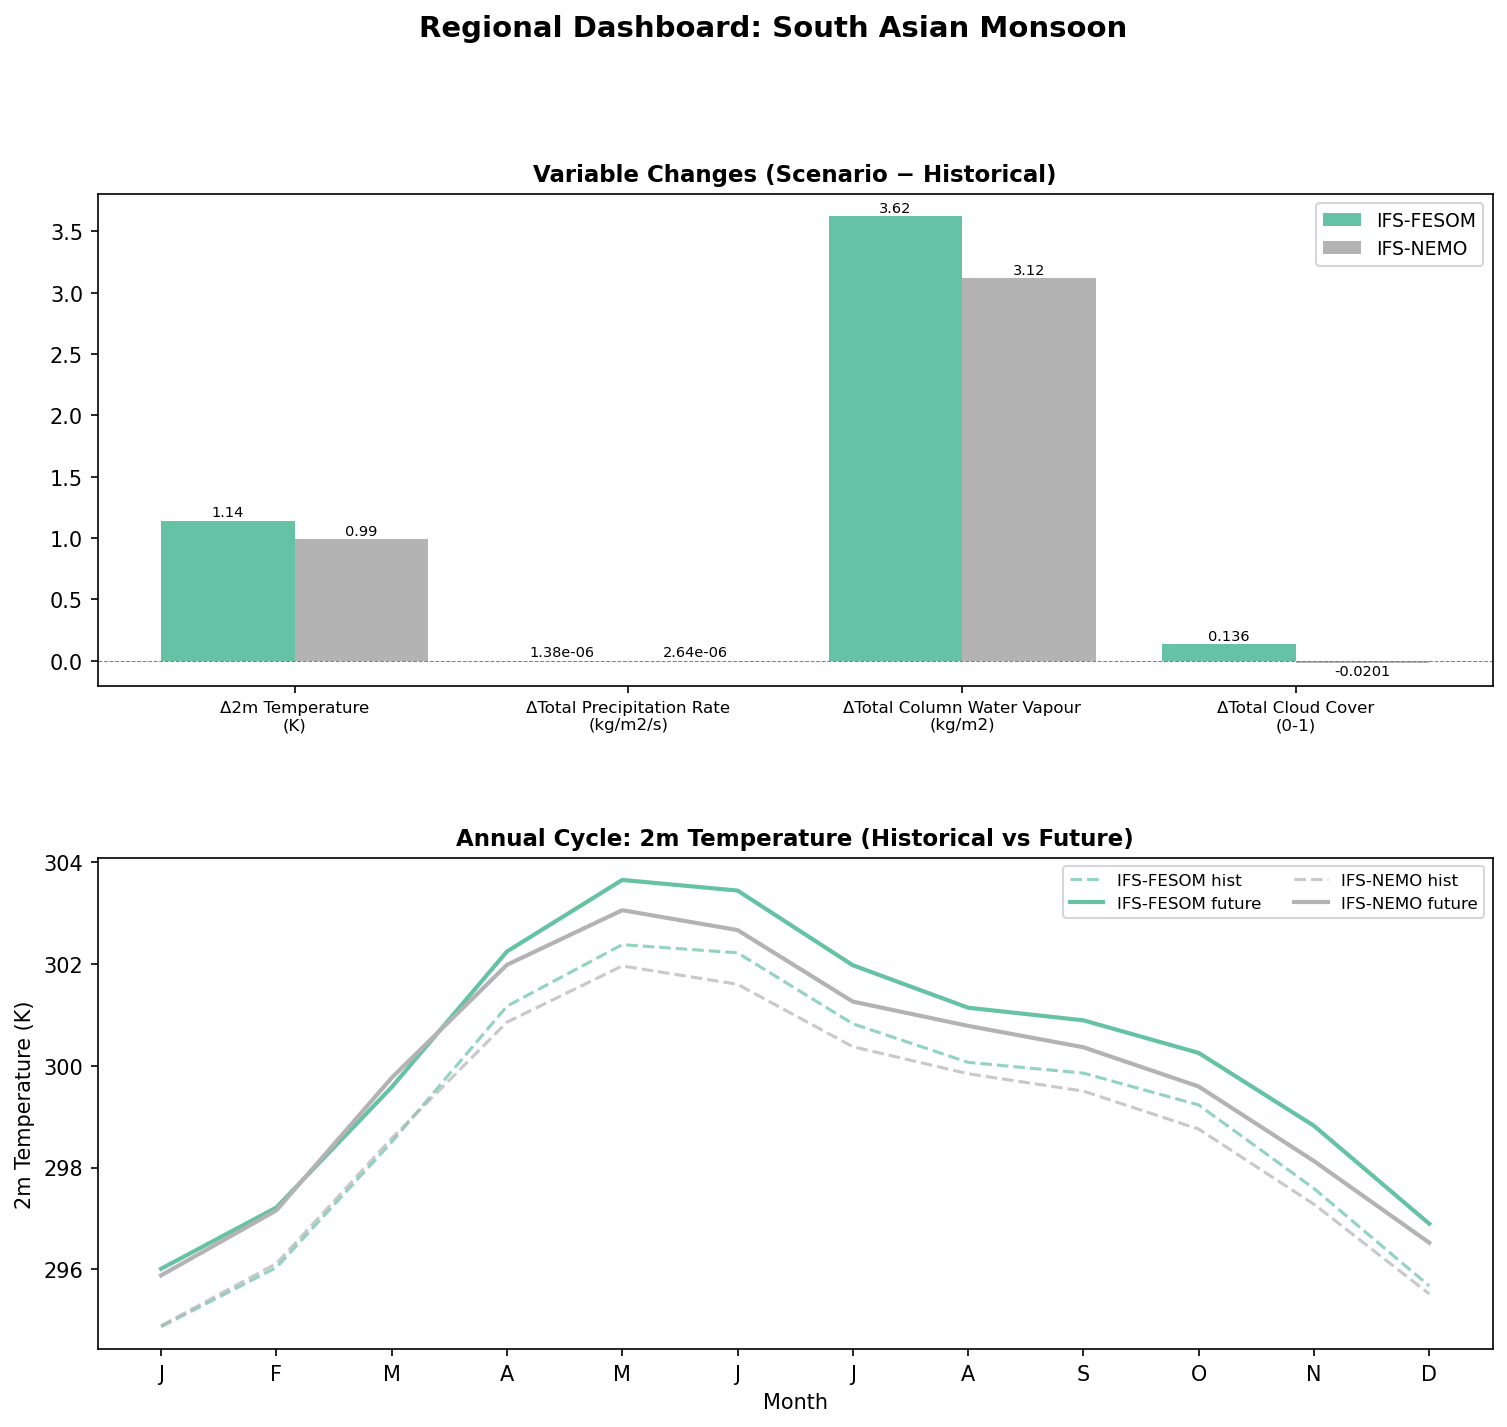
This dashboard analyses projected climate changes in the South Asian Monsoon region (5–30°N, 60–100°E) for the 2040–2049 period relative to 1990–2014, comparing IFS-FESOM and IFS-NEMO against the CMIP6 ensemble. Both models show consistent warming and moistening trends typical of monsoon intensification, though they diverge significantly in their cloud cover and precipitation efficiency responses.
Key Findings
- Both DestinE models project robust warming (~1.0–1.14 K) and increased Total Column Water Vapour (+3.1–3.6 kg/m²), aligning closely with the CMIP6 median and theoretical expectations.
- Monsoon precipitation intensity increases in both simulations, but IFS-NEMO projects a substantially larger wetting signal (2.64e-06 kg/m²/s) compared to IFS-FESOM (1.38e-06 kg/m²/s).
- A major divergence occurs in Total Cloud Cover: IFS-FESOM projects a notable increase (+0.136), while IFS-NEMO projects a slight decrease (-0.02), suggesting different dominant feedback mechanisms.
- The annual temperature cycle is well-reproduced, capturing the characteristic pre-monsoon heat peak in May and subsequent cooling during the monsoon onset (JJA).
Spatial Patterns
The bottom panel (annual cycle) reveals that IFS-FESOM maintains a persistent warm bias (~0.5–1.0 K) relative to IFS-NEMO throughout the year in both historical and future runs. The future warming shift is seasonally uniform, preserving the phase of the monsoon onset and withdrawal.
Model Agreement
Temperature and water vapour changes in both models fall well within the CMIP6 P5–P95 envelope. However, cloud cover changes show significant structural uncertainty: IFS-FESOM lies near the upper bound of the CMIP6 range (strong cloud increase), while IFS-NEMO is closer to the lower-middle of the distribution.
Physical Interpretation
The increase in water vapour with temperature follows Clausius-Clapeyron scaling, providing the fuel for intensified monsoon rainfall. The contrast between IFS-FESOM (higher cloud increase, lower precipitation increase) and IFS-NEMO (lower cloud change, higher precipitation increase) suggests differences in convective parameterization or cloud microphysics—IFS-NEMO appears more efficient at converting moisture to rainfall, potentially reducing cloud lifetime or cover compared to IFS-FESOM.
Caveats
- The regional average may mask shifts in the spatial location of the monsoon trough or rainfall bands.
- The divergence in cloud feedbacks represents a significant source of uncertainty for local surface energy budgets.
Regional Dashboard: Southern Ocean
| Variables | avg_2t, avg_tprate, avg_tcwv, avg_tcc |
|---|---|
| Models | ifs-fesom, ifs-nemo |
| Units | K |
| Baseline | 1990-2014 |
| Future | 2040-2049 |
| Method | Area-averaged over bounding box (-70.0–-50.0°N, -180.0–180.0°E). HealPix equal-area cells. |
Summary high
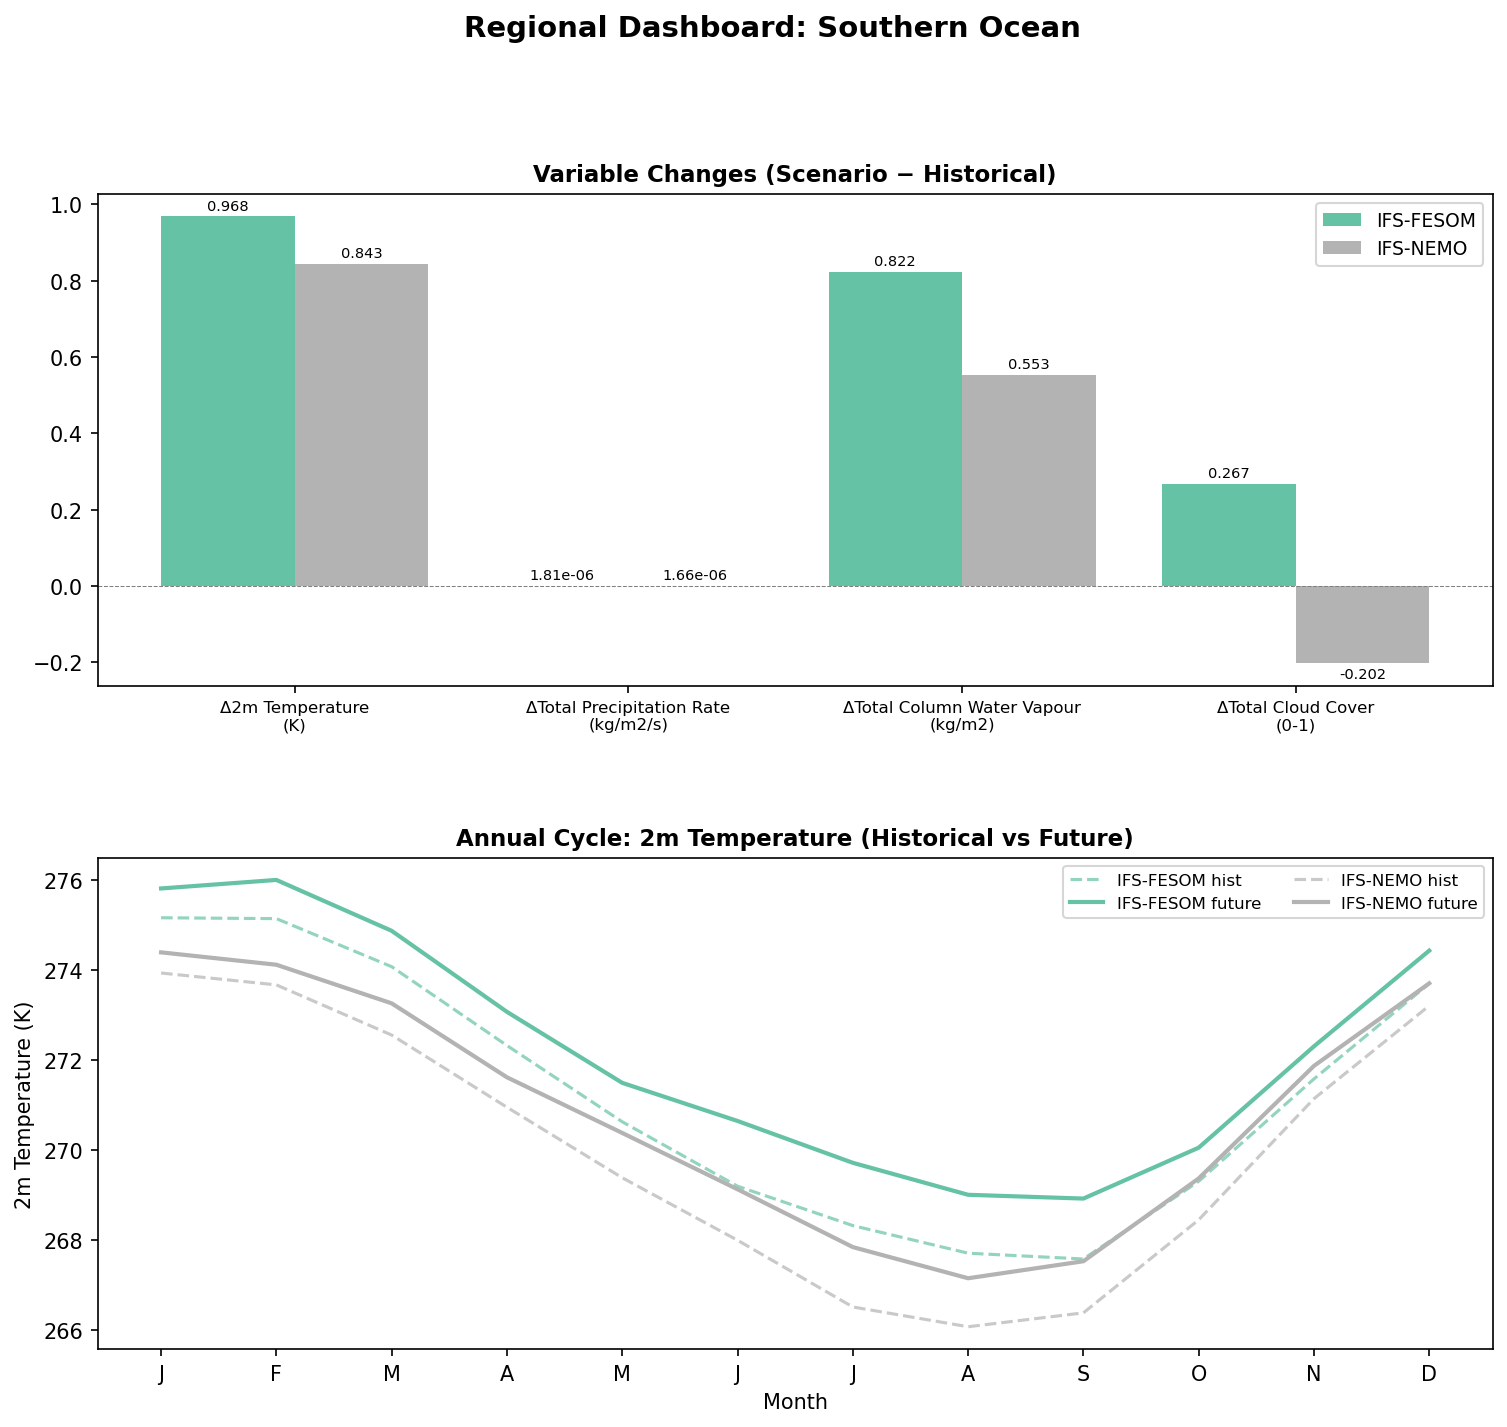
This dashboard for the Southern Ocean (-70° to -50°N) demonstrates strong model agreement on thermal and hydrological changes but a striking contradiction in cloud cover response between the two DestinE configurations. While both models project warming (~0.9 K) closely aligned with the CMIP6 median, IFS-FESOM predicts a massive increase in cloud cover (+0.267) whereas IFS-NEMO predicts a substantial decrease (-0.202).
Key Findings
- Temperature projections are robust: IFS-FESOM (+0.97 K) and IFS-NEMO (+0.84 K) agree closely with the CMIP6 median, reflecting the expected delayed warming of the Southern Ocean.
- Cloud cover shows opposite signs: IFS-FESOM projects a large increase (+0.267 fraction), while IFS-NEMO projects a large decrease (-0.202 fraction); both deviations are significant relative to the small positive CMIP6 median.
- Hydrological intensification is consistent: Both models show increased precipitation and total column water vapour (TCWV), though IFS-FESOM moistens more strongly (+0.82 kg/m²) than IFS-NEMO (+0.55 kg/m²).
- Systematic Bias: The annual cycle shows IFS-FESOM is systematically warmer (by ~1–1.5 K) than IFS-NEMO throughout the year in both historical and future periods.
Spatial Patterns
N/A (Regionally aggregated statistics provided).
Model Agreement
High agreement on the sign and magnitude of thermodynamic changes (Temperature, Precipitation, Water Vapour), with both DestinE models falling well within the CMIP6 P5-P95 range for temperature. Complete disagreement on cloud cover dynamics, with the two models defining opposite extremes of the response spectrum.
Physical Interpretation
The moderate warming (compared to global averages) is consistent with deep ocean heat uptake and Ekman pumping typical of the Southern Ocean. The divergence in cloud cover is physically significant; IFS-FESOM's increase suggests a dominance of thermodynamic thickening or phase change (ice to liquid) increasing optical depth/fraction, while IFS-NEMO's decrease could imply a dynamical shift, such as a poleward jet shift reducing storm track cloudiness in this specific latitudinal band. The higher mean temperature in IFS-FESOM may be linked to lower sea-ice concentrations in the baseline compared to IFS-NEMO.
Caveats
- The magnitude of cloud cover changes (up to ~27% absolute change) is exceptionally large for a regional mean, warranting verification of whether this reflects specific cloud regimes (e.g., low clouds) or total cloud fraction.
- The CMIP6 uncertainty range for cloud cover is extremely wide (spanning approx. -0.3 to +1.1), indicating that the structural uncertainty seen in DestinE is also present across the wider CMIP6 ensemble.