Tier 1 Surface Energy Balance CMIP6 f_out 22.8%
CMIP6 Envelope Comparison
DestinE anomalies compared to the CMIP6 P5–P95 percentile envelope derived from 48 ensemble members across 11 models under SSP3-7.0.
Contributing models: ACCESS-ESM1-5, AWI-CM-1-1-MR, CNRM-CM6-1, CNRM-ESM2-1, EC-Earth3, FGOALS-g3, GISS-E2-1-G, INM-CM5-0, IPSL-CM6A-LR, MPI-ESM1-2-LR, MRI-ESM2-0
Outside CMIP6 does not mean wrong — it indicates an uncommon response within the CMIP6 distribution.
Synthesis
Related diagnostics
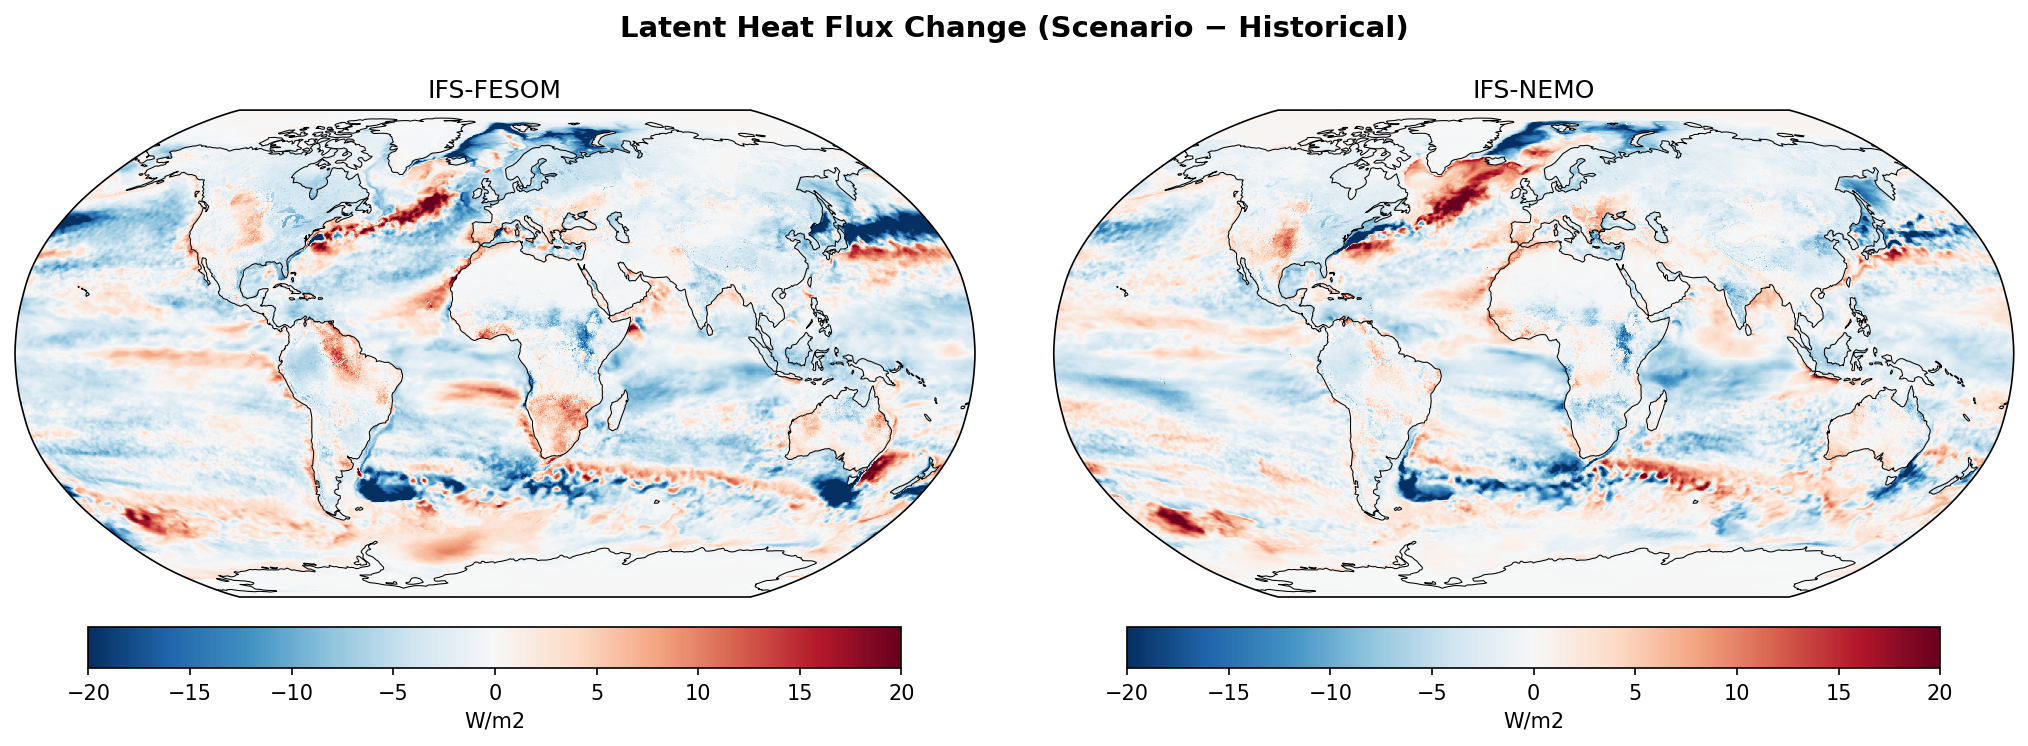
Latent Heat Flux Change
| Variables | avg_slhtf |
|---|---|
| Models | ifs-fesom, ifs-nemo |
| Units | W/m2 |
| Baseline | 1990-2014 |
| Future | 2040-2049 |
| Method | Future mean minus historical mean. |
Summary high
The figure illustrates the projected change in surface latent heat flux (LHF) between the future (2040–2049) and historical (1990–2014) periods for two high-resolution coupled models, IFS-FESOM and IFS-NEMO. Both models predict enhanced evaporation over major western boundary currents and reduced latent heat flux over key tropical rainforest regions, exhibiting high inter-model consistency.
Key Findings
- Prominent increases in latent heat flux (>15 W/m²) occur along the Gulf Stream and Kuroshio Extension, suggesting strong ocean warming and enhanced energy transfer to the atmosphere in these frontal zones.
- Significant decreases in LHF (reaching -15 to -20 W/m²) are observed over the Amazon Basin and Central Africa (Congo Basin), indicating a transition to water-limited evaporation regimes (drying) despite atmospheric warming.
- A distinct region of reduced LHF is visible in the subpolar North Atlantic (south of Greenland), consistent with the 'warming hole' phenomenon where sea surface temperatures warm less than the overlying atmosphere.
- High consistency between IFS-FESOM and IFS-NEMO, with notable differences confined largely to the Southern Ocean's eddy-rich regions.
Spatial Patterns
The ocean response is dominated by intensified flux along western boundary currents (red bands) and reductions in high-latitude subpolar gyres (blue patches). Over land, a clear contrast exists: subtropical regions like the Eastern US, Southern Brazil, and parts of East Asia show increased LHF (red), while deep tropical landmasses (Amazon, Congo) show decreases (blue). The Southern Ocean displays a complex, zonally asymmetric pattern of increases and decreases.
Model Agreement
Agreement is very high, particularly over land and the mid-to-low latitude oceans, likely due to the shared IFS atmospheric component. Disagreements are minor and localized to high-latitude oceans (Southern Ocean, Arctic margins), reflecting differences in ocean grid discretization (FESOM unstructured vs. NEMO structured) and their representation of mesoscale eddies and sea-ice dynamics.
Physical Interpretation
Ocean increases are driven thermodynamically by warmer Sea Surface Temperatures (SSTs) enhancing the vapor pressure deficit, particularly where boundary currents transport excess heat. Ocean decreases in the subpolar North Atlantic likely result from stable or cooling SSTs relative to a faster-warming atmosphere (reduced air-sea temperature difference). On land, the reduction in LHF over the Amazon and Congo suggests soil moisture depletion (drying) limits evaporation, whereas in the subtropics, sufficient moisture allows evaporation to increase with temperature (Clausius-Clapeyron scaling).
Caveats
- The analysis compares a single future decade (2040s) against a baseline, meaning internal decadal variability could amplify or dampen signals, particularly in the Southern Ocean.
- Without precipitation or soil moisture data, the attribution of land LHF decreases to 'drying' is inferred based on typical climate change responses in these regions.
Latent Heat Flux Change — IFS-FESOM vs CMIP6 Envelope f_out 22.8%
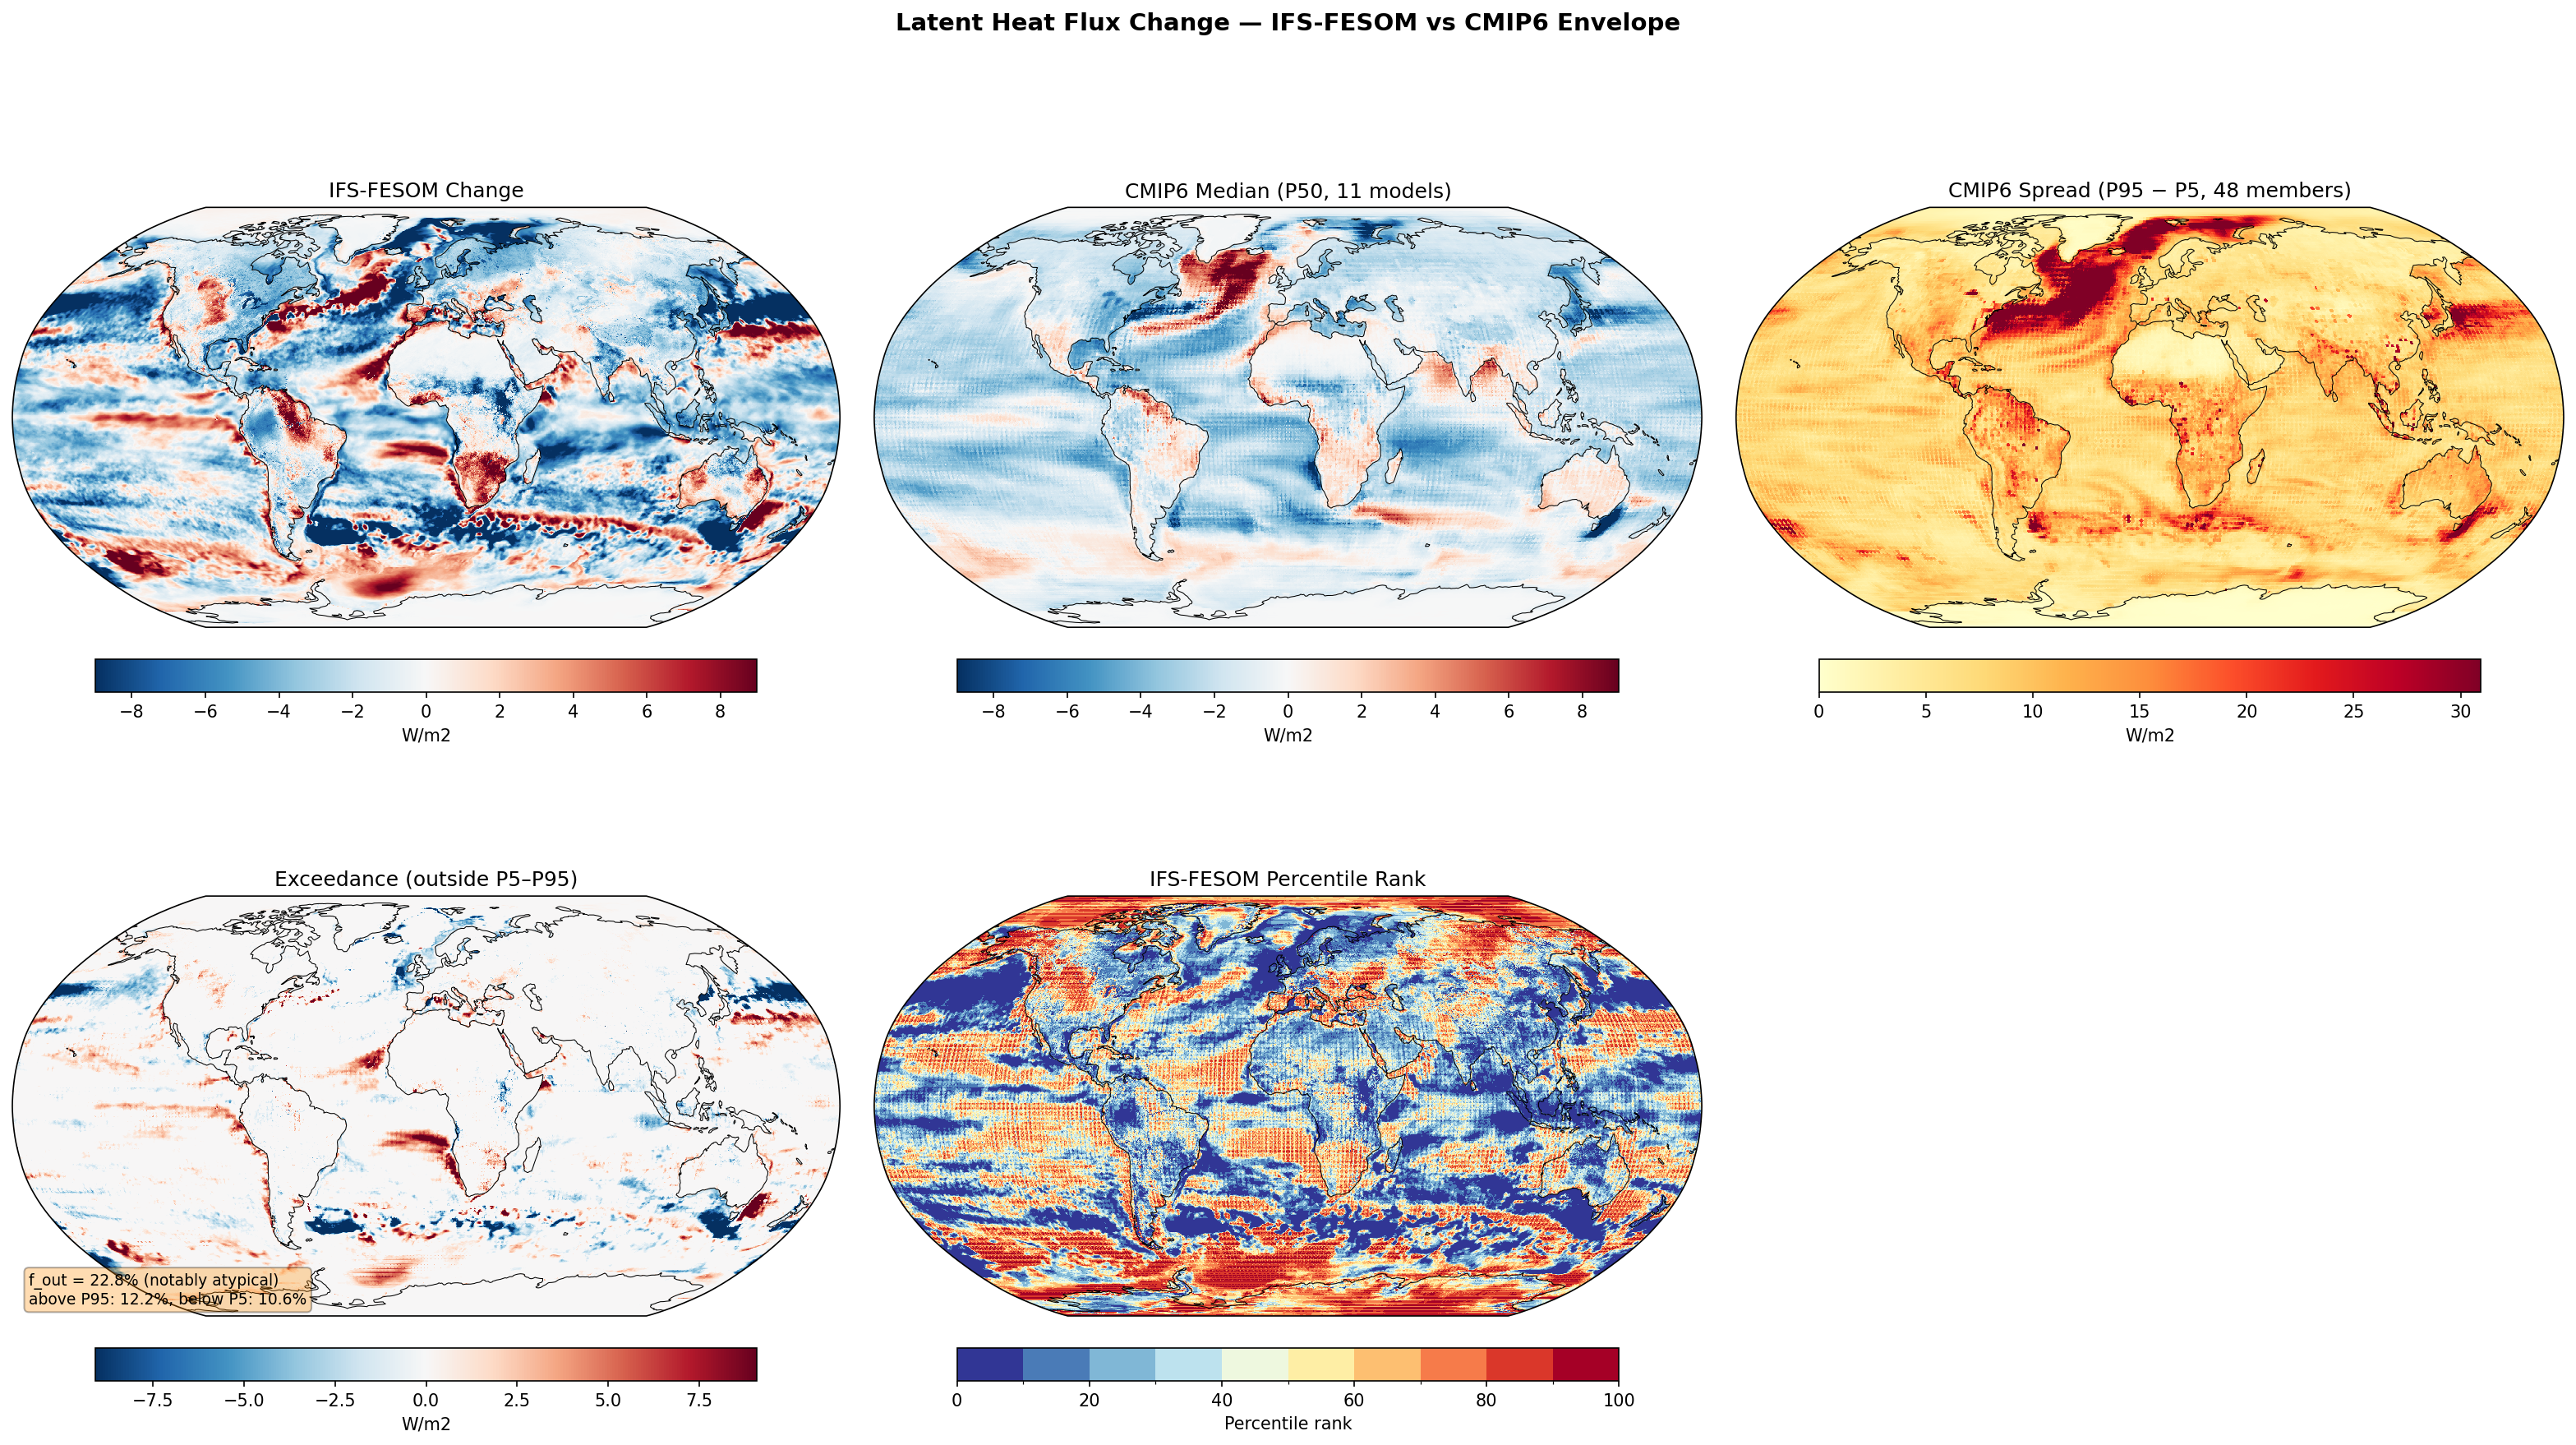
Envelope Metrics
| f_out (outside P5–P95) | 22.8% notably atypical |
|---|---|
| Above P95 | 12.2% |
| Below P5 | 10.6% |
| CMIP6 ensemble | 11 models, 48 members |
| Variables | avg_slhtf |
|---|---|
| Models | ifs-fesom |
| Units | W/m2 |
| Baseline | 1990-2014 |
| Future | 2040-2049 |
| Method | Future mean minus historical mean compared to CMIP6 percentile envelope (P5, P50, P95). |
Summary high
IFS-FESOM displays a notably atypical latent heat flux change response (f_out = 22.8%) compared to the CMIP6 ensemble, driven primarily by resolved ocean dynamics in the North Atlantic and Southern Ocean that create sharp, localized anomalies outside the smoother CMIP6 envelope.
Key Findings
- A strong dipolar exceedance pattern is evident in the North Atlantic: IFS-FESOM shows significantly higher latent heat flux increases (above P95) along the Gulf Stream extension and significantly lower flux/decreases (below P5) in the subpolar gyre compared to CMIP6.
- The Southern Ocean exhibits widespread, fine-scale alternation between exceeding P95 and falling below P5, reflecting the footprint of resolved ocean eddies absent in standard CMIP6 models.
- IFS-FESOM projects lower latent heat flux increases (or decreases) than the CMIP6 P5 threshold across broad swathes of the subtropical oceans and specific land regions like the Amazon, suggesting stronger surface drying or stability changes.
Spatial Patterns
The IFS-FESOM change field is characterized by high-frequency spatial variability and sharp gradients, particularly along western boundary currents (Gulf Stream, Kuroshio, Agulhas). This contrasts with the diffusive, smooth patterns of the CMIP6 median. The North Atlantic dipole is the most coherent large-scale deviation.
Model Agreement
While there is broad agreement on increased evaporation in high latitudes (sea ice retreat regions) and parts of the tropics, the models disagree significantly on the spatial precision of dynamic ocean features. IFS-FESOM falls outside the CMIP6 envelope in 22.8% of the domain, classifying the result as notably atypical.
Physical Interpretation
The atypical patterns are likely driven by the high-resolution ocean model (FESOM) resolving sharp SST gradients and current systems (e.g., Gulf Stream separation) that are parameterized in coarser CMIP6 models. The North Atlantic dipole suggests a distinct response of the AMOC or subpolar gyre dynamics (warming hole), leading to reduced evaporation in the subpolar region and enhanced evaporation along the current path.
Caveats
- The 2040-2049 future period is relatively near-term, meaning internal decadal variability (e.g., AMO/IPO phases) could contribute to the observed differences alongside the forced climate response.
- Differences in land surface schemes could explain the outliers over the Amazon and Africa.
Latent Heat Flux Change — IFS-NEMO vs CMIP6 Envelope f_out 18.5%
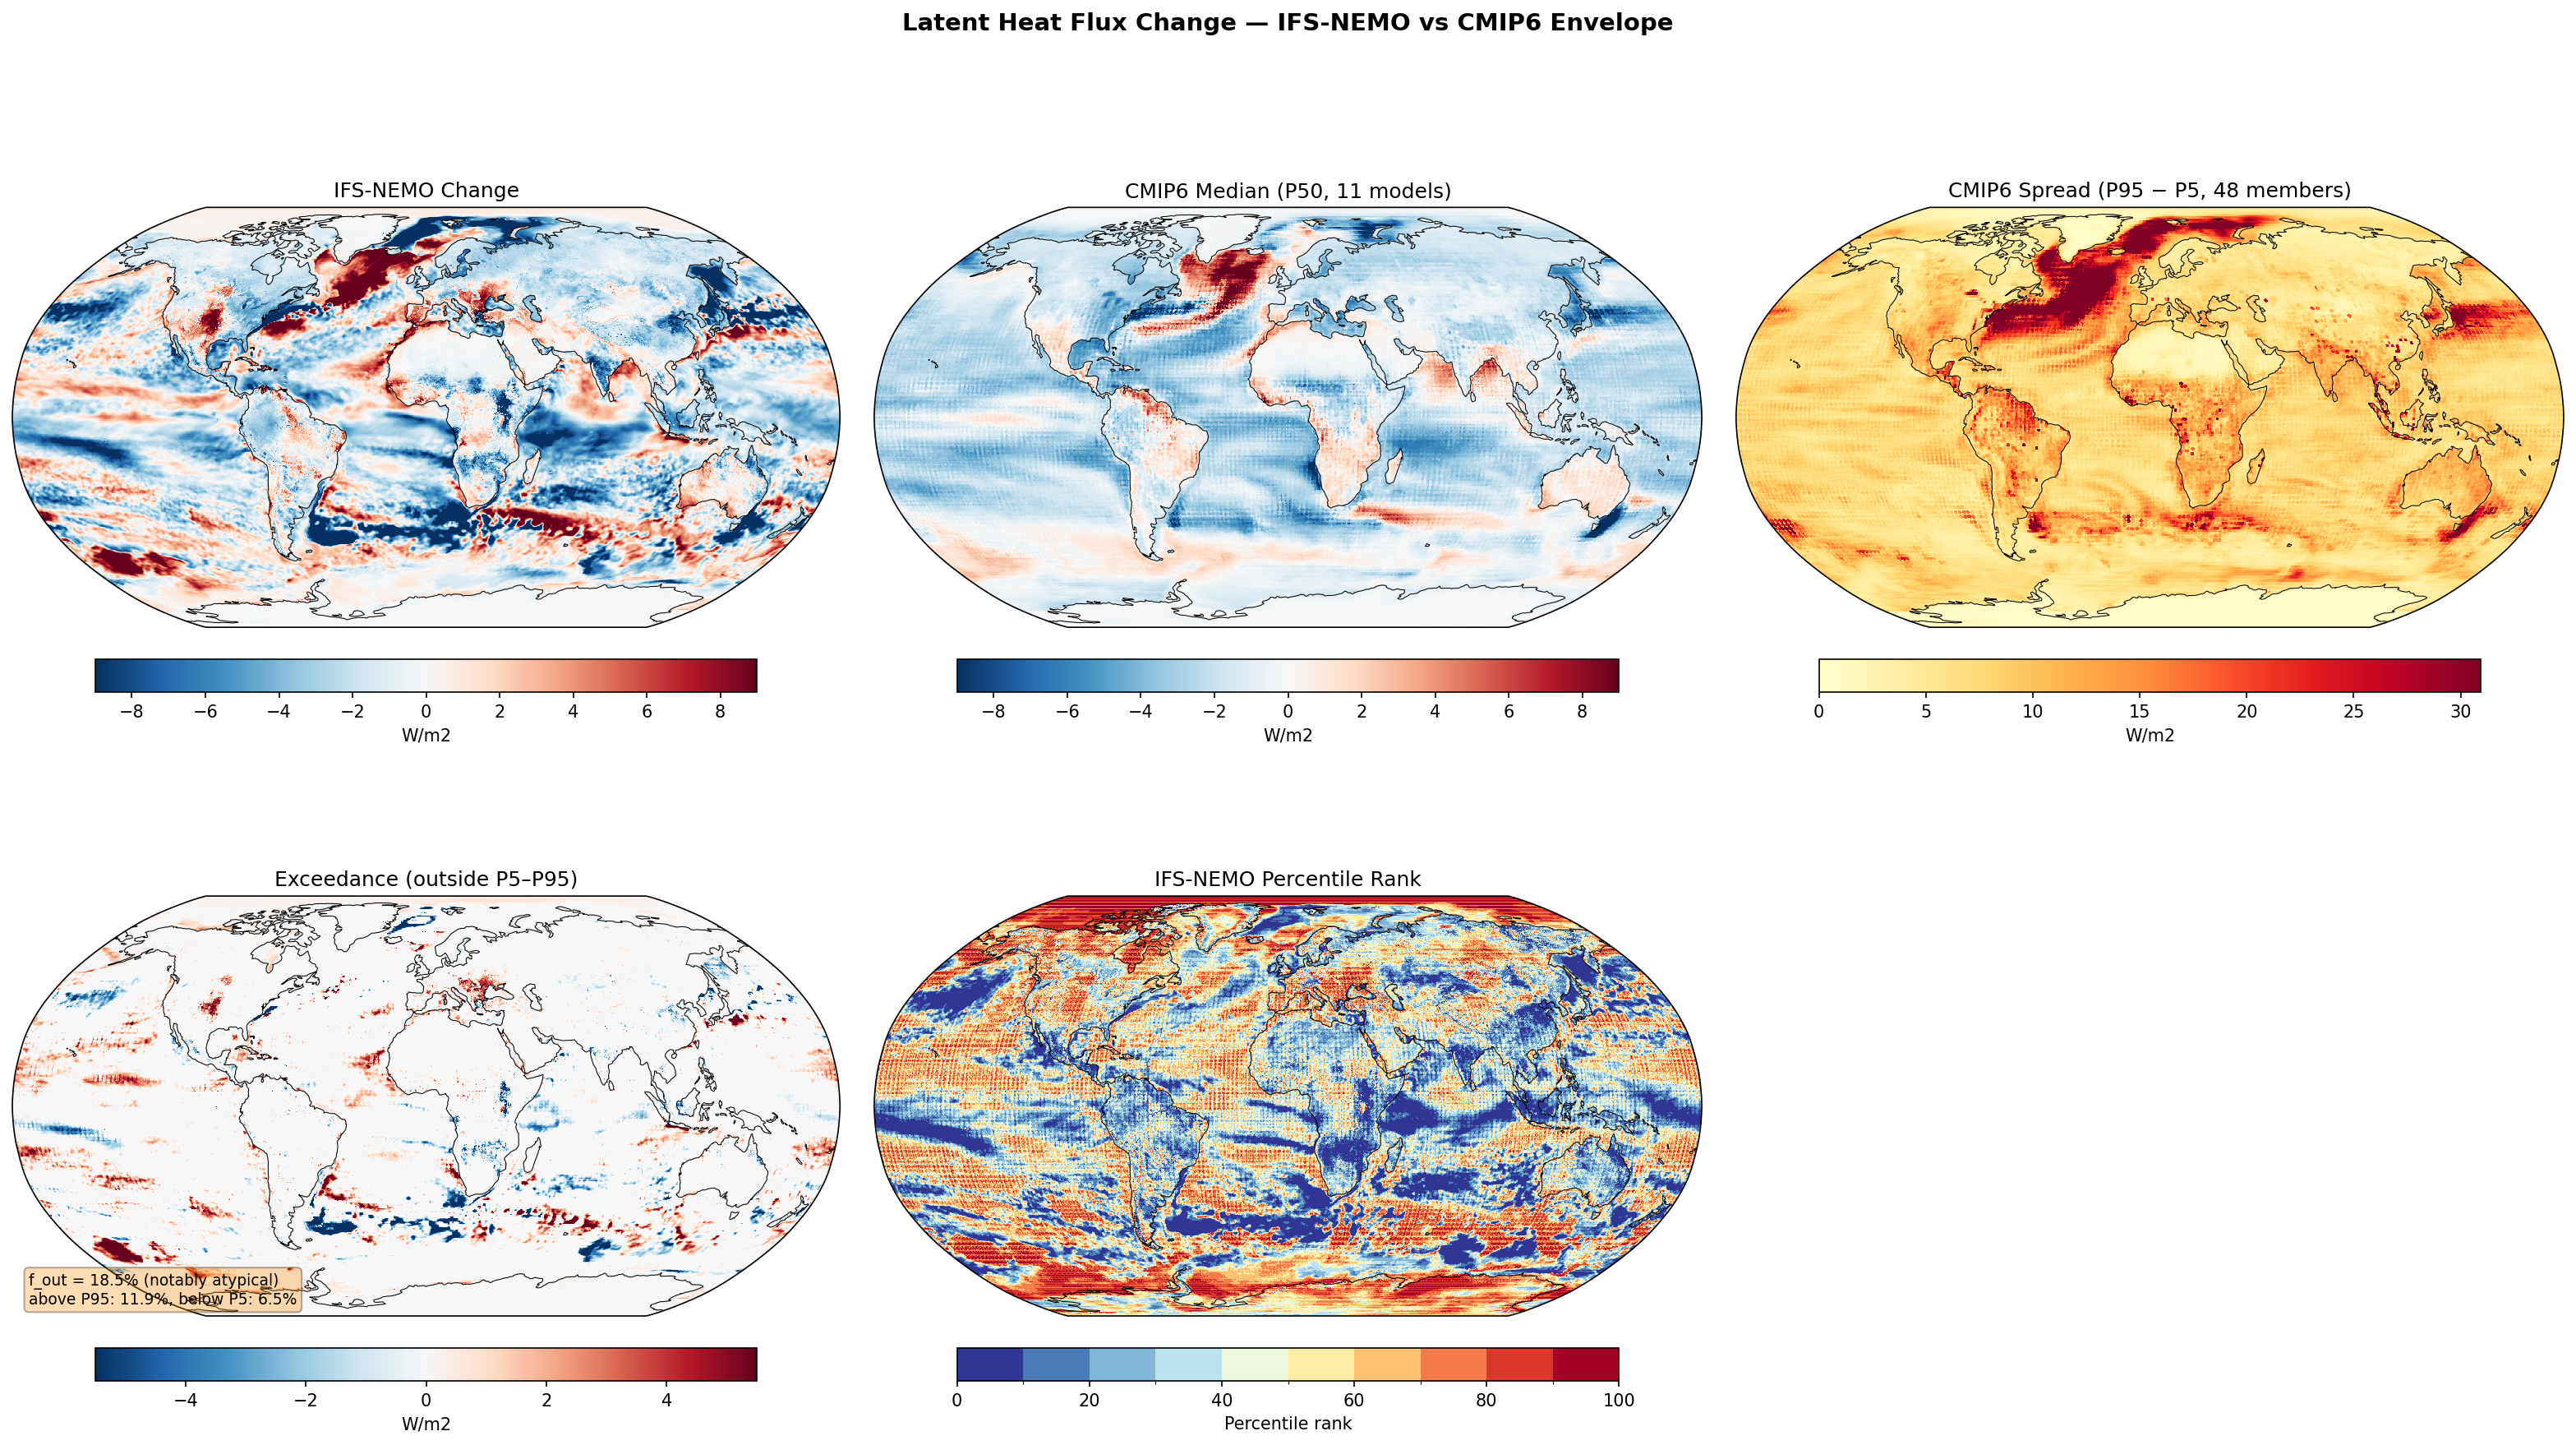
Envelope Metrics
| f_out (outside P5–P95) | 18.5% notably atypical |
|---|---|
| Above P95 | 11.9% |
| Below P5 | 6.5% |
| CMIP6 ensemble | 11 models, 48 members |
| Variables | avg_slhtf |
|---|---|
| Models | ifs-nemo |
| Units | W/m2 |
| Baseline | 1990-2014 |
| Future | 2040-2049 |
| Method | Future mean minus historical mean compared to CMIP6 percentile envelope (P5, P50, P95). |
Summary high
IFS-NEMO displays a notably atypical surface latent heat flux response (f_out = 18.5%), primarily diverging from the CMIP6 ensemble through enhanced evaporation in the North Atlantic and Southern Ocean, and suppressed evaporation in the tropical Pacific.
Key Findings
- IFS-NEMO shows a strong positive latent heat flux anomaly in the North Atlantic subpolar gyre, directly contrasting with the reduced flux trend (cooling hole) typical of the CMIP6 median.
- A prominent negative latent heat flux anomaly in the central and eastern equatorial Pacific falls below the CMIP6 P5 threshold, indicative of a La Niña-like response or cold-tongue bias relative to the ensemble.
- Widespread regions of the Southern Ocean exhibit evaporation increases exceeding the CMIP6 P95, likely associated with sea-ice edge retreat and stronger air-sea interaction in the high-resolution model.
Spatial Patterns
The model resolves fine-scale structures with sharp gradients not seen in the CMIP6 median. Notable features include a localized high-evaporation bullseye south of Greenland (red in Exceedance) and zonal bands of reduced flux in the tropics (blue in Exceedance).
Model Agreement
While there is broad agreement on increased fluxes in the mid-latitude storm tracks, IFS-NEMO significantly disagrees in the North Atlantic (exceeding P95) and Tropical Pacific (below P5). The total outlier fraction (18.5%) places the model in the 'notably atypical' category.
Physical Interpretation
The North Atlantic discrepancy suggests IFS-NEMO maintains stronger ocean heat transport or deep convection in the subpolar gyre than standard CMIP6 models, avoiding the typical AMOC-related 'warming hole'. The Pacific signal reflects a dynamic divergence: IFS-NEMO likely simulates stronger trade winds and upwelling (thermostat effect), contrasting with the 'El Niño-like' mean warming often seen in coarser CMIP6 models.
Caveats
- The 10-year averaging period (2040-2049) may conflate internal decadal variability (e.g., specific ENSO or AMV phases) with the forced climate change signal.
- Differences in sea-ice retreat timing in the Southern Ocean can generate large transient flux differences compared to the multi-model mean.
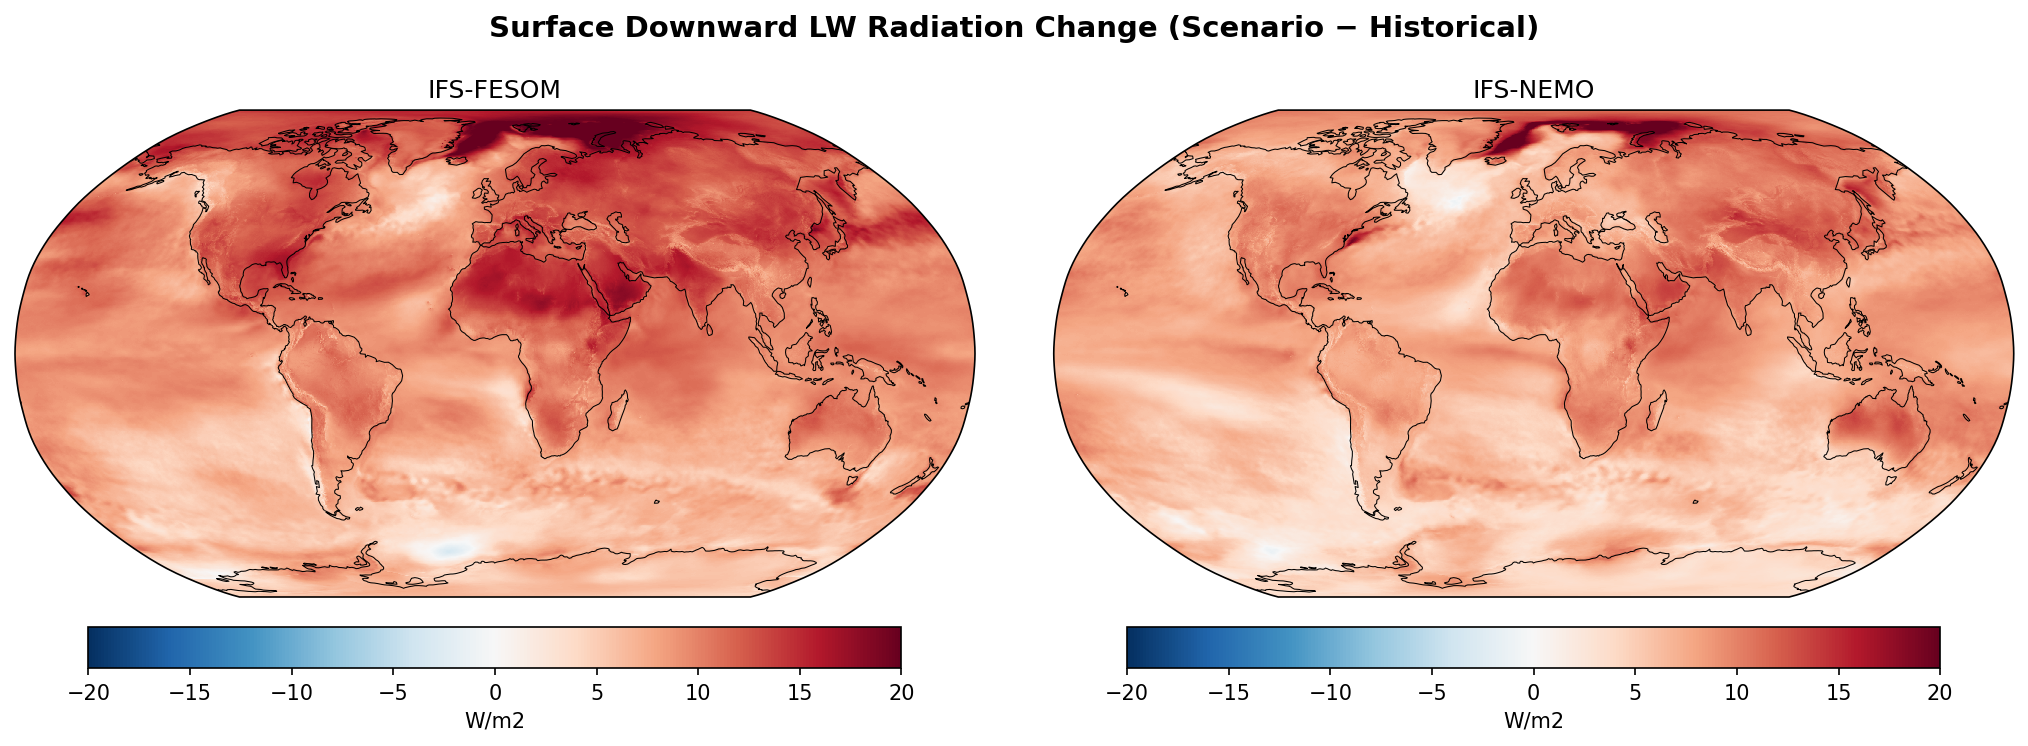
Surface Downward LW Radiation Change
| Variables | avg_sdlwrf |
|---|---|
| Models | ifs-fesom, ifs-nemo |
| Units | W/m2 |
| Baseline | 1990-2014 |
| Future | 2040-2049 |
| Method | Future mean minus historical mean. |
Summary high
IFS-FESOM and IFS-NEMO project a robust global increase in surface downward longwave radiation (SDLWR) by 2040–2049 relative to 1990–2014 under SSP3-7.0, with patterns dominated by Arctic amplification and strong land-ocean contrasts.
Key Findings
- Arctic Amplification is the dominant feature, with SDLWR increases exceeding 20 W/m² over the Arctic Ocean, linked to sea-ice retreat and boundary layer warming.
- Tropical land masses (Amazon, Central Africa) and the Tibetan Plateau exhibit enhanced radiative increases (10–15 W/m²) compared to adjacent oceans, consistent with strong water vapor feedback over warming land.
- A localized region of decreasing or neutral SDLWR is visible in the Southern Ocean (Weddell Sea sector) in both models, contrasting with the general global trend.
Spatial Patterns
The maps show a widespread positive anomaly (5–15 W/m²) globally. The strongest signals (>20 W/m²) are concentrated in the Arctic. Notable minima (weaker increases or slight decreases) occur in the North Atlantic 'warming hole' region and the Weddell Sea. Land regions generally show stronger increases than ocean regions at similar latitudes.
Model Agreement
Agreement is remarkably high between IFS-FESOM and IFS-NEMO. The spatial structure of the radiative changes is nearly identical, implying that the atmospheric component (OpenIFS)—which determines cloud and water vapor radiative effects—dominates the response, while differences in ocean coupling (FESOM vs. NEMO) play a minor role for this specific variable.
Physical Interpretation
The global rise in SDLWR is the direct signature of the enhanced greenhouse effect and atmospheric warming. The Arctic maximum is driven by the sea-ice insulation feedback: loss of ice exposes warmer ocean to the atmosphere, increasing temperature and moisture, which strongly enhances downward radiation. Tropical land maxima are likely driven by the water vapor feedback (Clausius-Clapeyron), as warmer air over land supports higher specific humidity and thus greater atmospheric emissivity.
Caveats
- The 10-year averaging period (2040–2049) is relatively short, meaning internal decadal variability could influence localized features like the Southern Ocean anomaly.
- The analysis relies on surface flux changes; vertical profiles of temperature/humidity would be needed to fully disentangle lapse-rate vs. water vapor contributions.
Surface Downward LW Radiation Change — IFS-FESOM vs CMIP6 Envelope f_out 14.6%
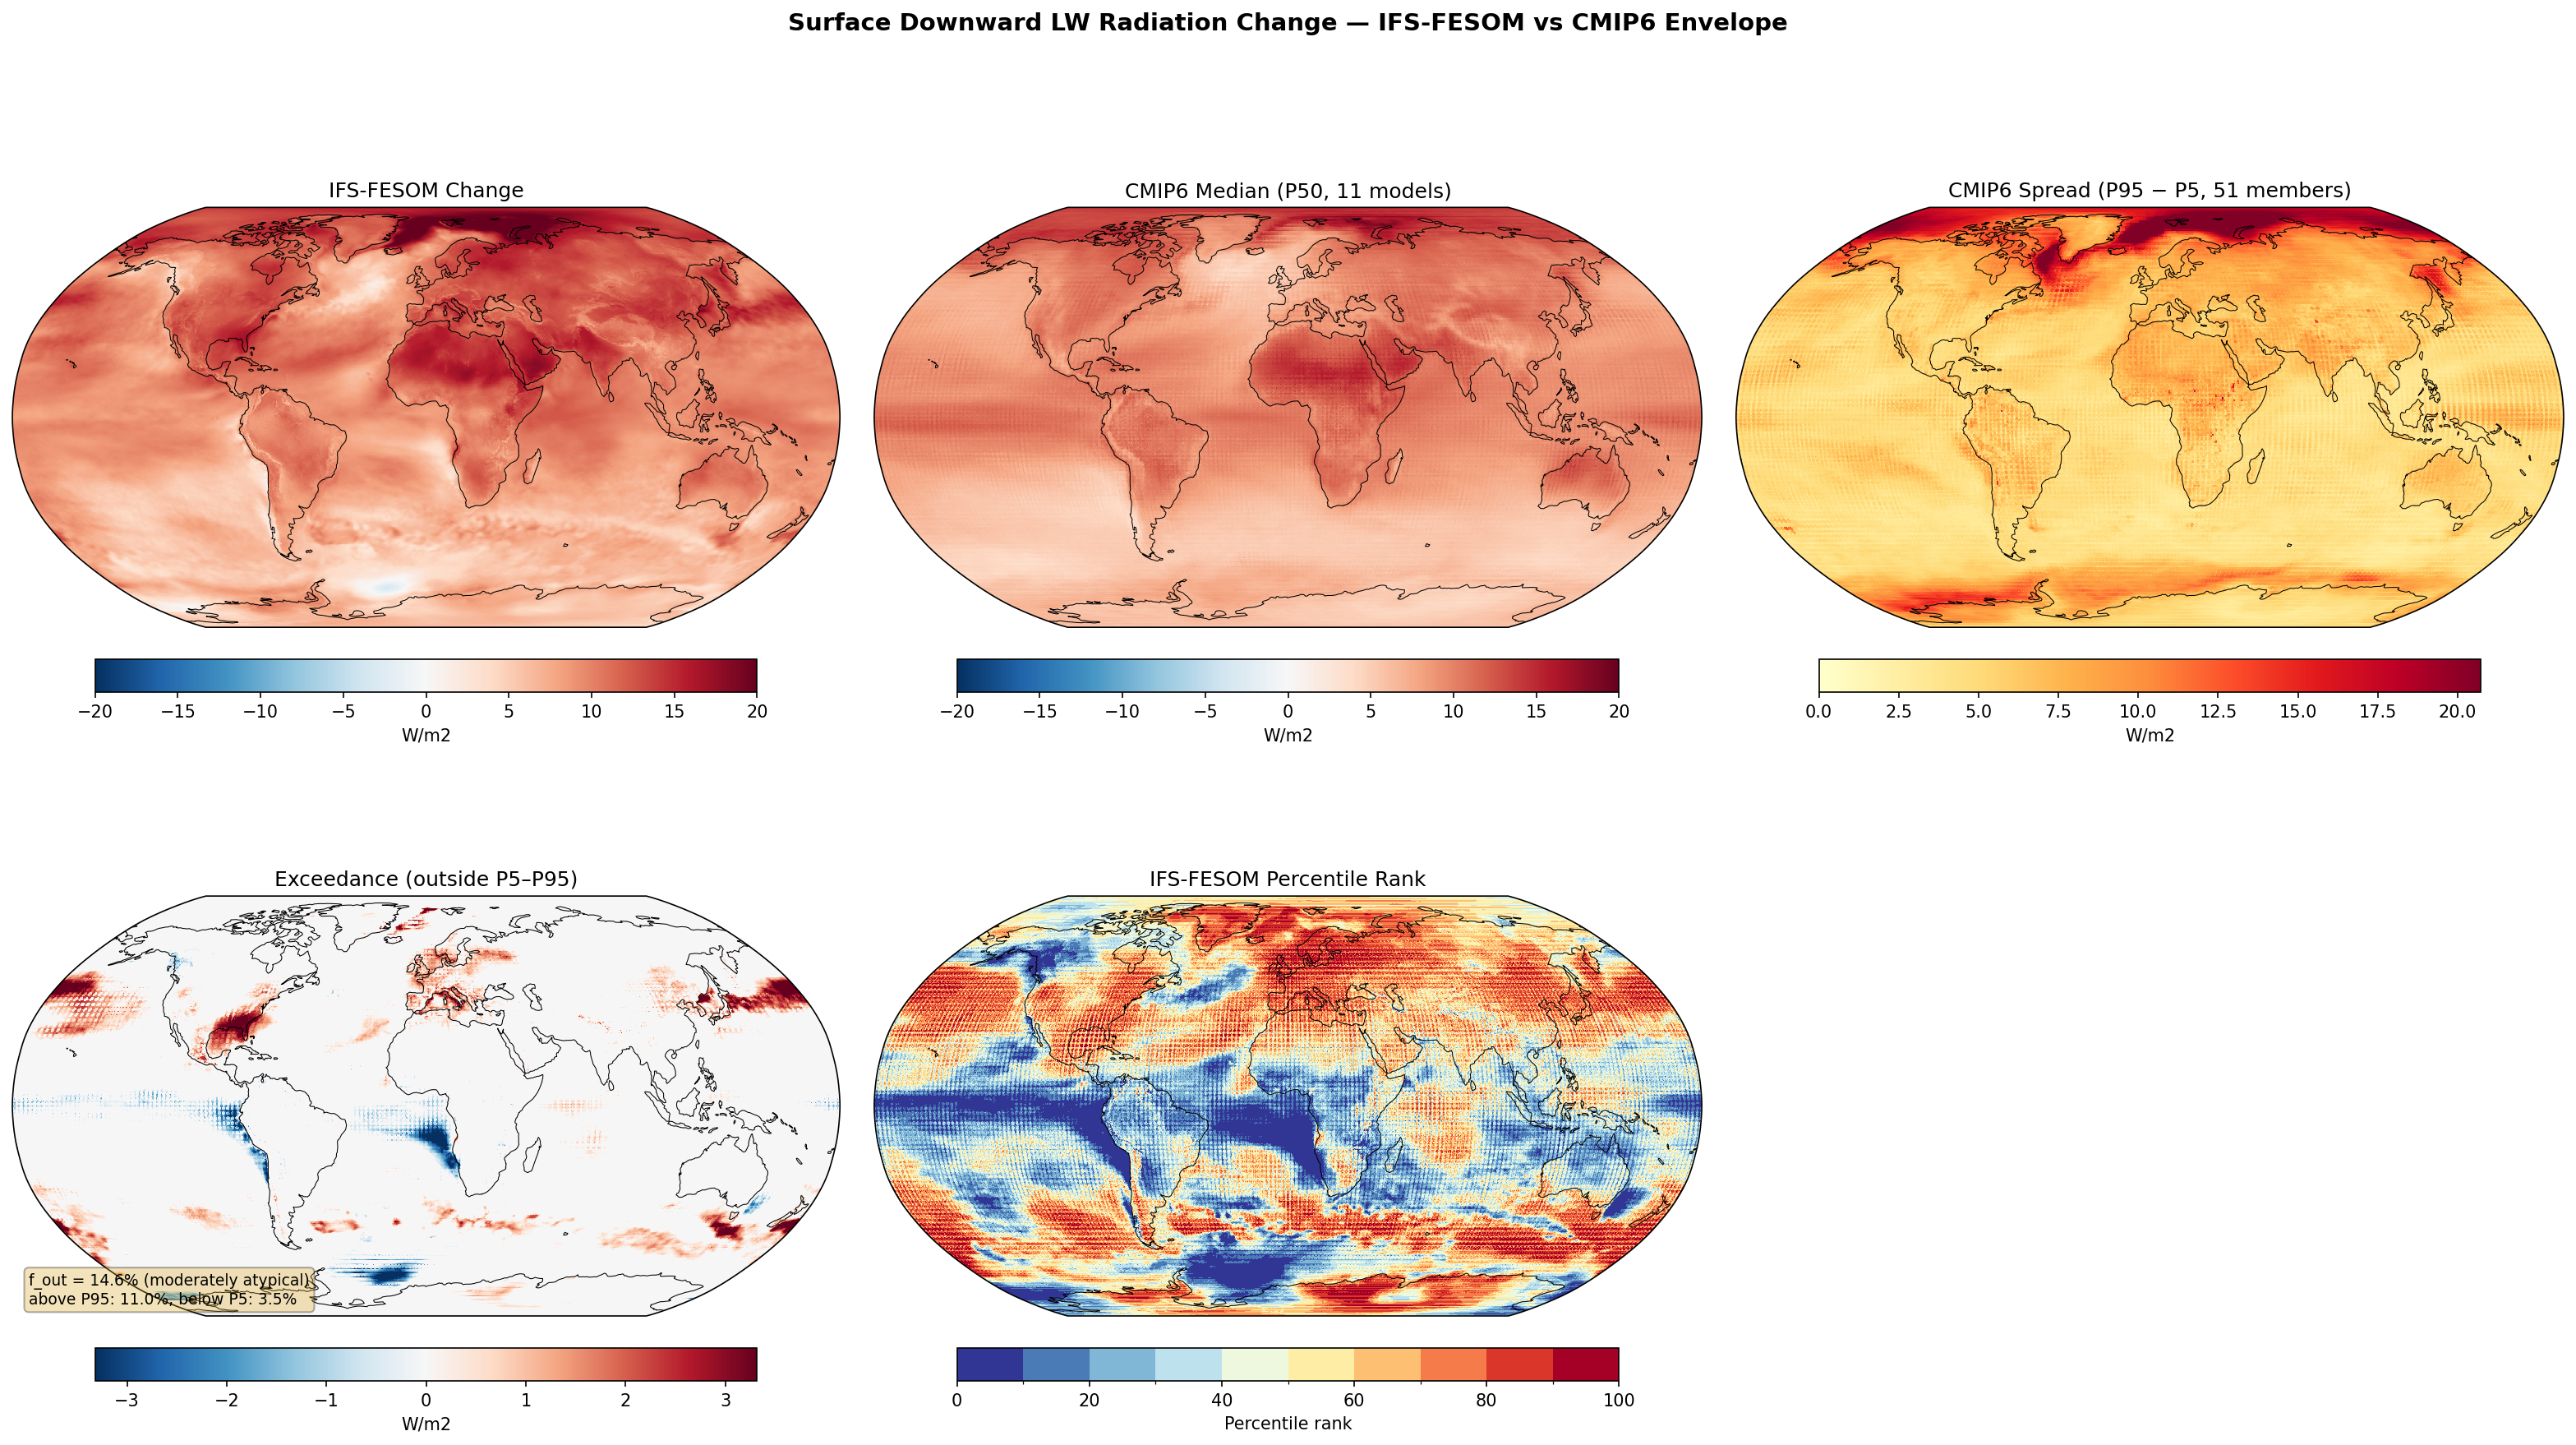
Envelope Metrics
| f_out (outside P5–P95) | 14.6% moderately atypical |
|---|---|
| Above P95 | 11.0% |
| Below P5 | 3.5% |
| CMIP6 ensemble | 11 models, 51 members |
| Variables | avg_sdlwrf |
|---|---|
| Models | ifs-fesom |
| Units | W/m2 |
| Baseline | 1990-2014 |
| Future | 2040-2049 |
| Method | Future mean minus historical mean compared to CMIP6 percentile envelope (P5, P50, P95). |
Summary high
IFS-FESOM projects a global increase in surface downward longwave radiation (SDLWR) by 2040–2049, with a moderately atypical response (f_out = 14.6%) characterized by stronger increases than the CMIP6 envelope in mid-latitude storm tracks and Northern Hemisphere land, but weaker increases in tropical oceans.
Key Findings
- The model shows a systematic positive bias relative to CMIP6 (11.0% of area >P95 vs 3.5% <P5), particularly over Northern Hemisphere continents and mid-latitude oceans.
- IFS-FESOM exceeds the CMIP6 P95 threshold notably in the North Atlantic and North Pacific storm track regions, implying enhanced atmospheric opacity (water vapor/clouds) or warmer temperatures in these active weather zones.
- Conversely, vast swathes of the tropical and subtropical oceans display low percentile ranks (<10–20), indicating a weaker increase in downward longwave radiation compared to the CMIP6 ensemble.
- A localized region in the Southern Ocean (Weddell Sea sector) shows significantly lower SDLWR change (below P5), potentially linked to sea-ice dynamics or delayed warming.
Spatial Patterns
The percentile rank map reveals a distinct zonal contrast: high ranks (>80) dominate the Northern Hemisphere mid-latitudes (especially storm tracks) and land masses, while low ranks (<20) characterize the tropical and subtropical ocean basins. High exceedance (red) is concentrated in the North Atlantic current extension, North Pacific, and Europe. Negative exceedance (blue) is patchy but visible in the Southern Ocean and tropical South Atlantic.
Model Agreement
IFS-FESOM largely agrees with the CMIP6 median on the broad pattern of Arctic amplification and stronger warming over land than ocean. However, it diverges significantly in the storm tracks (higher SDLWR) and tropical oceans (lower SDLWR). The Arctic generally falls within the very wide CMIP6 spread, despite high absolute changes.
Physical Interpretation
The enhanced SDLWR in mid-latitude storm tracks likely reflects the high-resolution model's ability to better resolve moisture transport and cyclone intensity, leading to increased water vapor and cloud cover (positive longwave feedback) compared to coarser models. The lower response in the tropics suggests distinct handling of the hydrological cycle or cloud radiative effects (e.g., boundary layer clouds) in the IFS physics compared to the CMIP6 mean. High values over land are consistent with strong surface warming increasing thermal emission.
Caveats
- Downward longwave radiation integrates temperature and emissivity (clouds/water vapor); without separating clear-sky components, attributing the signal solely to warming vs. cloud feedback is difficult.
- The 2040–2049 period is short, so internal variability (e.g., ENSO or decadal modes) could influence the tropical vs. mid-latitude contrast.
Surface Downward LW Radiation Change — IFS-NEMO vs CMIP6 Envelope f_out 19.6%
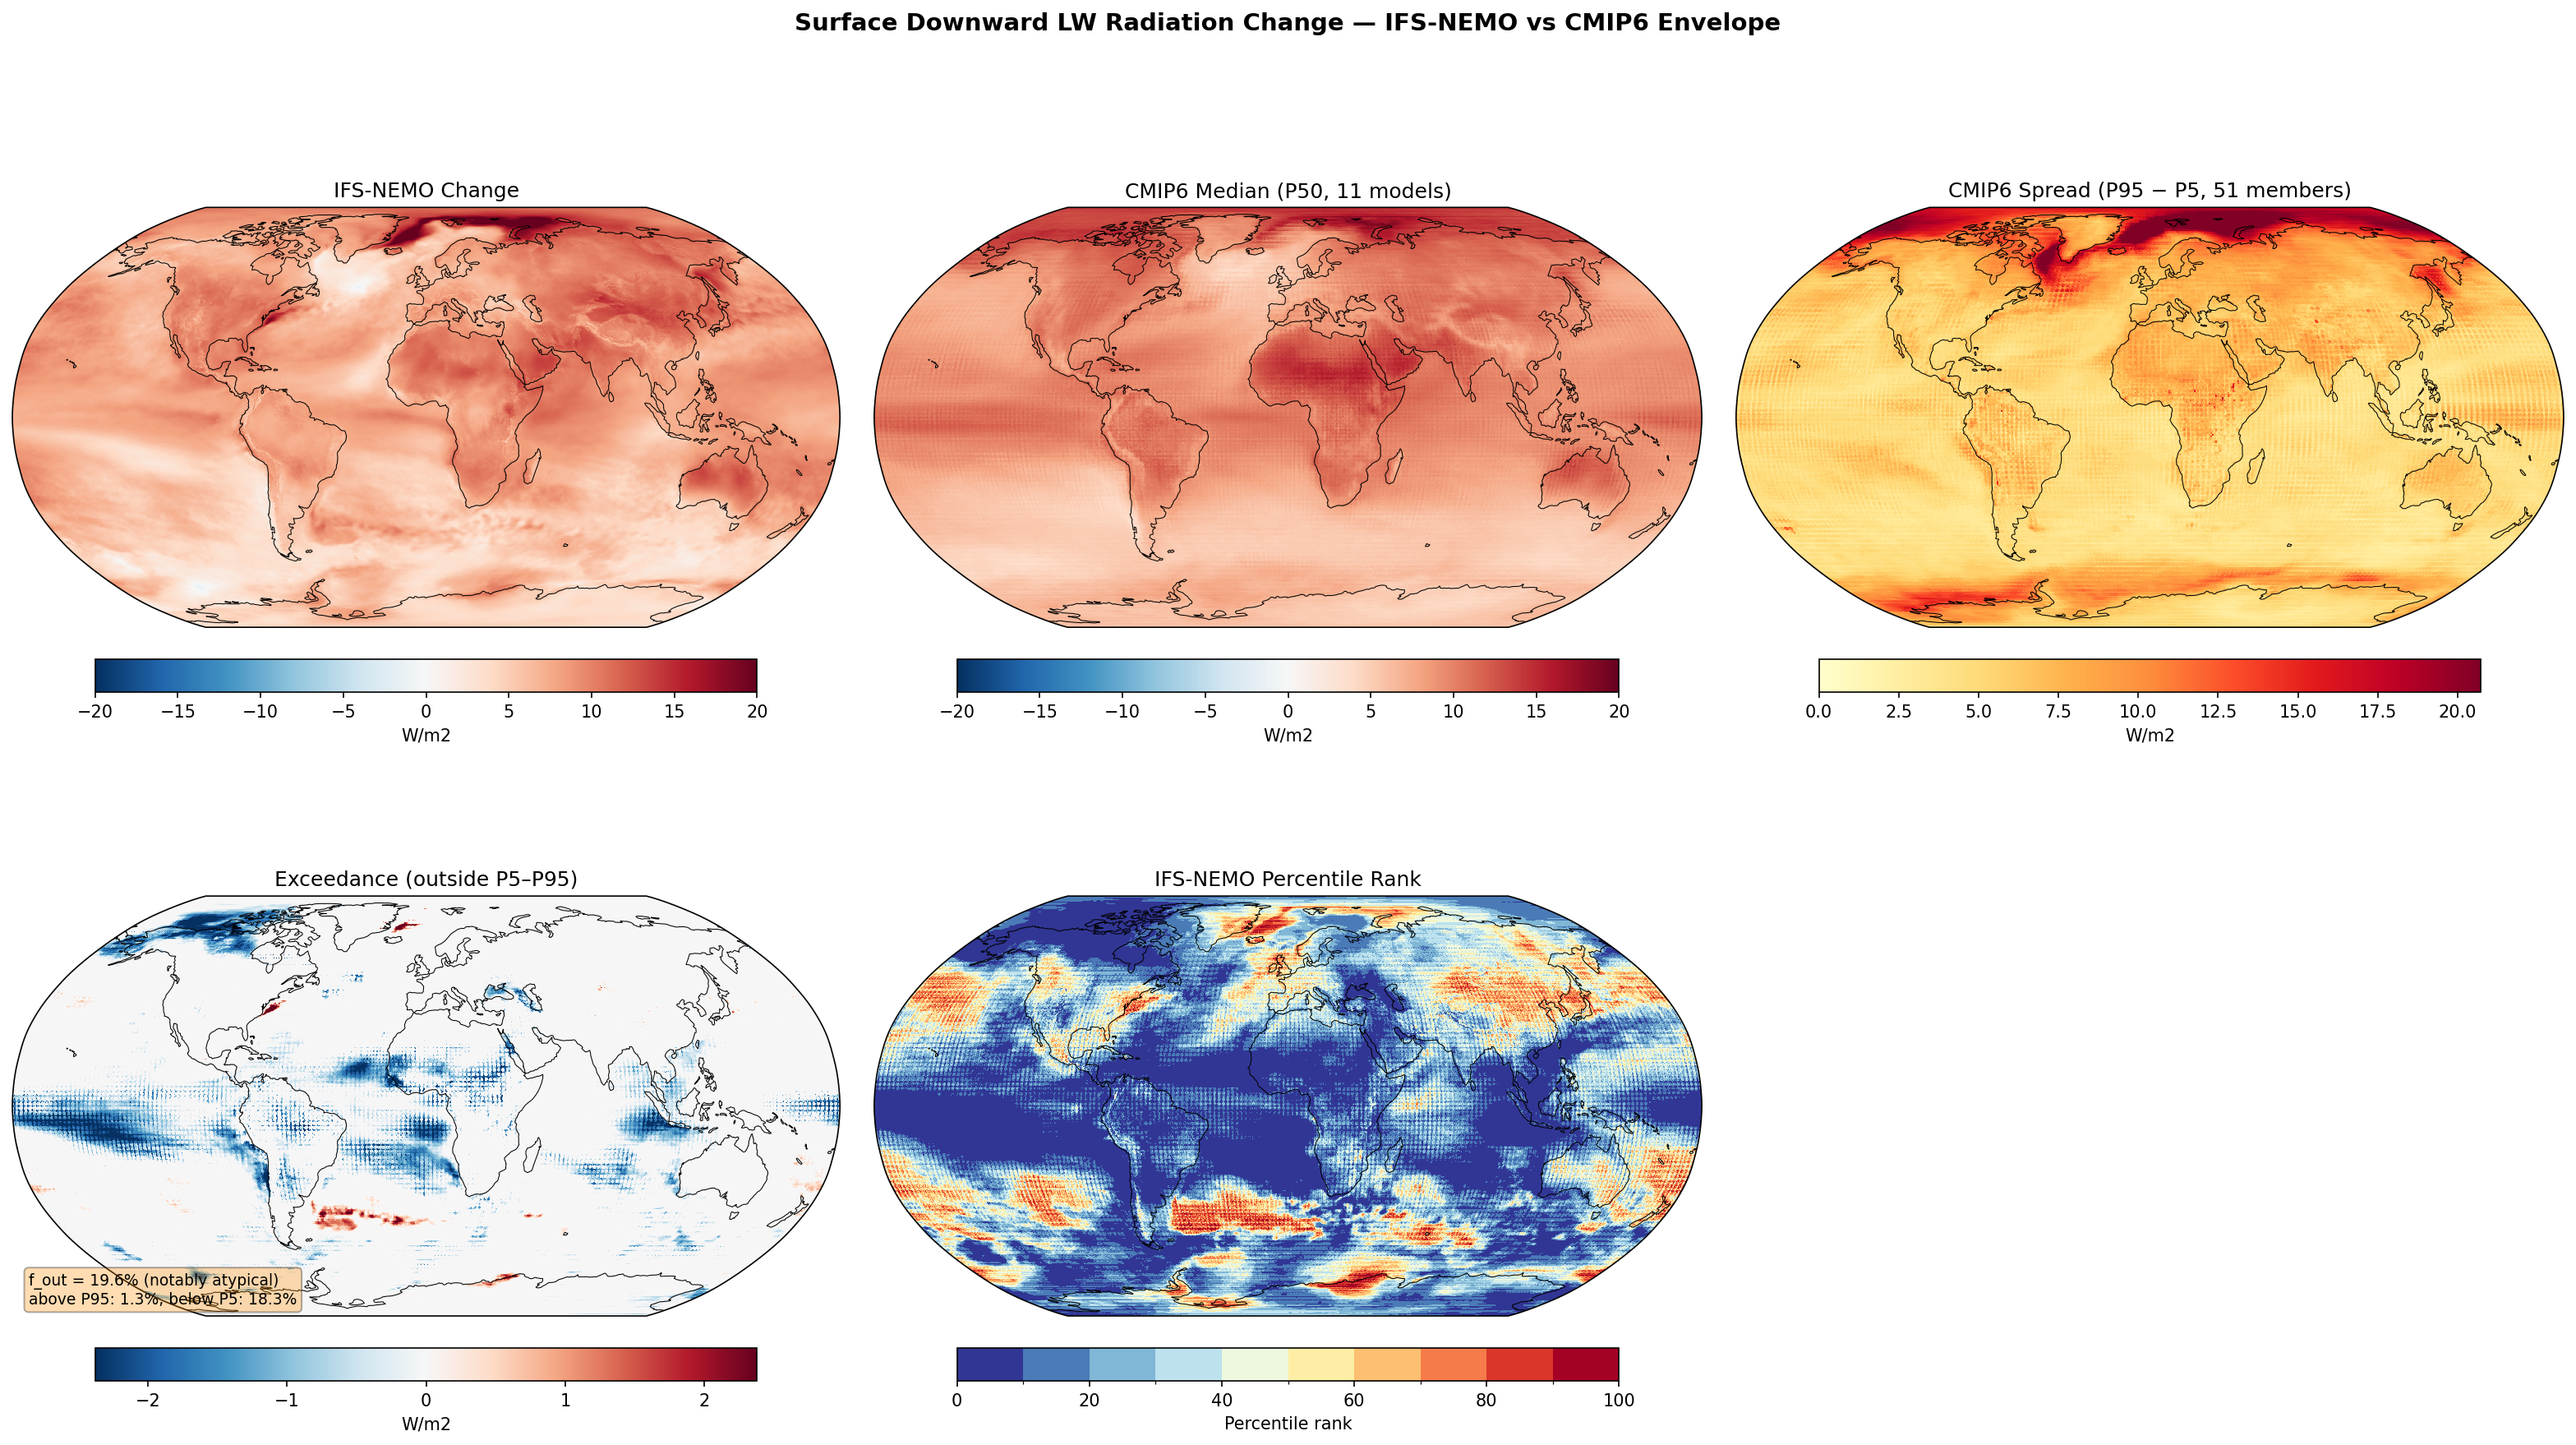
Envelope Metrics
| f_out (outside P5–P95) | 19.6% notably atypical |
|---|---|
| Above P95 | 1.3% |
| Below P5 | 18.3% |
| CMIP6 ensemble | 11 models, 51 members |
| Variables | avg_sdlwrf |
|---|---|
| Models | ifs-nemo |
| Units | W/m2 |
| Baseline | 1990-2014 |
| Future | 2040-2049 |
| Method | Future mean minus historical mean compared to CMIP6 percentile envelope (P5, P50, P95). |
Summary high
IFS-NEMO projects a global increase in surface downward longwave radiation by 2040–2049, but with significantly weaker magnitude over tropical oceans compared to the CMIP6 ensemble, resulting in a 'notably atypical' f_out of 19.6%.
Key Findings
- Global downward longwave radiation increases, peaking in the Arctic (>15 W/m²) and over major continents.
- IFS-NEMO falls below the CMIP6 5th percentile (P5) over vast regions of the tropical Pacific, Atlantic, and Indian Oceans, indicating a weaker enhancement of the greenhouse effect in these regions relative to CMIP6.
- Over land masses, IFS-NEMO generally aligns well with the CMIP6 median (percentile ranks 40–70), contrasting sharply with the oceanic response.
- The total fraction of points outside the CMIP6 envelope is 19.6%, dominated almost entirely by regions where IFS-NEMO is below the P5 threshold (18.3%).
Spatial Patterns
The spatial structure shows pronounced hemispheric asymmetry in the anomaly relative to CMIP6. While land areas and the Arctic show robust increases consistent with the ensemble median, the tropical oceans display a coherent band of 'low bias' in the change signal (blue in Exceedance panel). Specifically, the equatorial Pacific exhibits a pattern resembling a La Niña-like response or reduced El Niño-like warming compared to the coarser CMIP6 models.
Model Agreement
There is strong disagreement over the tropical oceans, where IFS-NEMO lies at the very bottom of the CMIP6 distribution (0–10th percentile). Conversely, model agreement is high over continental regions (South America, Africa, Australia, Eurasia), where the IFS-NEMO response sits comfortably within the interquartile range.
Physical Interpretation
The weaker increase in downward longwave radiation over tropical oceans suggests that IFS-NEMO simulates less Sea Surface Temperature (SST) warming or a weaker water vapor feedback in these regions than the standard CMIP6 ensemble. This could be due to improved resolution of ocean dynamics (e.g., upwelling) mitigating surface warming, or differences in convective parameterization leading to smaller increases in atmospheric humidity and cloud cover. The pattern is consistent with a lower transient climate response or distinct ocean heat uptake characteristics in the high-resolution coupled system.
Caveats
- The analysis refers to near-term change (2040–2049); long-term equilibrium responses might differ.
- Being 'below P5' does not imply cooling, but rather a smaller positive increment in downward radiation compared to the model ensemble.
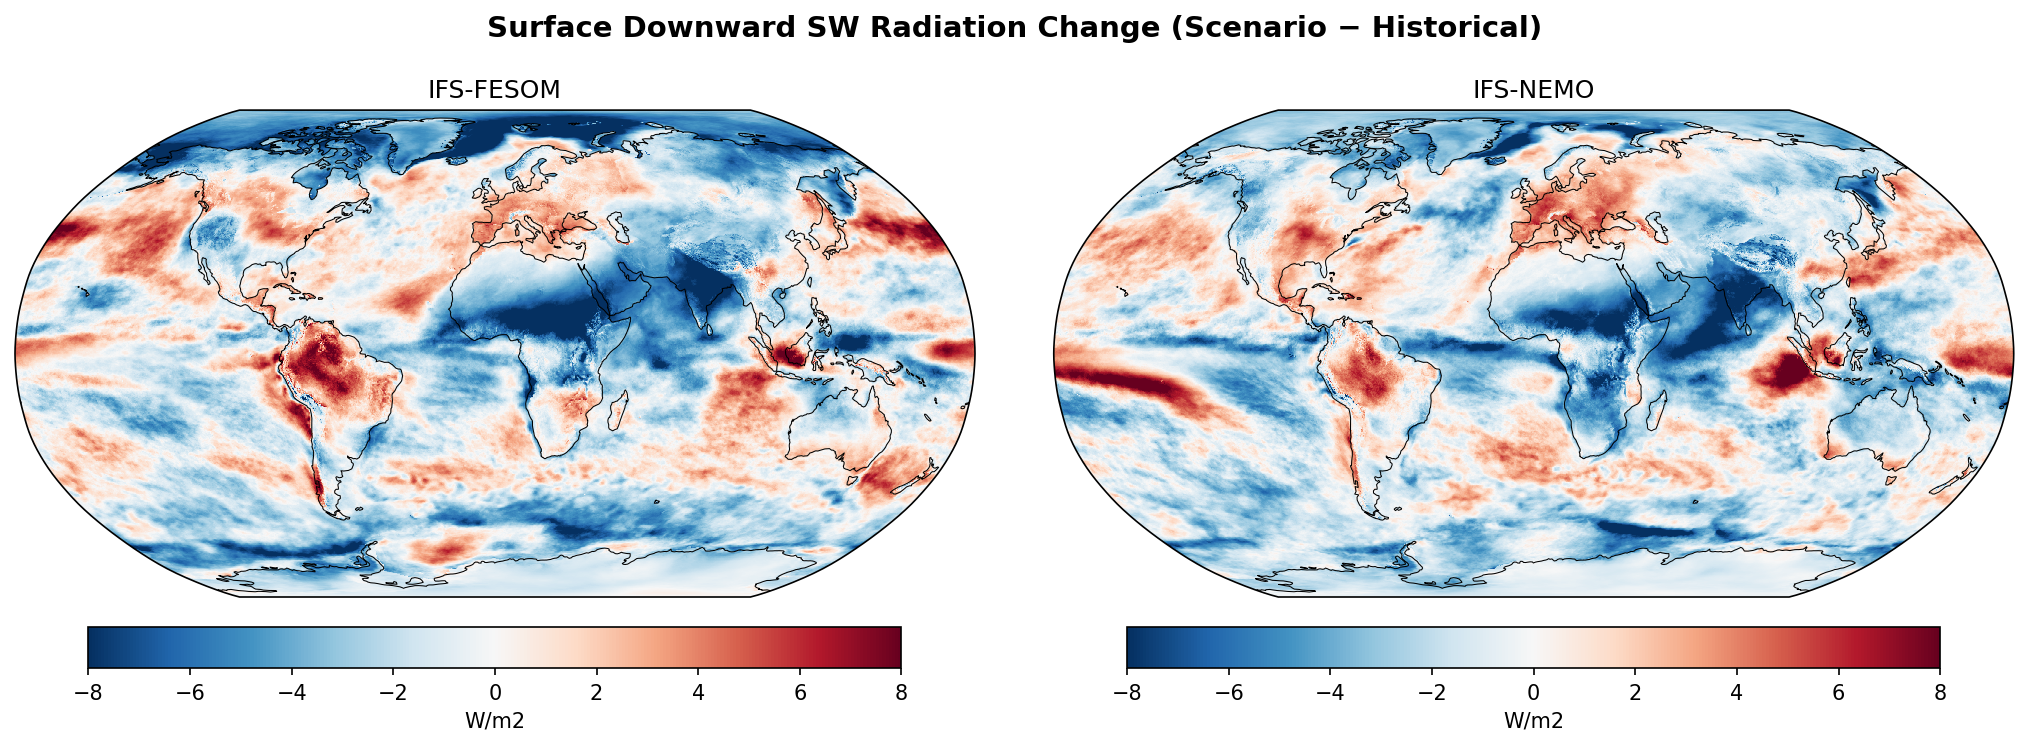
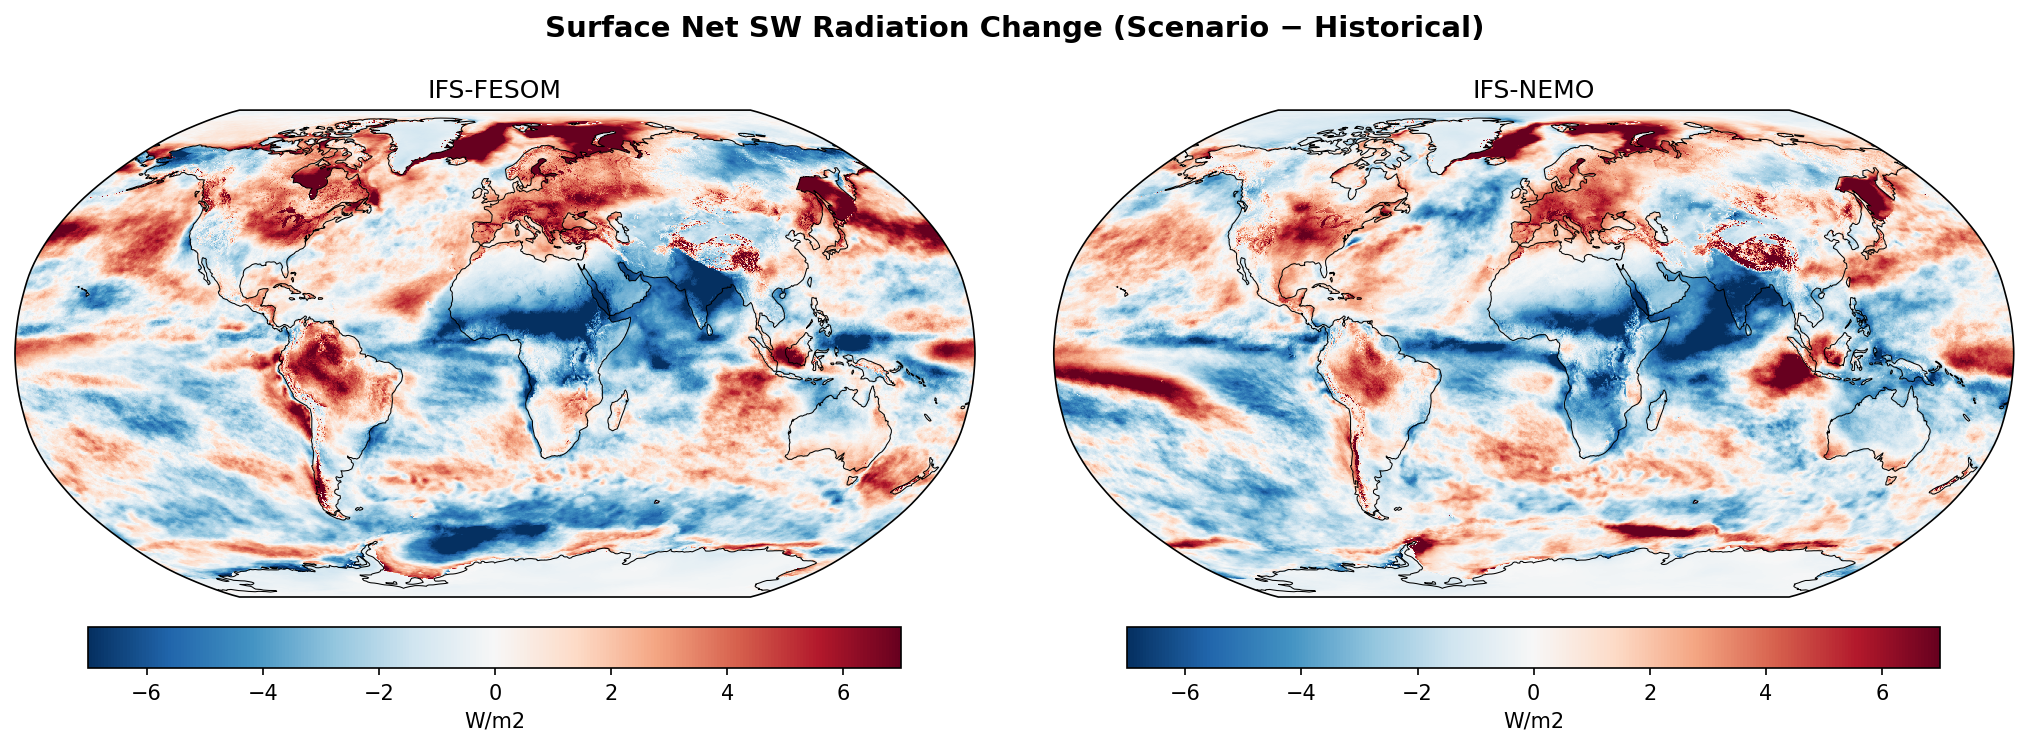
Surface Downward SW Radiation Change
| Variables | avg_sdswrf |
|---|---|
| Models | ifs-fesom, ifs-nemo |
| Units | W/m2 |
| Baseline | 1990-2014 |
| Future | 2040-2049 |
| Method | Future mean minus historical mean. |
Summary high
The figure illustrates the projected change in surface downward shortwave radiation (SDSW) for the period 2040–2049 relative to 1990–2014 under the SSP3-7.0 scenario, comparing two high-resolution coupled models: IFS-FESOM and IFS-NEMO.
Key Findings
- Strong reduction in SDSW (dimming) over the Arctic and Southern Oceans in both models, likely reaching -8 W/m², consistent with increased cloudiness in warming polar regions.
- Prominent increase in SDSW (brightening) over Europe and the Mediterranean, signalling reduced cloud cover associated with robust regional drying/anticyclonic trends.
- Notable divergence over the Amazon Basin: IFS-FESOM projects a substantial area of increased radiation (suggesting drying/dieback), whereas IFS-NEMO shows a much weaker, localized signal.
- Tropical oceans exhibit bands of reduced SDSW along the Intertropical Convergence Zone (ITCZ), implying intensification or shifting of convective cloud bands.
Spatial Patterns
The maps display a distinct zonal character: polar dimming due to cloud feedbacks, mid-latitude continental brightening (most intense over Europe), and complex tropical reorganization. The ITCZ appears as a band of decreased radiation (blue), while subtropical gyre regions generally show increases (red). A distinct dipole is visible in the North Atlantic.
Model Agreement
There is high qualitative agreement on the large-scale features: European brightening, Arctic/Antarctic dimming, and the general structure of tropical changes. Significant disagreement exists in the magnitude of the Amazonian response (IFS-FESOM is much stronger) and the precise spatial configuration of the Pacific ITCZ and Indian Ocean cloud changes.
Physical Interpretation
Changes are primarily driven by cloud cover response to warming. In the Arctic, sea-ice loss and thermodynamic warming increase moisture availability and cloud fraction (reducing surface solar radiation). Over Europe, the signal is consistent with a northward shift of the jet stream and increased blocking/subsidence reducing cloudiness. The Amazon discrepancy suggests sensitivity differences in land-atmosphere coupling or the convective response to warming between the model configurations.
Caveats
- The figure displays downward flux only; net shortwave radiation (and thus surface warming) in the Arctic would be dominated by surface albedo reductions (sea-ice loss) which oppose the dimming effect shown here.
- No CMIP6 comparison panel is present in the visual, limiting the assessment of whether the strong Amazon signal in IFS-FESOM is an outlier relative to the broader ensemble.
Surface Downward SW Radiation Change — IFS-FESOM vs CMIP6 Envelope f_out 15.1%
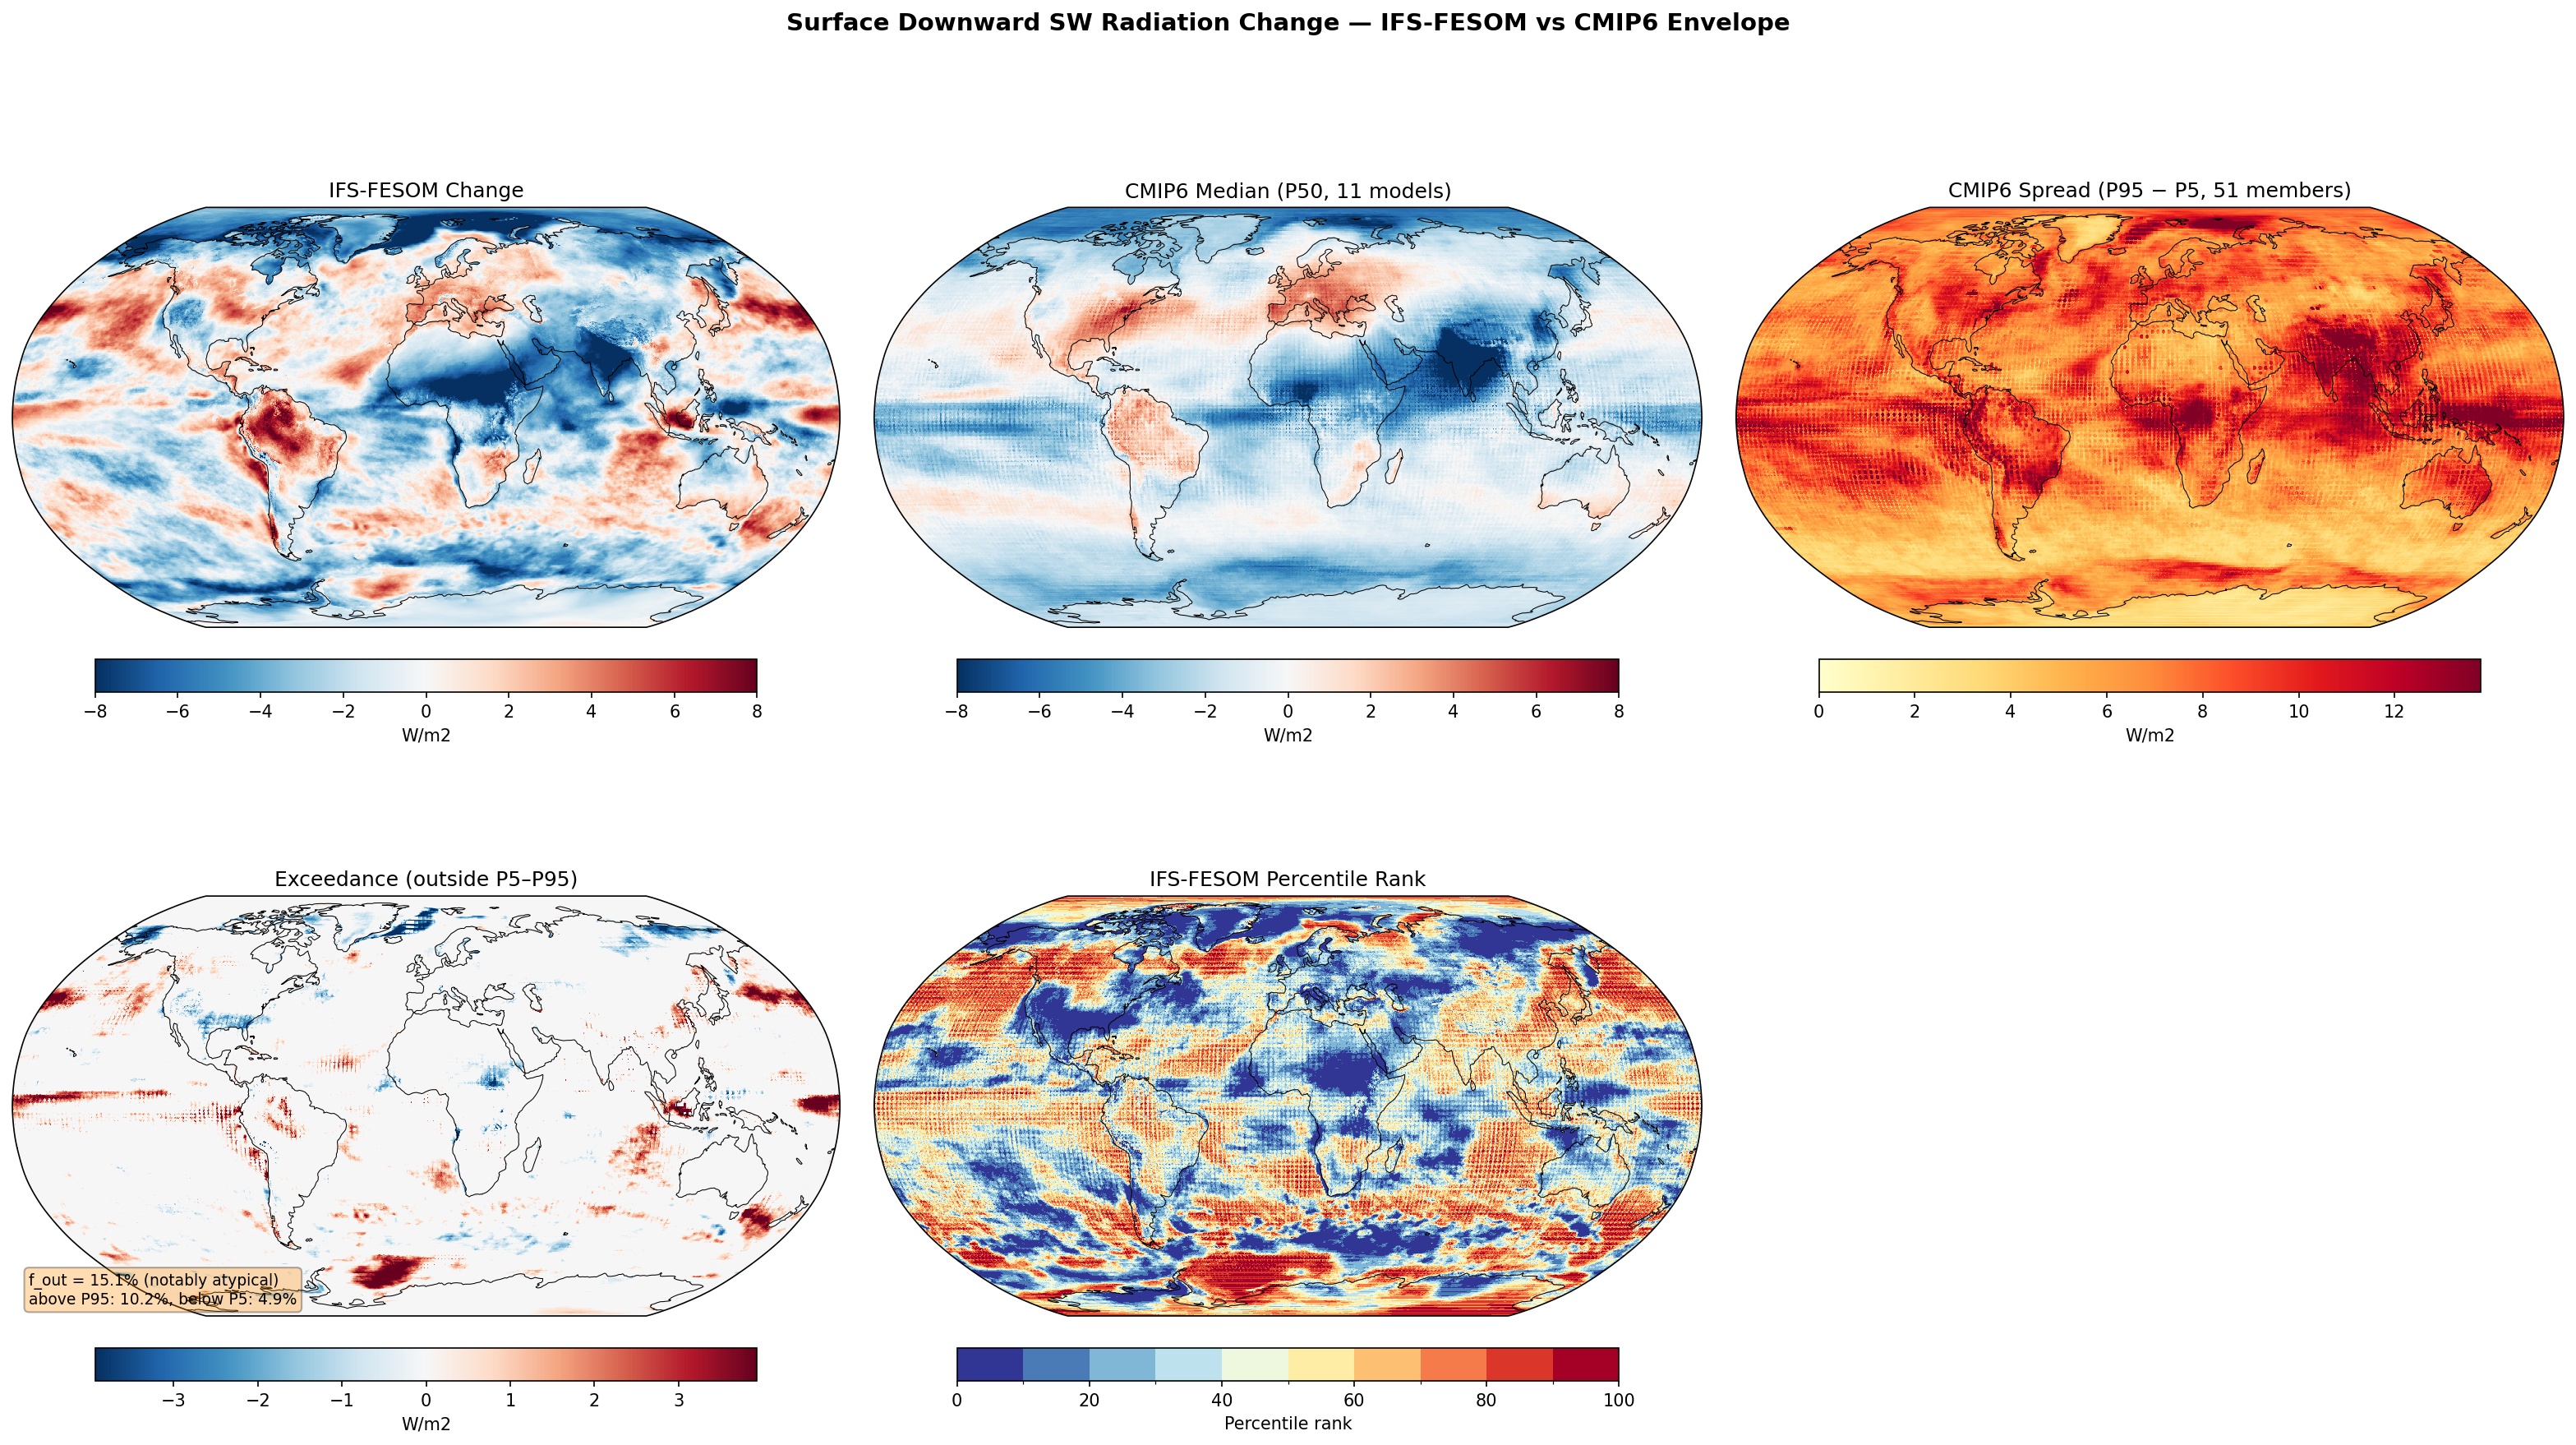
Envelope Metrics
| f_out (outside P5–P95) | 15.1% notably atypical |
|---|---|
| Above P95 | 10.2% |
| Below P5 | 4.9% |
| CMIP6 ensemble | 11 models, 51 members |
| Variables | avg_sdswrf |
|---|---|
| Models | ifs-fesom |
| Units | W/m2 |
| Baseline | 1990-2014 |
| Future | 2040-2049 |
| Method | Future mean minus historical mean compared to CMIP6 percentile envelope (P5, P50, P95). |
Summary high
IFS-FESOM projects significant regional shifts in surface downward shortwave radiation (SDSW) under SSP3-7.0, with a notably atypical 15.1% of the global area falling outside the CMIP6 P5–P95 envelope. The model shows intensified dimming in the North Atlantic and tropical convective zones compared to the multi-model ensemble, while projecting stronger brightening in parts of the Southern Ocean and subtropics.
Key Findings
- Global exceedance is 15.1% (notably atypical), with a bias towards brightening relative to the envelope (10.2% above P95 vs 4.9% below P5).
- Strong agreement with CMIP6 on brightening over the Mediterranean and Amazon, indicating reduced cloud cover consistent with regional drying.
- IFS-FESOM exhibits a distinct, intense dimming signal in the North Atlantic (blue outlier) and sharper tropical convective bands than the CMIP6 median.
- Complex, mixed-sign exceedance patterns appear in the Southern Ocean, suggesting high sensitivity in cloud-sea ice feedbacks.
Spatial Patterns
Prominent dipolar changes are visible in the tropics, likely tracking shifts in the ITCZ/SPCZ. A strong reduction in SDSW (dimming) dominates the North Atlantic and Arctic Ocean. Conversely, SDSW increases (brightening) over Europe, the Amazon basin, the eastern subtropical Pacific, and large swathes of the Southern Ocean. The spatial texture in IFS-FESOM is notably finer than the smooth CMIP6 median.
Model Agreement
The model aligns well with the CMIP6 median in the subtropics and mid-latitudes (e.g., Europe, Amazon), falling near the 50th percentile. Divergence is highest in the North Atlantic (IFS-FESOM is dimmer/below P5), the equatorial Pacific (sharper gradients), and the Southern Ocean (patches of localized brightening above P95).
Physical Interpretation
The North Atlantic dimming likely reflects strong local cloud feedbacks possibly associated with a 'warming hole' or AMOC response, which may be more resolved in the eddy-rich ocean component. The sharp tropical bands suggest defined ITCZ narrowing or shifting, a common feature of high-resolution atmospheric physics compared to parameterized convection in coarser models. Brightening in Europe and the Amazon is dynamically consistent with Hadley cell expansion and suppressed convection.
Caveats
- Differences in aerosol forcing implementation between IFS and the CMIP6 ensemble could contribute to SW discrepancies, particularly in the Northern Hemisphere.
- High-latitude exceedance patterns may be influenced by differences in sea-ice retreat rates and associated cloud masking effects.
Surface Downward SW Radiation Change — IFS-NEMO vs CMIP6 Envelope f_out 13.9%
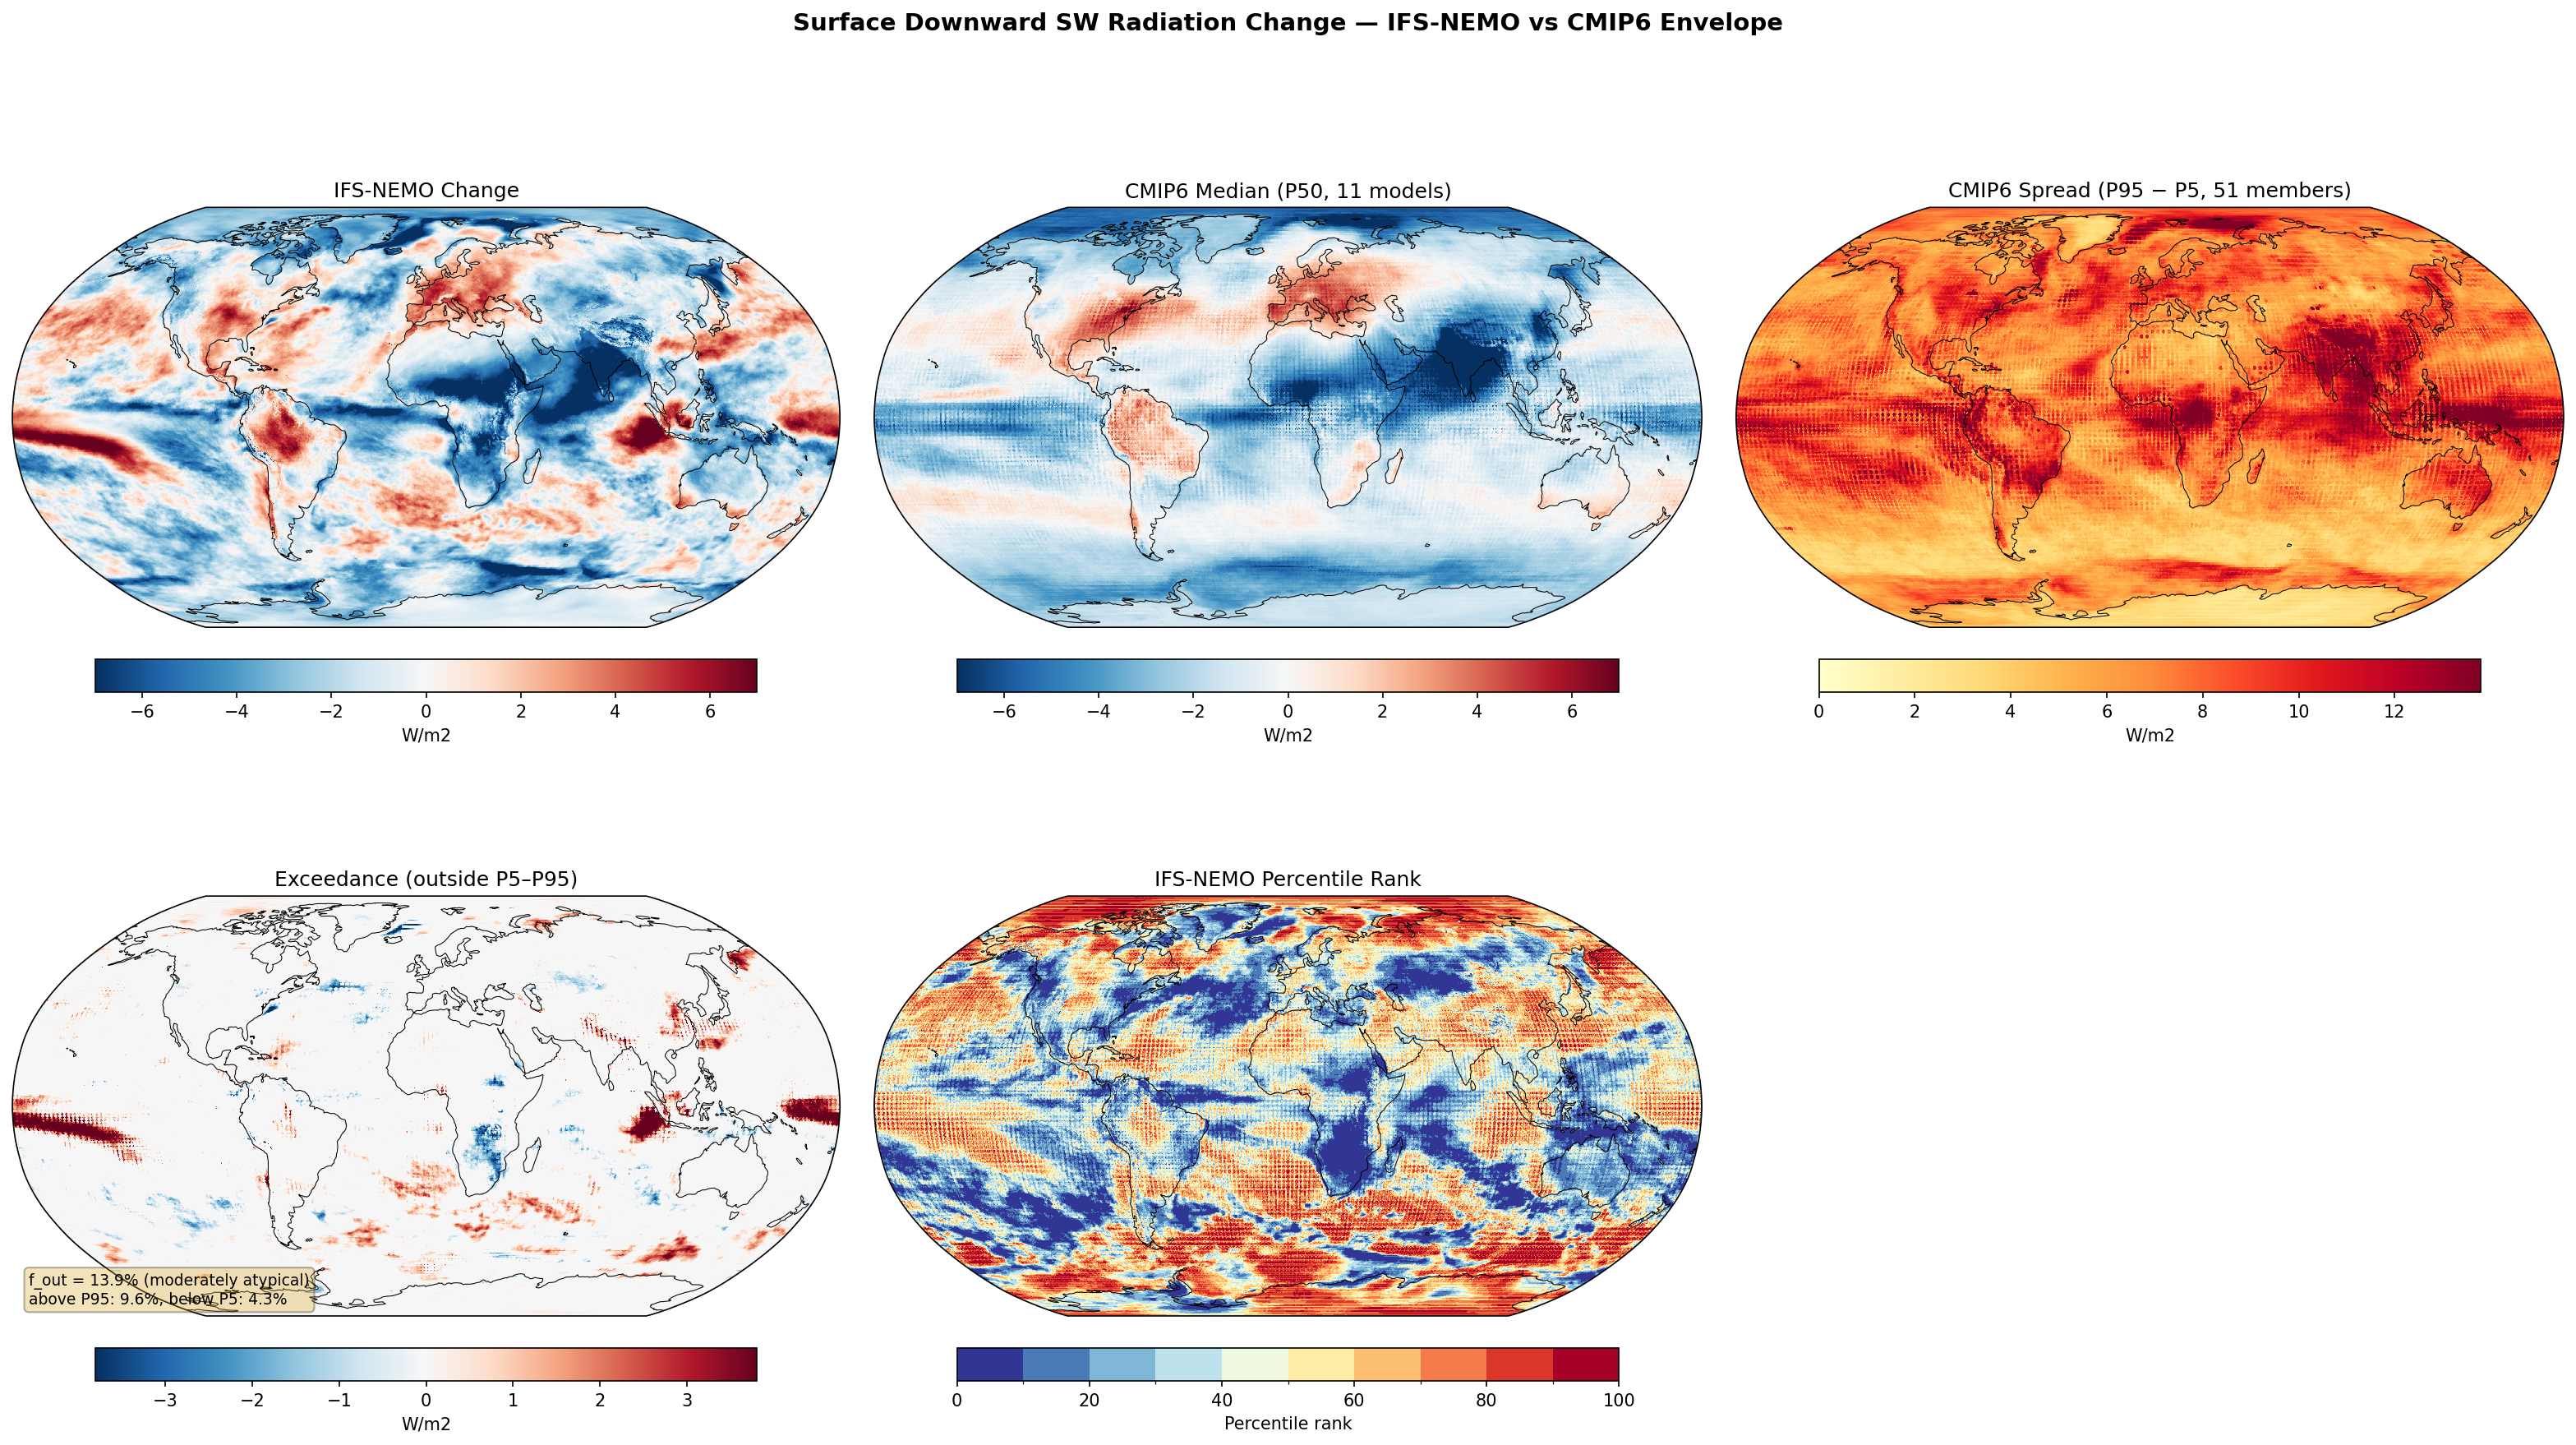
Envelope Metrics
| f_out (outside P5–P95) | 13.9% moderately atypical |
|---|---|
| Above P95 | 9.6% |
| Below P5 | 4.3% |
| CMIP6 ensemble | 11 models, 51 members |
| Variables | avg_sdswrf |
|---|---|
| Models | ifs-nemo |
| Units | W/m2 |
| Baseline | 1990-2014 |
| Future | 2040-2049 |
| Method | Future mean minus historical mean compared to CMIP6 percentile envelope (P5, P50, P95). |
Summary high
IFS-NEMO projects surface downward shortwave radiation changes (2040-2049) that are largely consistent with the CMIP6 ensemble (f_out=13.9%), reproducing key features like Mediterranean brightening and high-latitude dimming. However, the model exhibits notably stronger positive anomalies in the Eastern Equatorial Pacific and sharper zonal structures in the Southern Ocean compared to the CMIP6 envelope.
Key Findings
- IFS-NEMO shows a distinct region of enhanced surface shortwave radiation (brightening) in the Eastern Equatorial Pacific that exceeds the CMIP6 P95 percentile.
- Strong agreement with CMIP6 on dimming (reduced SW) over South Asia and the Indo-Pacific Warm Pool, and brightening over Europe and the Amazon.
- The Southern Ocean displays a complex, zonally banded pattern of change with local exceedances of the CMIP6 range, likely reflecting sharper meridional shifts in storm tracks.
- The total area of disagreement (f_out) is 13.9%, classifying the result as 'moderately atypical', with deviations primarily driven by oceanic regions.
Spatial Patterns
Prominent increases in downward SW radiation are seen over the Mediterranean, North Atlantic subtropics, Amazon, and Eastern Pacific. Widespread decreases occur over the Arctic, Antarctic margins, South Asia, and the Tropical Atlantic/African ITCZ region. The Southern Ocean shows alternating zonal bands of increase and decrease.
Model Agreement
IFS-NEMO agrees well with the CMIP6 median over major land masses (Europe, S. Asia, S. America). The primary disagreement is in the Eastern Equatorial Pacific (IFS-NEMO > P95) and the Tropical Atlantic (IFS-NEMO < P5), indicating structural differences in tropical cloud feedbacks or circulation response.
Physical Interpretation
Changes are dominated by cloud cover and aerosol responses. Brightening over Europe and the Amazon is consistent with reduced cloudiness due to drying/circulation changes. Dimming at high latitudes likely results from increased low-cloud formation over retreating sea ice (sea-ice-cloud feedback). The distinct Eastern Pacific brightening suggests IFS-NEMO simulates a stronger reduction in stratocumulus decks or a different Walker circulation response compared to the CMIP6 mean.
Caveats
- The 10-year averaging period (2040-2049) means the strong Eastern Pacific signal could be influenced by internal decadal variability (e.g., IPO phase) rather than forced climate change alone.
- Differences in aerosol forcing implementation between IFS-NEMO and the CMIP6 ensemble may contribute to discrepancies in regions like the Tropical Atlantic and South Asia.
Sensible Heat Flux Change
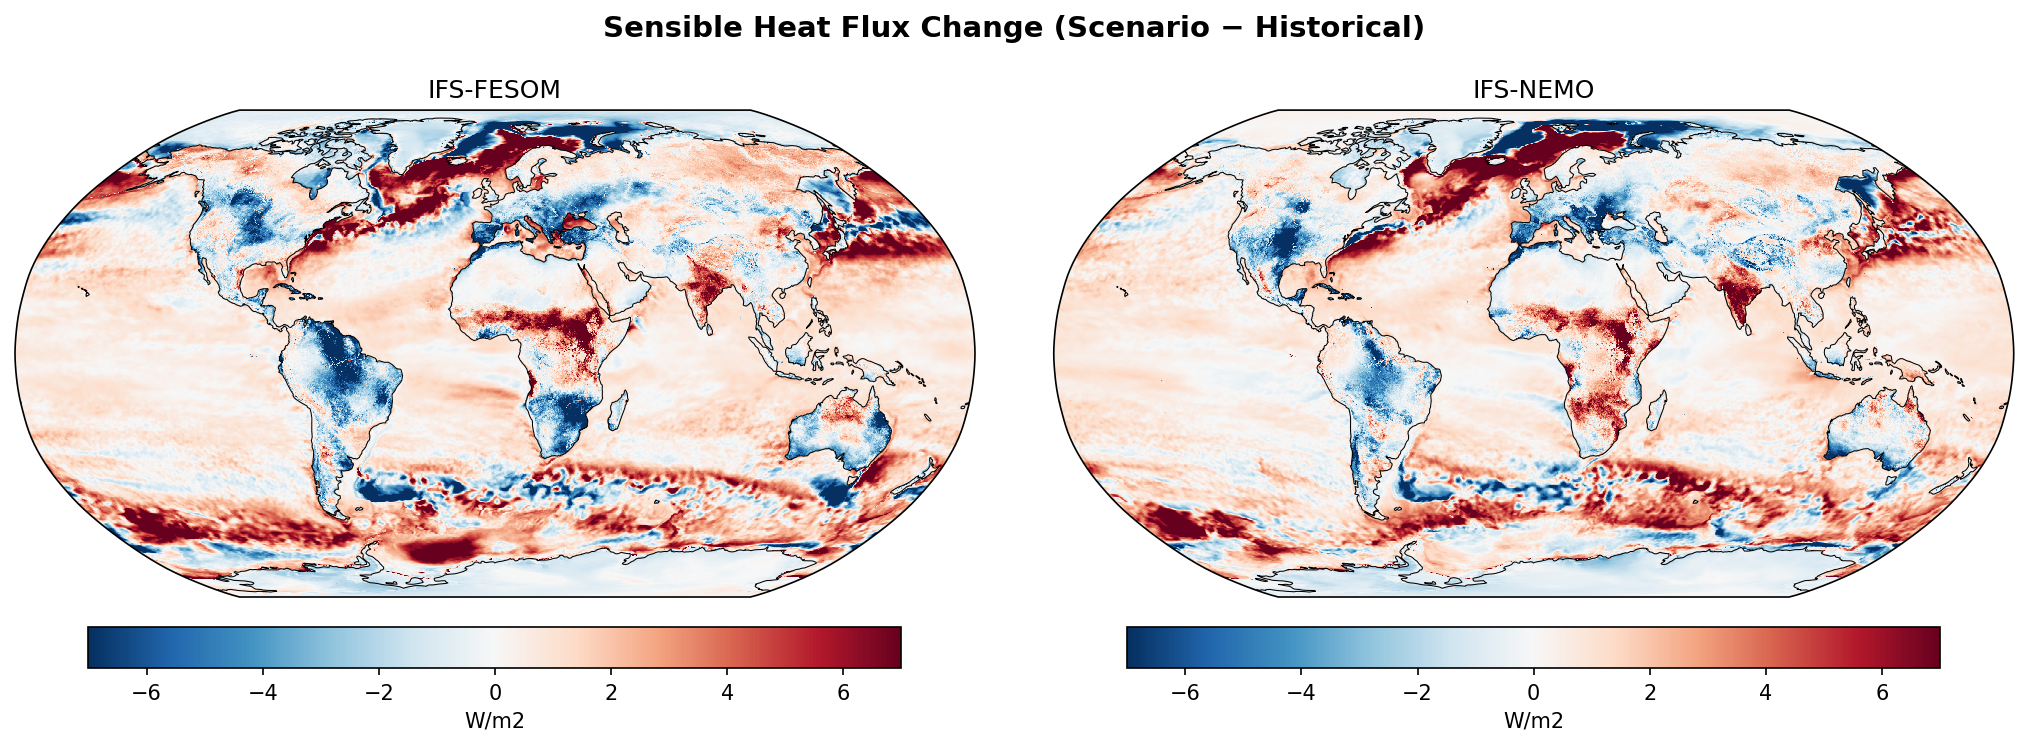
| Variables | avg_ishf |
|---|---|
| Models | ifs-fesom, ifs-nemo |
| Units | W/m2 |
| Baseline | 1990-2014 |
| Future | 2040-2049 |
| Method | Future mean minus historical mean. |
Summary high
This figure displays the projected change in surface sensible heat flux (SHF) between the future (2040–2049) and historical (1990–2014) periods for two high-resolution coupled models, IFS-FESOM and IFS-NEMO. Both models exhibit strong spatial heterogeneity, with marked contrasts between land and ocean responses and distinct regional dipoles.
Key Findings
- A prominent reduction in sensible heat flux (negative anomaly, blue) is observed over the Amazon basin and the Eastern United States in both models.
- Central Africa exhibits a strong increase in sensible heat flux (positive anomaly, red), suggesting a regional drying trend shifting the Bowen ratio.
- The North Atlantic displays a characteristic dipole: decreased SHF in the subpolar gyre (warming hole) and increased SHF along the Gulf Stream extension.
- IFS-FESOM and IFS-NEMO show high consistency in their spatial patterns over land, with slight differences in the fine-scale structure of Southern Ocean anomalies.
Spatial Patterns
Over land, distinct dipole patterns emerge: the Amazon and Eastern US show strong negative anomalies (blue, <-4 W/m²), while Central Africa and parts of the Middle East show strong positive anomalies (red, >4 W/m²). Over the ocean, the North Atlantic features a localized region of negative change south of Greenland, contrasted by positive changes along western boundary currents (Gulf Stream, Kuroshio). The Southern Ocean shows zonal banding of alternating positive and negative flux changes.
Model Agreement
There is very strong agreement between IFS-FESOM and IFS-NEMO regarding the sign and magnitude of changes over major landmasses, indicating that the atmospheric component (IFS) dominates the land surface response. Ocean patterns are also broadly consistent, though the Southern Ocean and North Atlantic subpolar regions show subtle structural differences likely attributable to the different ocean grids and mixing physics (unstructured FESOM vs structured NEMO).
Physical Interpretation
The decrease in SHF over the Amazon (blue) suggests either a shift towards higher latent heat flux (wetting) or a reduction in the land-air temperature gradient. Conversely, the increase over Central Africa (red) implies surface drying, forcing energy dissipation via sensible rather than latent heat. In the North Atlantic, the 'blue blob' corresponds to the warming hole (slowed AMOC); the ocean surface warms less than the overlying atmosphere, reducing the upward heat flux. Positive anomalies over western boundary currents likely reflect warmer waters advecting into cooler air regions.
Caveats
- The 10-year future period is relatively short, meaning internal variability (e.g., ENSO, decadal modes) could influence the mean state compared to the 25-year baseline.
- Interpreting land flux changes requires complementary data on precipitation and latent heat flux to fully disentangle soil moisture feedbacks vs. radiative forcing changes.
Sensible Heat Flux Change — IFS-FESOM vs CMIP6 Envelope f_out 17.6%
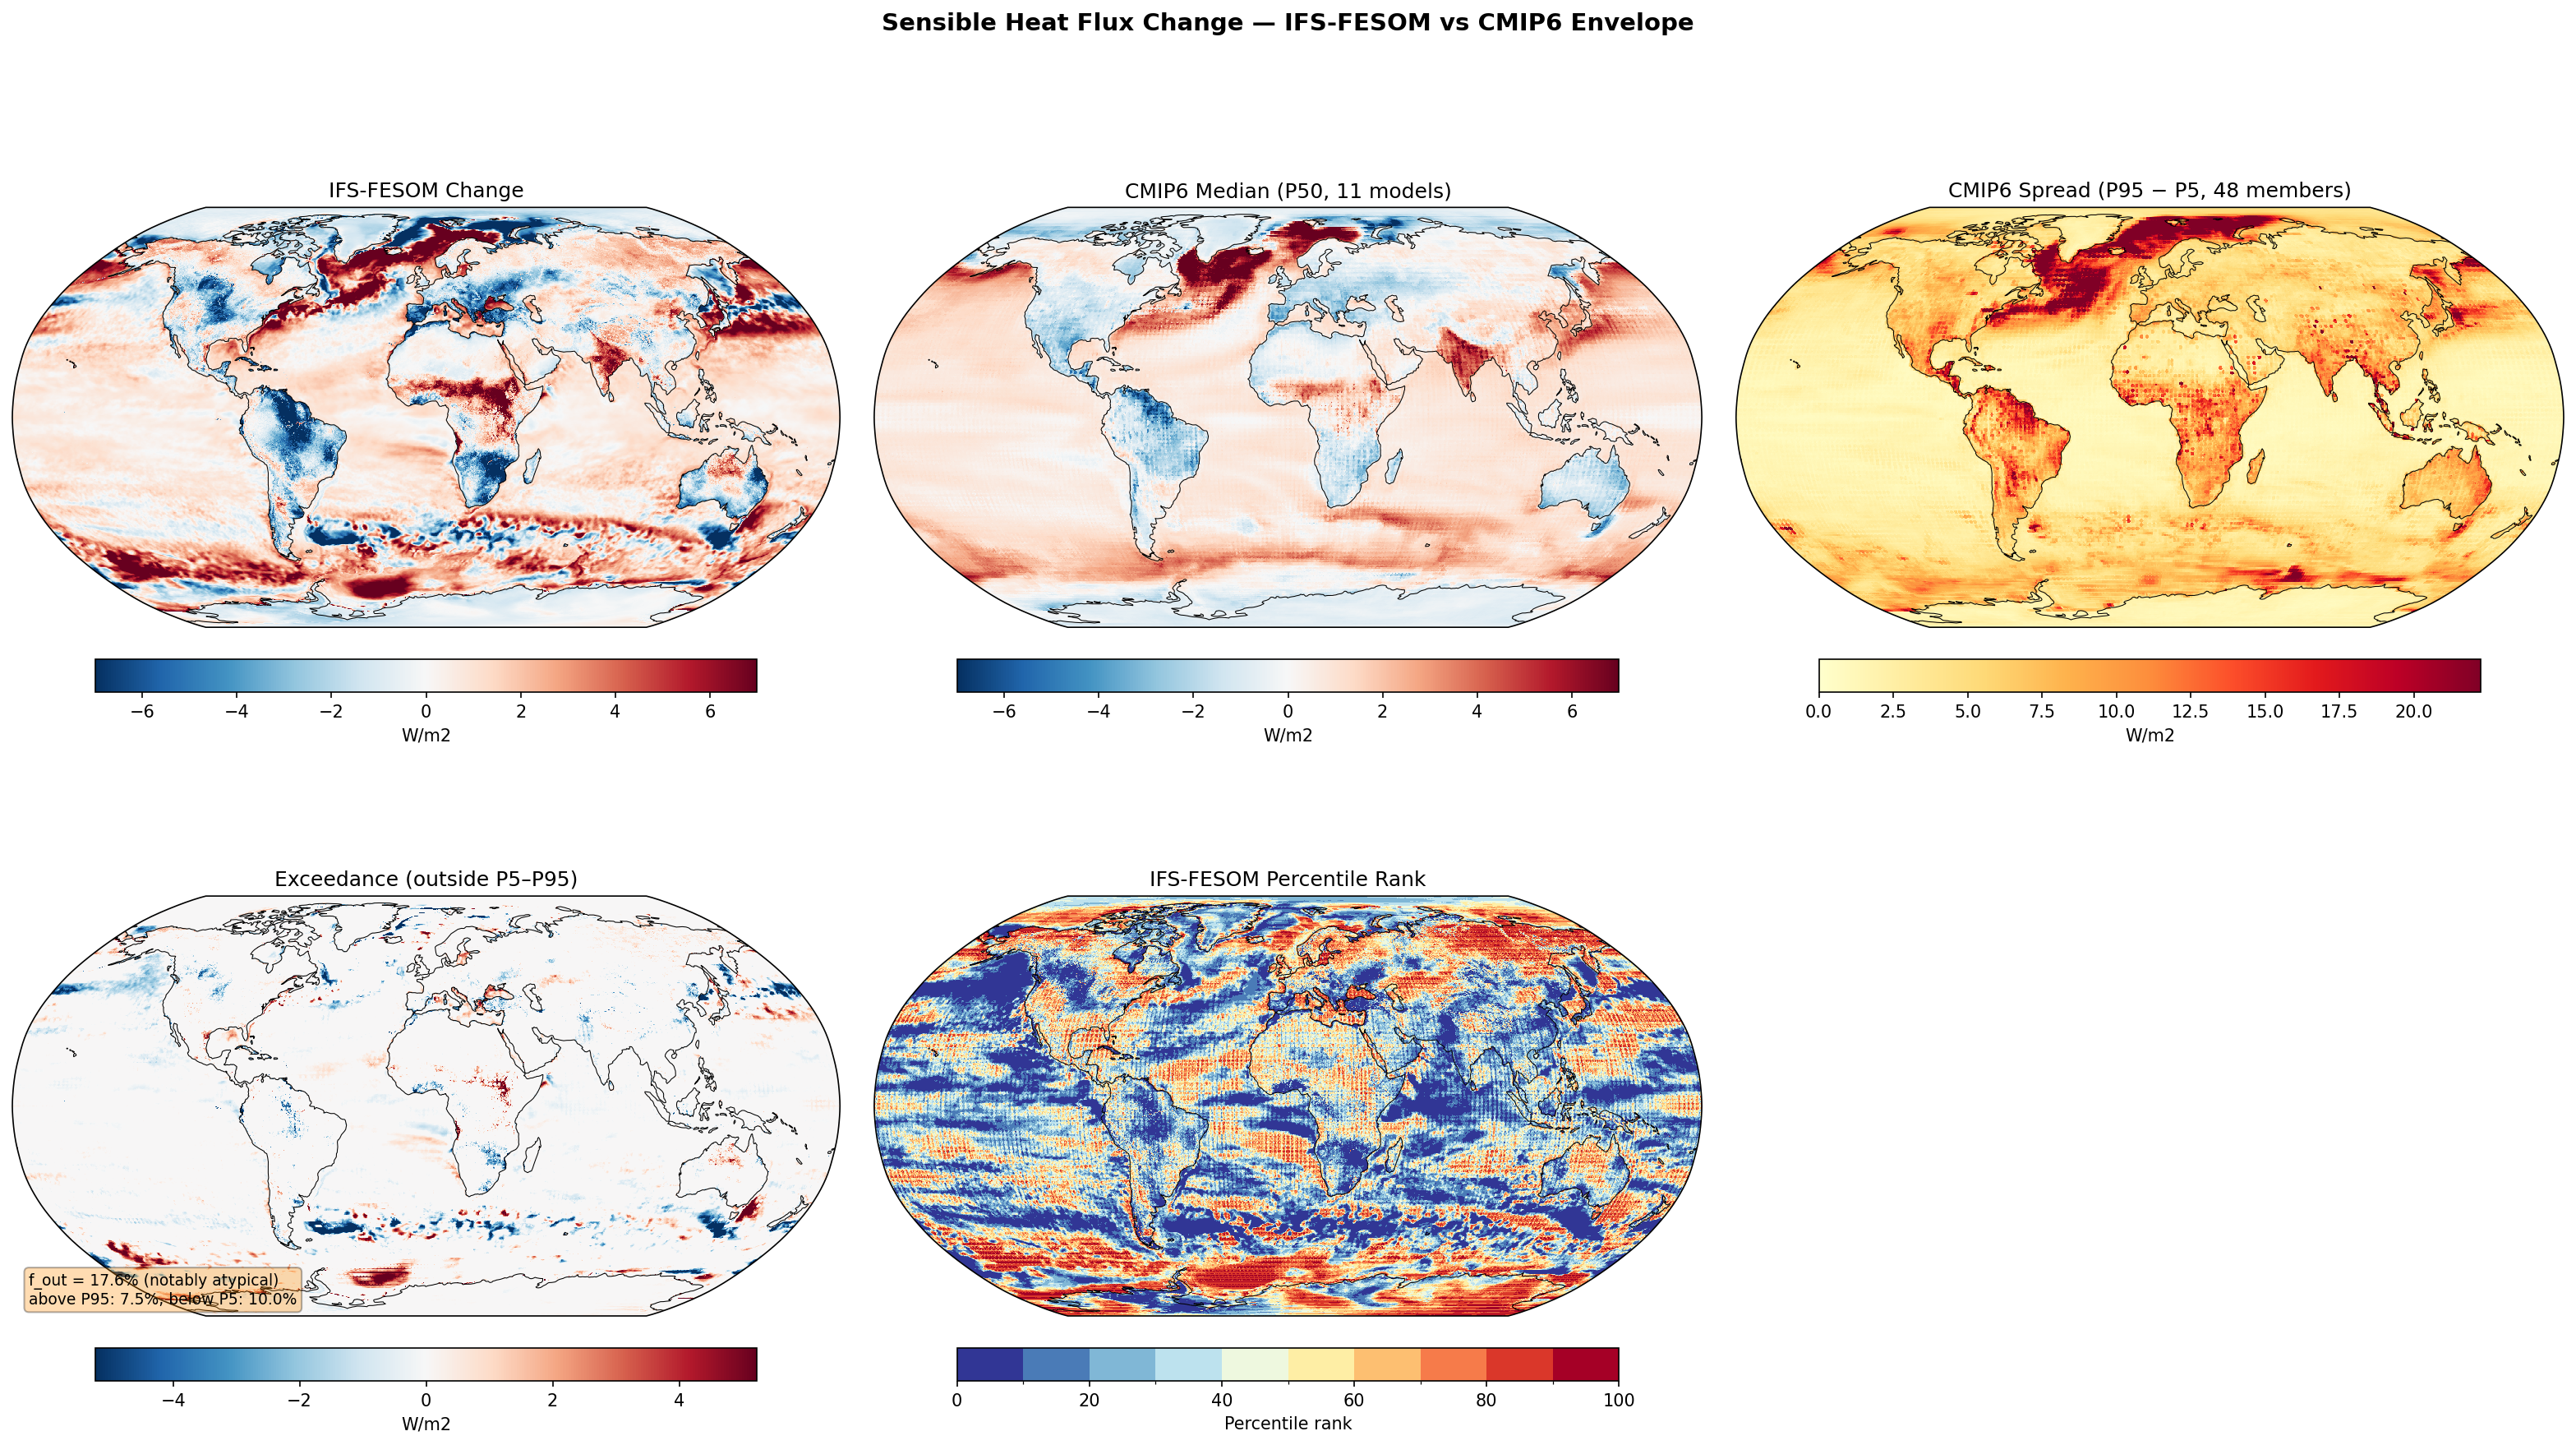
Envelope Metrics
| f_out (outside P5–P95) | 17.6% notably atypical |
|---|---|
| Above P95 | 7.5% |
| Below P5 | 10.0% |
| CMIP6 ensemble | 11 models, 48 members |
| Variables | avg_ishf |
|---|---|
| Models | ifs-fesom |
| Units | W/m2 |
| Baseline | 1990-2014 |
| Future | 2040-2049 |
| Method | Future mean minus historical mean compared to CMIP6 percentile envelope (P5, P50, P95). |
Summary high
IFS-FESOM exhibits a notably atypical sensible heat flux response (f_out = 17.6%) compared to the CMIP6 ensemble, driven primarily by sharp oceanic features in the North Atlantic and Southern Ocean, and distinct hydrological responses over tropical land.
Key Findings
- A strong dipole in the North Atlantic, with significant negative anomalies (below CMIP6 P5) in the subpolar gyre and positive anomalies (above CMIP6 P95) to the north, suggesting distinct AMOC or gyre dynamics.
- The Southern Ocean displays zonal bands of extreme exceedance (both high and low) likely linked to the resolution of sea-ice margins and oceanic fronts.
- Over land, Central Africa shows a marked decrease in sensible heat flux that falls below the CMIP6 P5 threshold, contrasting with the increases seen in adjacent semi-arid regions.
- IFS-FESOM generally agrees with the CMIP6 median on increased sensible heat flux over drying regions like the Amazon, Southern Europe, and North Africa.
Spatial Patterns
The model shows pronounced sensible heat flux increases (red) over the Amazon, Mediterranean, Southern Africa, and the Sahara/Sahel boundary. Conversely, it shows decreases (blue) in the North Atlantic 'warming hole', Central Africa, and parts of the tropical oceans. The Southern Ocean is characterized by sharp, alternating zonal bands of flux increase and decrease.
Model Agreement
Good agreement is found over major drying land masses (Amazon, Mediterranean) where both IFS-FESOM and CMIP6 project increased sensible heat flux due to soil moisture drying (Bowen ratio increase). Disagreement is strongest in the North Atlantic subpolar gyre (IFS-FESOM cooler/lower flux), the Southern Ocean ice edge (sharper gradients in IFS-FESOM), and Central Africa (IFS-FESOM wetter/lower sensible flux).
Physical Interpretation
The North Atlantic pattern is consistent with a strong slowdown of the Atlantic Meridional Overturning Circulation (AMOC) or a shift in the North Atlantic Current, leading to cooler sea surface temperatures and reduced heat release to the atmosphere. In the Southern Ocean, the banding reflects the retreat of sea ice (exposing warm water, increasing flux) and shifts in the Antarctic Circumpolar Current fronts, which are resolved more sharply at ~5 km than in coarse CMIP6 models. The Central Africa anomaly suggests IFS-FESOM maintains higher evapotranspiration rates (partitioning energy to latent rather than sensible heat) compared to the ensemble.
Caveats
- The 17.6% exceedance is partly due to the 'double penalty' effect where high-resolution features (e.g., narrow ocean fronts) are spatially mismatched with the smoothed CMIP6 mean.
- Short 10-year analysis periods may conflate internal variability (e.g., AMOC phases, decadal oscillations) with the forced climate change signal.
Sensible Heat Flux Change — IFS-NEMO vs CMIP6 Envelope f_out 15.7%
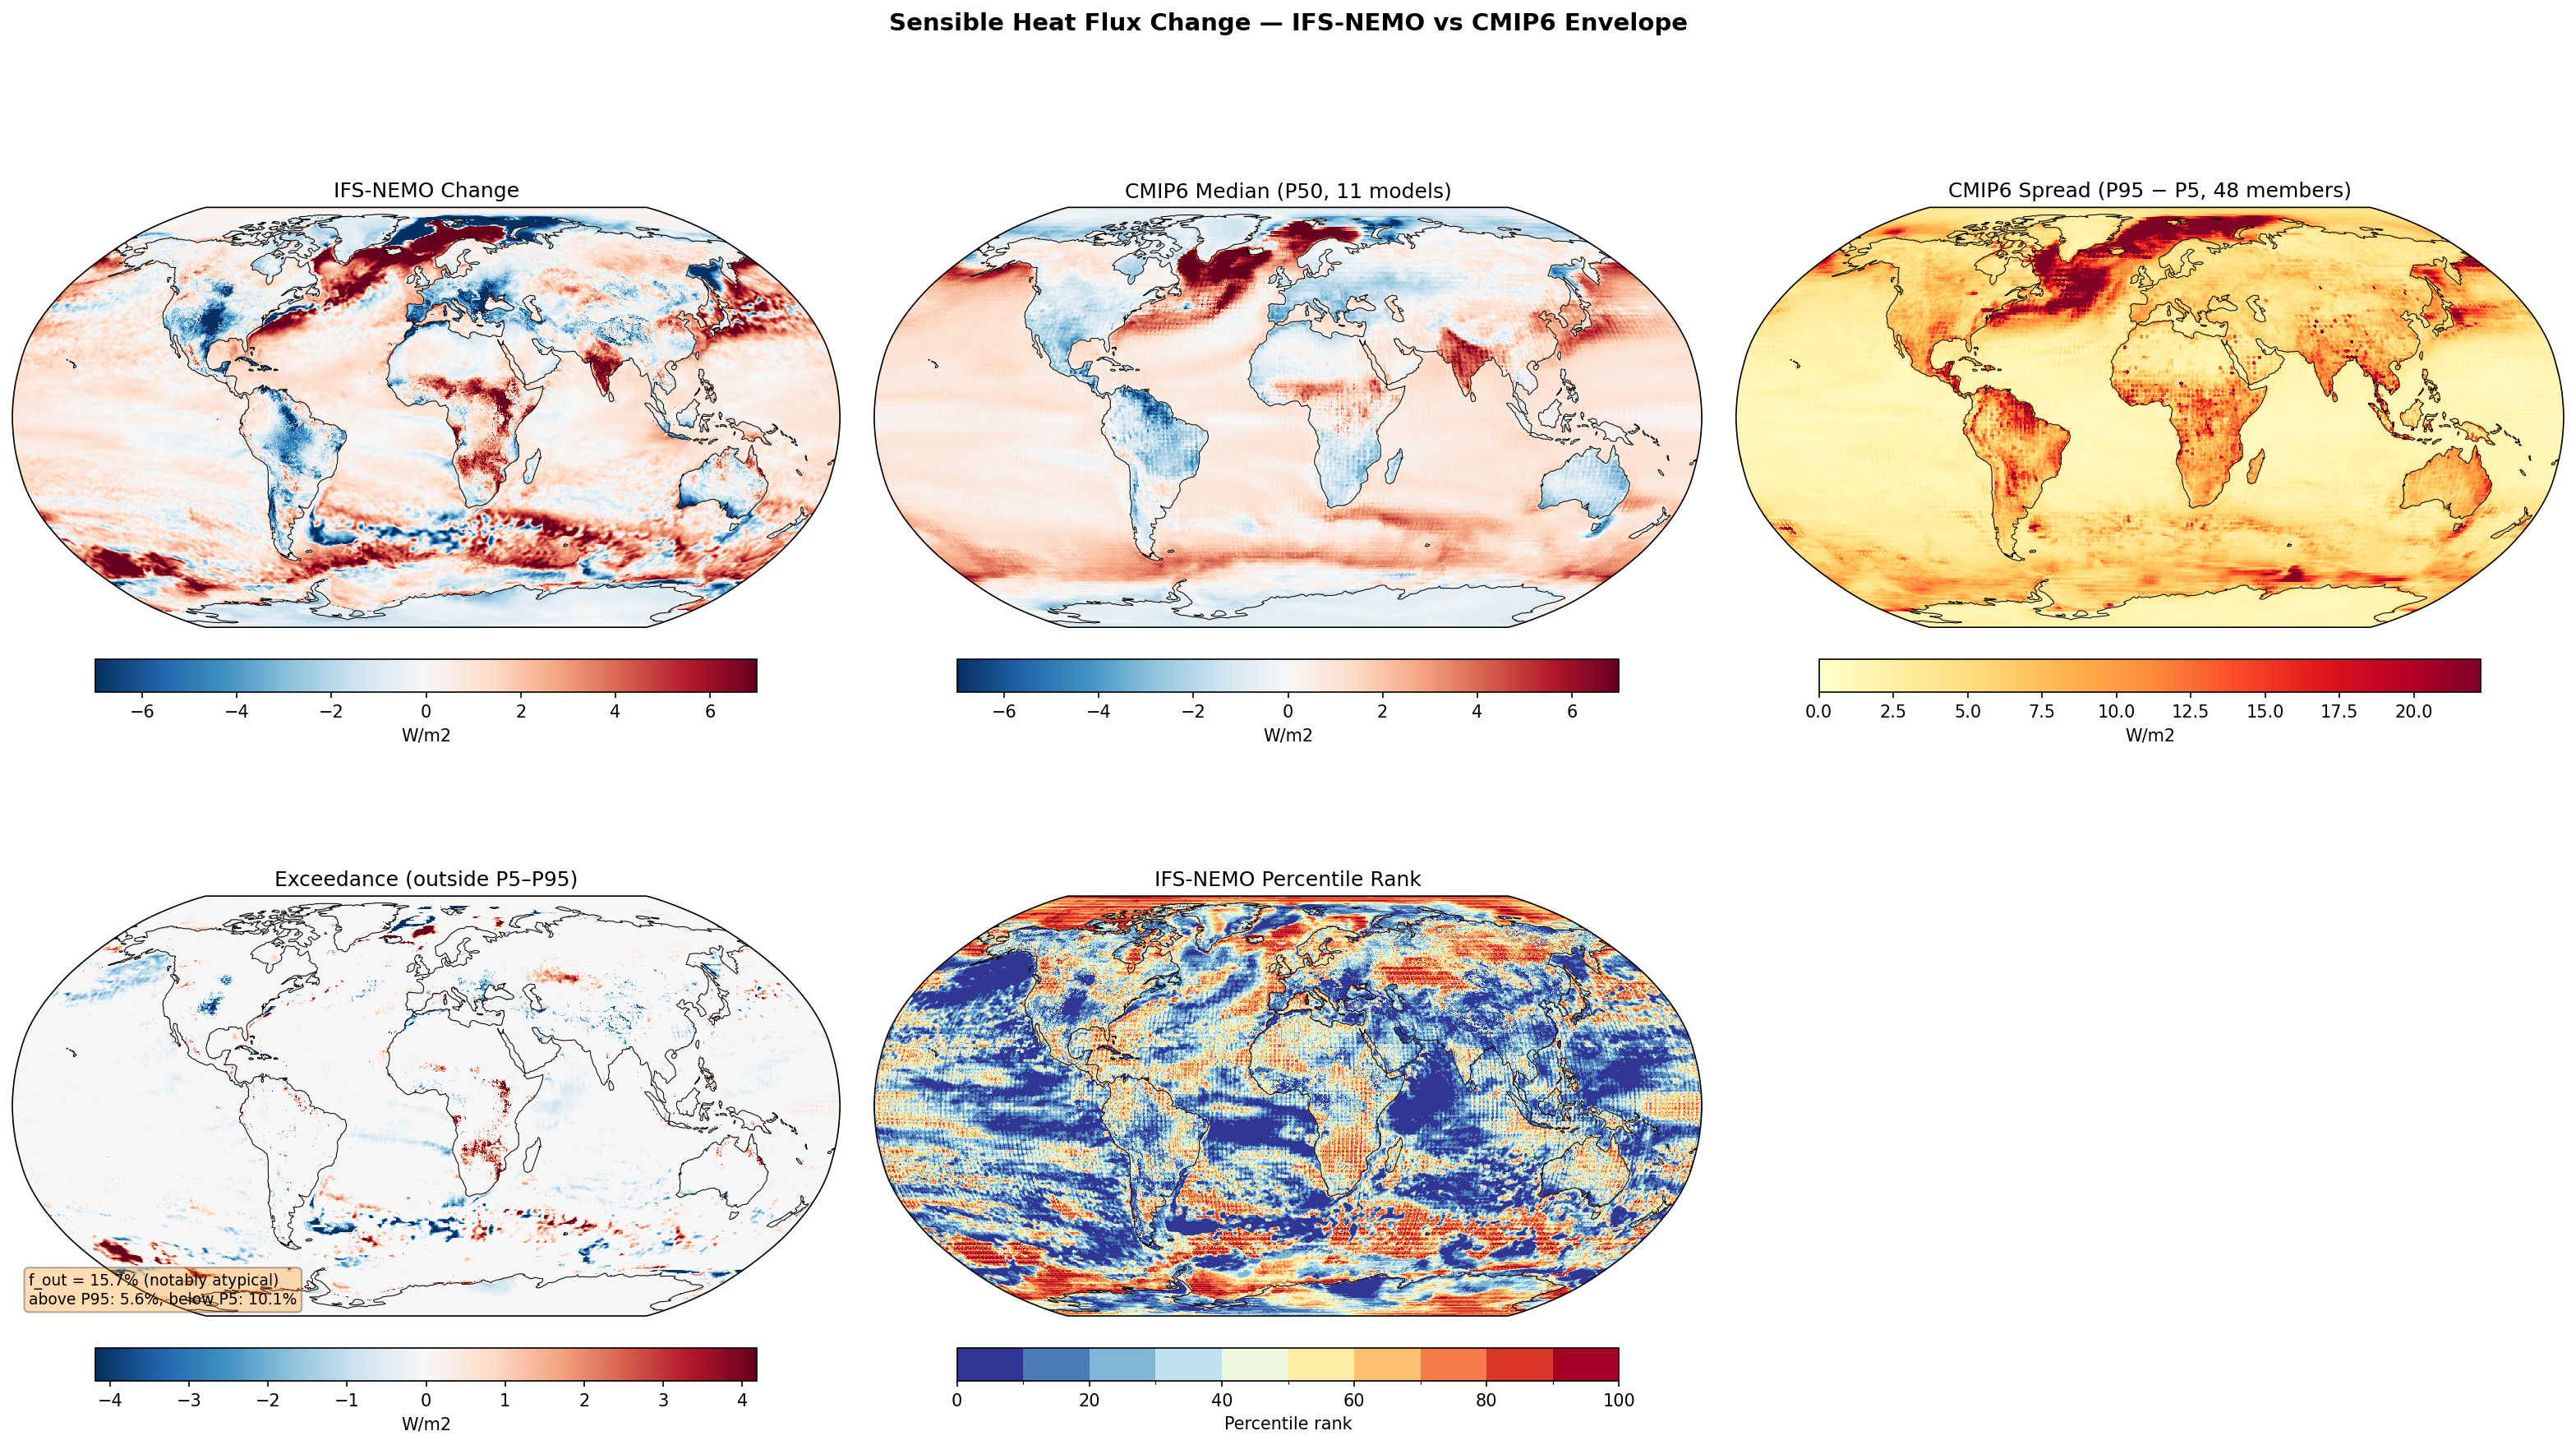
Envelope Metrics
| f_out (outside P5–P95) | 15.7% notably atypical |
|---|---|
| Above P95 | 5.6% |
| Below P5 | 10.1% |
| CMIP6 ensemble | 11 models, 48 members |
| Variables | avg_ishf |
|---|---|
| Models | ifs-nemo |
| Units | W/m2 |
| Baseline | 1990-2014 |
| Future | 2040-2049 |
| Method | Future mean minus historical mean compared to CMIP6 percentile envelope (P5, P50, P95). |
Summary high
IFS-NEMO exhibits a notably atypical sensible heat flux response (f_out = 15.7%), characterised by widespread lower-than-CMIP6 changes over tropical oceans contrasted with intense positive anomalies exceeding CMIP6 upper bounds in high-latitude sea-ice loss regions and parts of Africa.
Key Findings
- High-Latitude Ocean Fluxes: Intense positive sensible heat flux increases in the Labrador Sea, Nordic Seas, and Sea of Okhotsk exceed the CMIP6 P95, driven by sharp sea-ice retreat and air-sea interaction.
- Tropical Ocean Suppression: Large areas of the Pacific and Atlantic oceans show percentile ranks < 20, indicating IFS-NEMO predicts significantly lower (more negative) sensible heat flux changes than the CMIP6 ensemble.
- African Continental Response: A distinct region of high positive exceedance appears over Central/Southern Africa, suggesting stronger surface warming-driven fluxes or drying trends compared to the CMIP6 median.
- Southern Ocean Dynamics: Resolved mesoscale features create banded zonal structures in flux changes that are smoothed out in the coarser CMIP6 ensemble.
Spatial Patterns
The North Atlantic displays a strong dipole: positive anomalies in the subpolar gyre (sea ice edge) and negative anomalies in the Gulf Stream extension. Over land, Africa and India show strong positive flux increases. The global tropical oceans are dominated by negative change anomalies or weak responses relative to CMIP6.
Model Agreement
IFS-NEMO agrees with the CMIP6 median on the sign of changes in the Arctic (sea ice loss warming) and the North Atlantic warming hole (cooling/flux reduction), but disagrees significantly on the magnitude and spatial granularity, particularly in the Southern Ocean and over the African continent.
Physical Interpretation
The positive exceedances in high latitudes result from sea-ice loss exposing warmer waters to cold overlying air, a process likely better resolved in IFS-NEMO. The widespread lower percentile ranks over tropical oceans suggest either a slower SST warming rate compared to the atmosphere (increasing stability) or specific bias patterns in the model. The strong signal over Africa implies intense surface heating and potentially different soil moisture feedbacks (Bowen ratio shifts) compared to the CMIP6 mean.
Caveats
- The 10-year future window (2040-2049) is short and susceptible to internal decadal variability, particularly in the North Atlantic and Pacific.
- The 10.1% of area falling below the CMIP6 P5 threshold suggests a systematic difference in ocean-atmosphere coupling or SST warming rates in the tropics that warrants investigation.
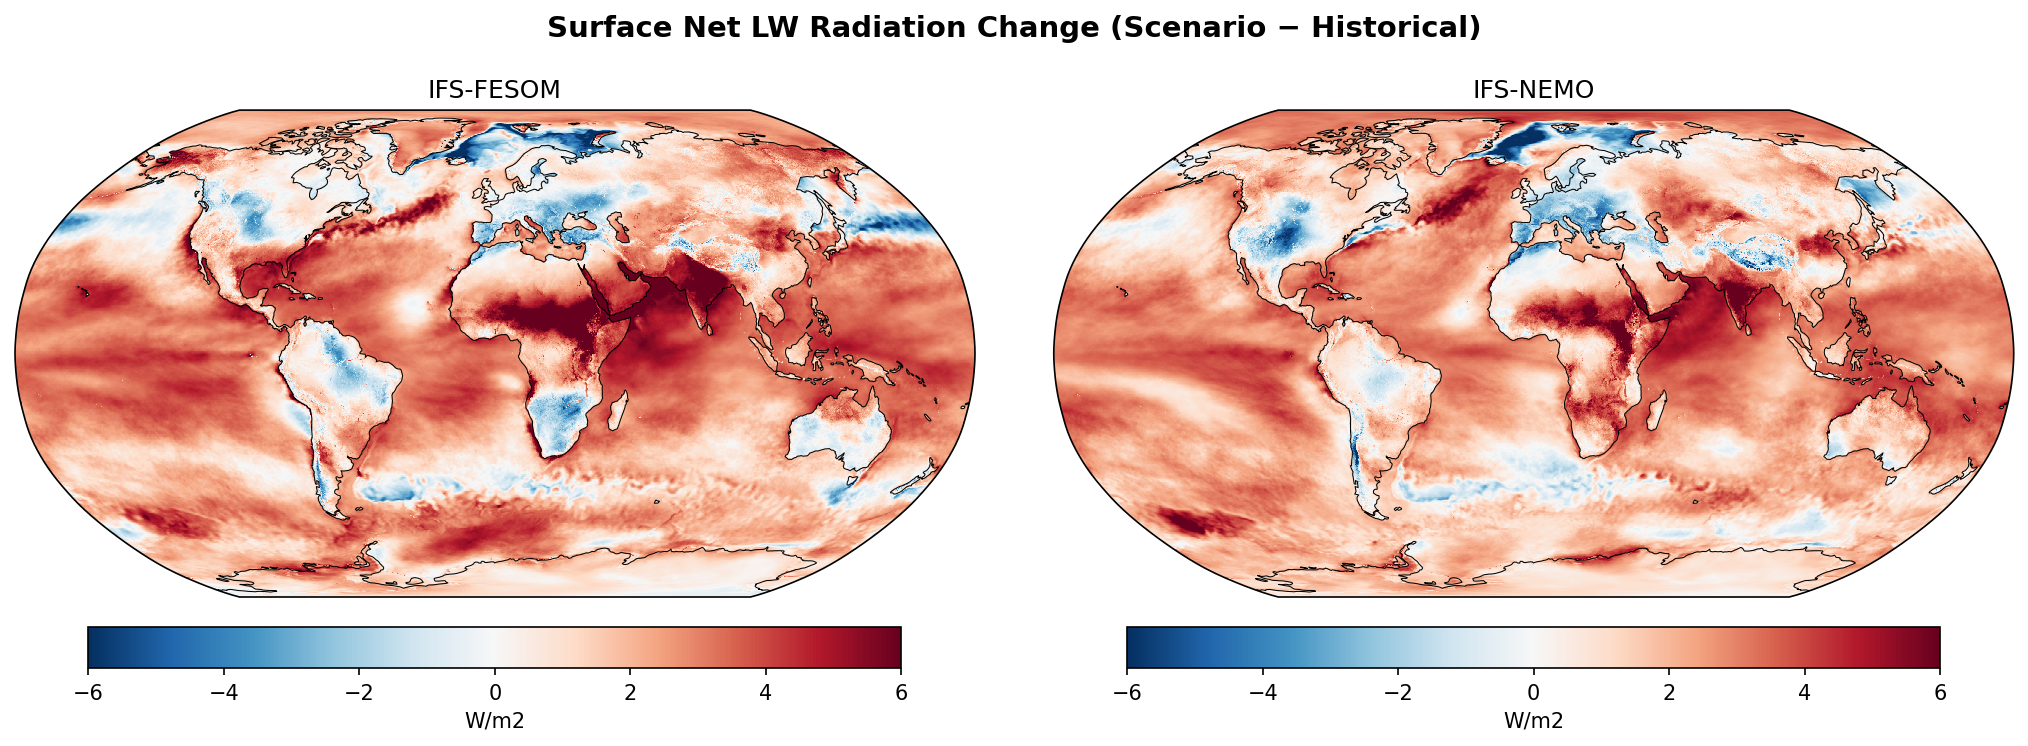
Surface Net LW Radiation Change
| Variables | avg_snlwrf |
|---|---|
| Models | ifs-fesom, ifs-nemo |
| Units | W/m2 |
| Baseline | 1990-2014 |
| Future | 2040-2049 |
| Method | Future mean minus historical mean. |
Summary high
The figure illustrates the projected change in surface net longwave (LW) radiation for the 2040s (SSP3-7.0) relative to the baseline (1990-2014) for two high-resolution models, IFS-FESOM and IFS-NEMO. Both models predict a widespread increase in net surface LW energy (red) over continents and tropical oceans, driven by the enhanced greenhouse effect, punctuated by distinct regions of negative change (blue) over sea-ice loss zones and specific tropical areas.
Key Findings
- Widespread positive change (increased net energy intake) over land masses and most non-polar oceans, typically +2 to +6 W/m².
- Strong negative anomalies (decreased net energy intake) along Arctic and Antarctic sea-ice margins, particularly in the Barents, Greenland, and Weddell Seas.
- IFS-FESOM exhibits a more pronounced and spatially coherent negative anomaly in the subpolar North Atlantic (south of Greenland) compared to the more diffuse pattern in IFS-NEMO.
- Tropical drying signatures are visible as negative anomalies over the Amazon and parts of the Atlantic, likely indicating reduced cloud cover.
Spatial Patterns
The dominant pattern is a global increase in surface net LW radiation (red), strongest over North Africa, the Middle East, and Eurasia. This is interrupted by sharp blue patches at high latitudes corresponding to retreating sea-ice edges. In the North Atlantic, a 'warming hole' like feature is visible as a region of negative or suppressed change. The Amazon basin and localized regions in the tropical Atlantic also show negative changes (blue/white), contrasting with the surrounding positive tropical response.
Model Agreement
The models show high agreement on the broad thermodynamic response, including the land-sea contrast and the sign of change in sea-ice regions. Disagreements are primarily regional and likely grid-dependent: IFS-FESOM resolves a sharper negative feature in the North Atlantic subpolar gyre and shows slightly more granular structures in the Southern Ocean compared to IFS-NEMO. These differences likely stem from how the distinct ocean grids (unstructured FESOM vs. curvilinear NEMO) handle boundary currents and deep convection.
Physical Interpretation
The pervasive red signal indicates that the increase in downwelling LW radiation (due to higher atmospheric CO₂ and water vapor) generally outpaces the increase in surface upwelling LW emission. In contrast, the blue areas over sea-ice loss regions arise because the surface temperature increases drastically (from sub-freezing to near-freezing) as ice disappears; the resulting surge in upwelling LW emission ($\sigma T^4$) exceeds the atmospheric feedback, reducing the net LW flux. In the Amazon and North Atlantic, negative anomalies likely reflect reduced cloud cover (less downwelling LW), linked to regional drying or circulation changes.
Caveats
- The analysis relies on the sign convention where positive equals energy into the surface; while consistent with the patterns, this is inferred.
- Without the CMIP6 envelope panels, it is difficult to assess if the sharp regional features (e.g., in the North Atlantic) are within the standard model spread or unique to these high-resolution runs.
Surface Net LW Radiation Change — IFS-FESOM vs CMIP6 Envelope f_out 11.2%
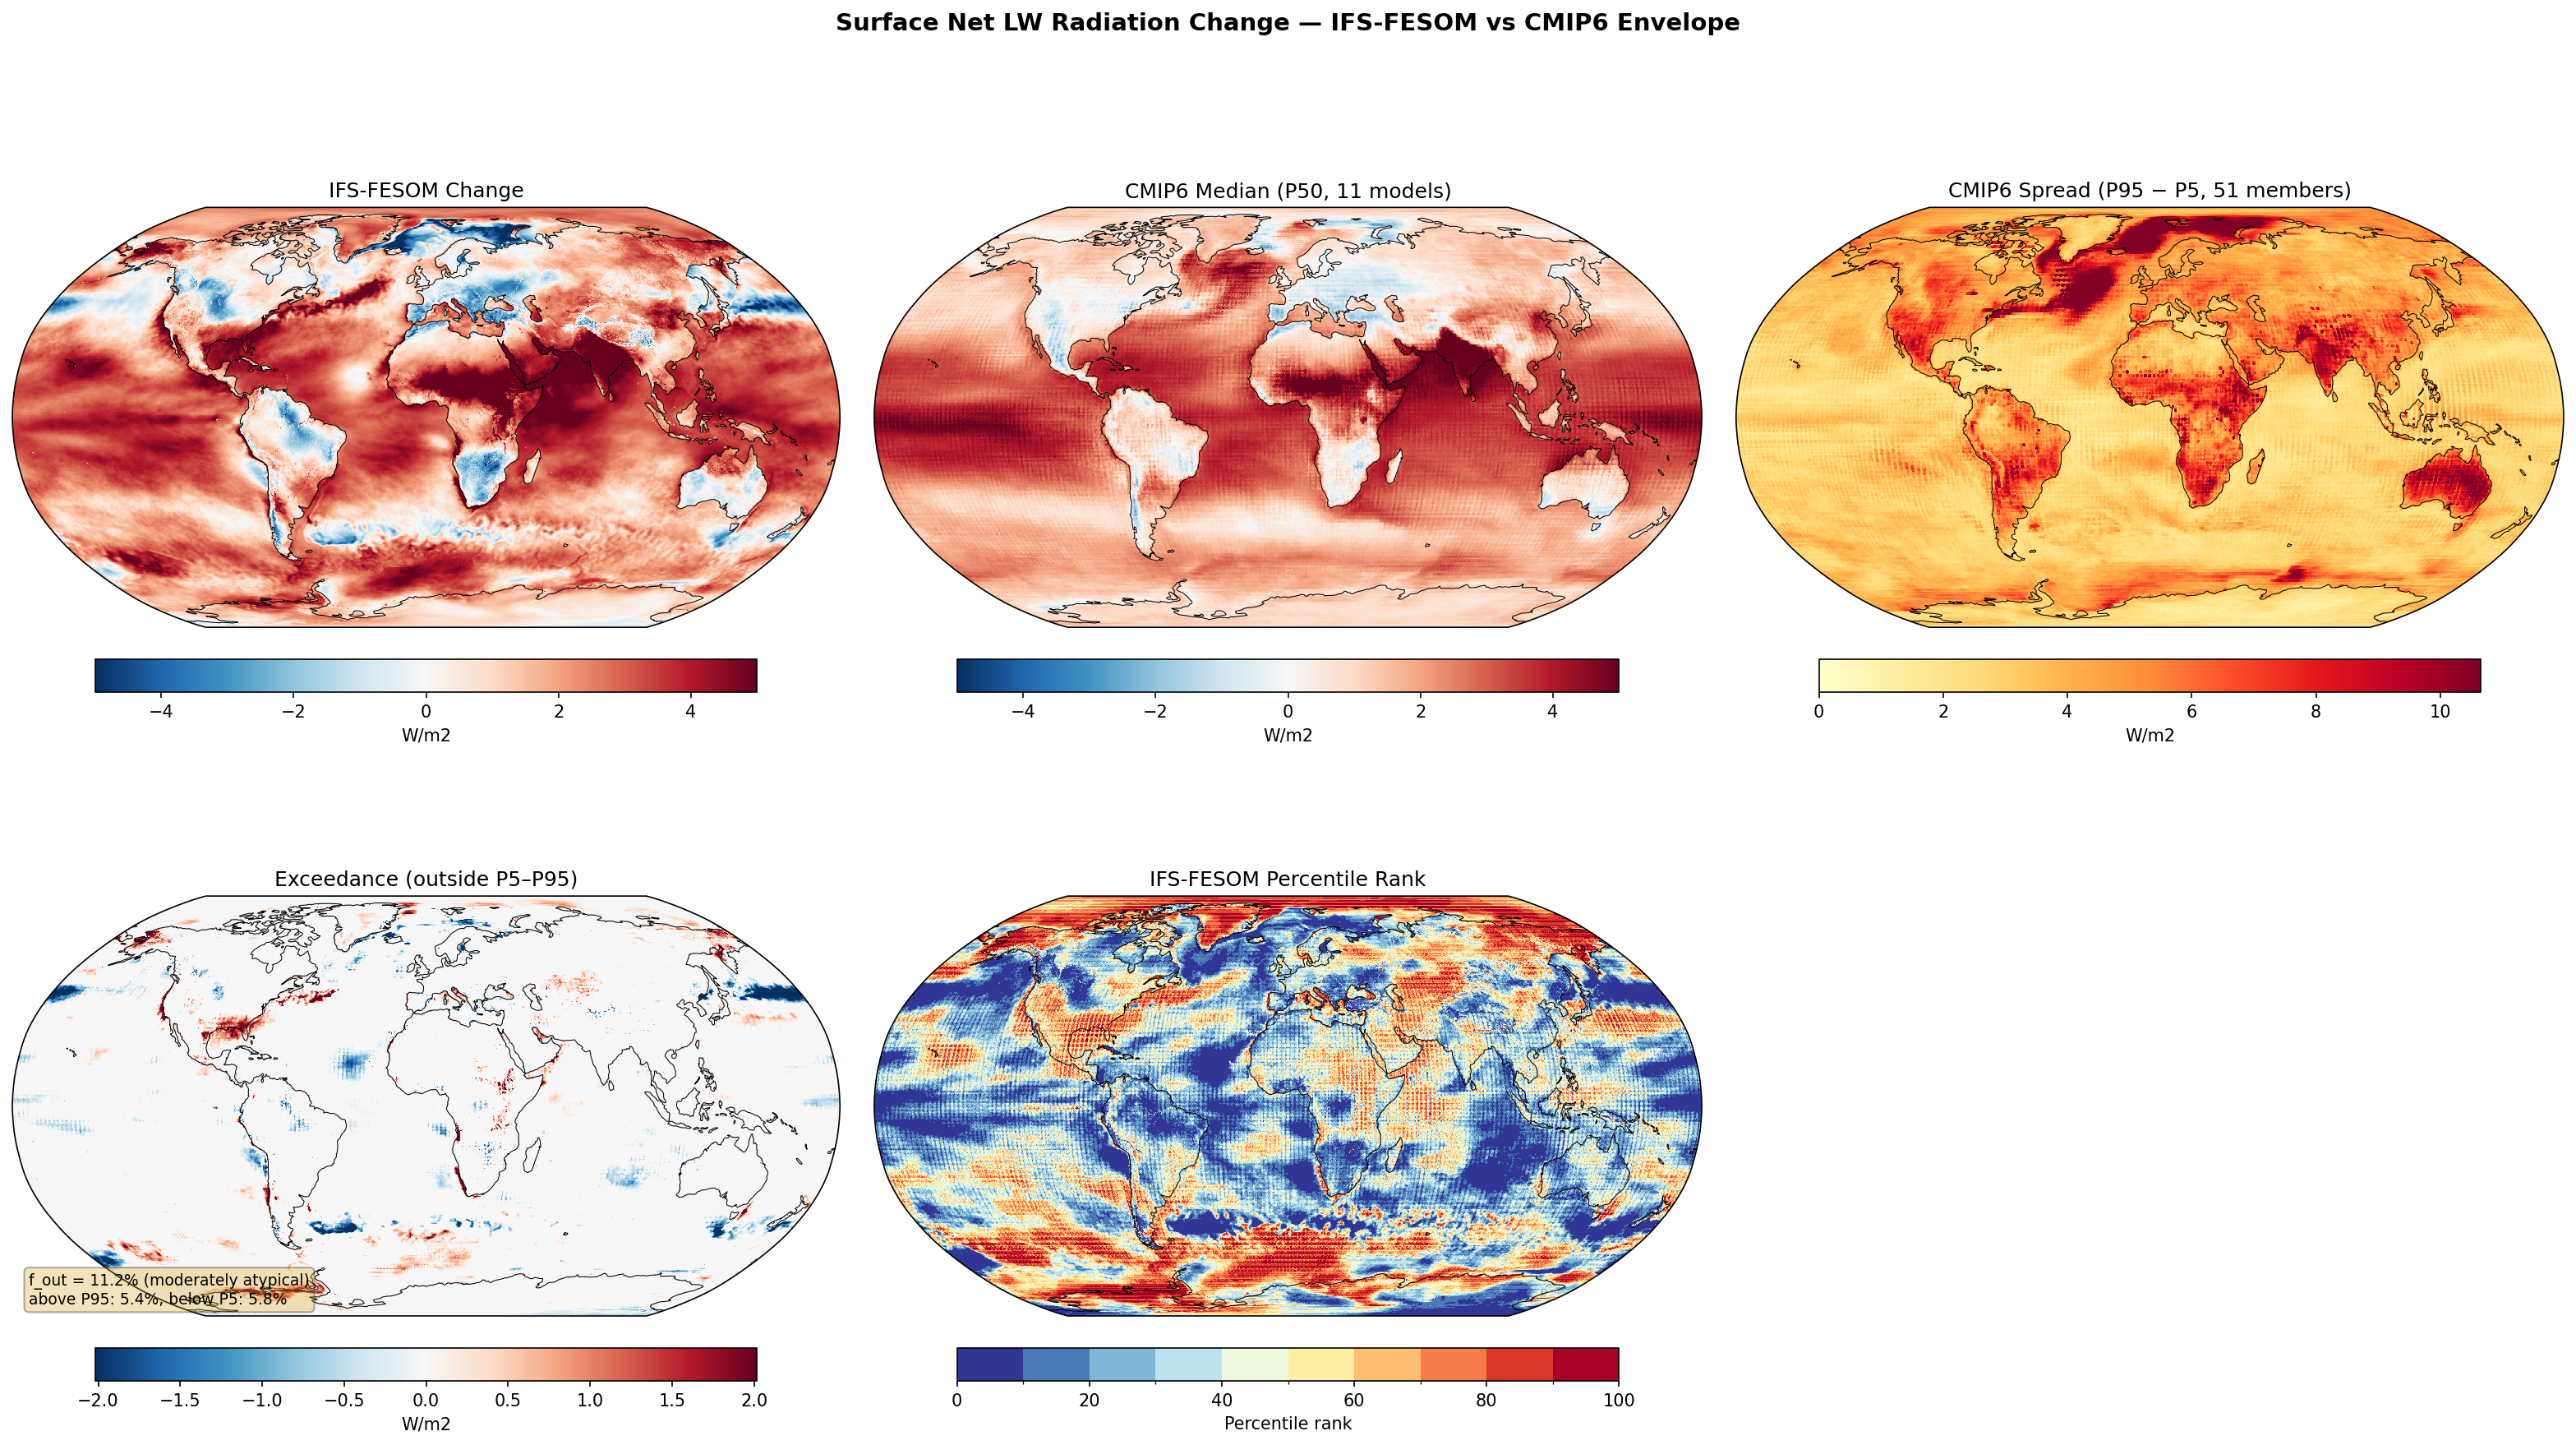
Envelope Metrics
| f_out (outside P5–P95) | 11.2% moderately atypical |
|---|---|
| Above P95 | 5.4% |
| Below P5 | 5.8% |
| CMIP6 ensemble | 11 models, 51 members |
| Variables | avg_snlwrf |
|---|---|
| Models | ifs-fesom |
| Units | W/m2 |
| Baseline | 1990-2014 |
| Future | 2040-2049 |
| Method | Future mean minus historical mean compared to CMIP6 percentile envelope (P5, P50, P95). |
Summary high
IFS-FESOM projects Surface Net Longwave Radiation changes largely consistent with the CMIP6 ensemble over land, but exhibits distinct deviations in the North Atlantic and subtropical oceans, resulting in a moderately atypical disagreement fraction (f_out = 11.2%).
Key Findings
- IFS-FESOM falls below the CMIP6 5th percentile (P5) in the North Atlantic and eastern subtropical ocean basins, indicating a stronger reduction in net longwave energy input than projected by most CMIP6 models.
- Over major land masses (South America, Africa, India), IFS-FESOM shows strong agreement with the CMIP6 median, predicting increased net longwave radiation consistent with the enhanced greenhouse effect.
- The Southern Ocean exhibits bands of positive exceedance (above P95), suggesting IFS-FESOM simulates stronger increases in net longwave input near the sea-ice edge compared to the ensemble.
Spatial Patterns
The map is dominated by positive changes (red, net energy gain) over land and the tropical Indian/West Pacific oceans. In contrast, marked negative changes (blue, net energy loss) appear in the North Atlantic 'warming hole' region and the eastern subtropical Pacific and Atlantic. IFS-FESOM amplifies these negative oceanic patterns compared to the CMIP6 median.
Model Agreement
Agreement is strong over continental regions where increased atmospheric opacity (water vapor/CO2) drives positive net longwave anomalies (percentile ranks ~40-70). Significant disagreement occurs in the North Atlantic (ranks <5) and eastern ocean basins, where IFS-FESOM is an outlier on the negative side.
Physical Interpretation
The negative exceedance in the North Atlantic likely reflects a stronger AMOC slowdown and associated cooling in IFS-FESOM compared to the CMIP6 median; cooler sea surface temperatures reduce evaporation and atmospheric water vapor/cloud cover, leading to a sharp reduction in downward longwave radiation. Similarly, signals in the eastern subtropical basins may relate to differences in stratocumulus cloud feedbacks or stability changes resolved differently at high resolution.
Caveats
- Differences in cloud microphysics schemes between IFS-FESOM and the CMIP6 ensemble heavily influence longwave radiation budgets.
- The 10-year future window (2040-2049) may be influenced by internal decadal variability, particularly in the North Atlantic.
Surface Net LW Radiation Change — IFS-NEMO vs CMIP6 Envelope f_out 14.3%
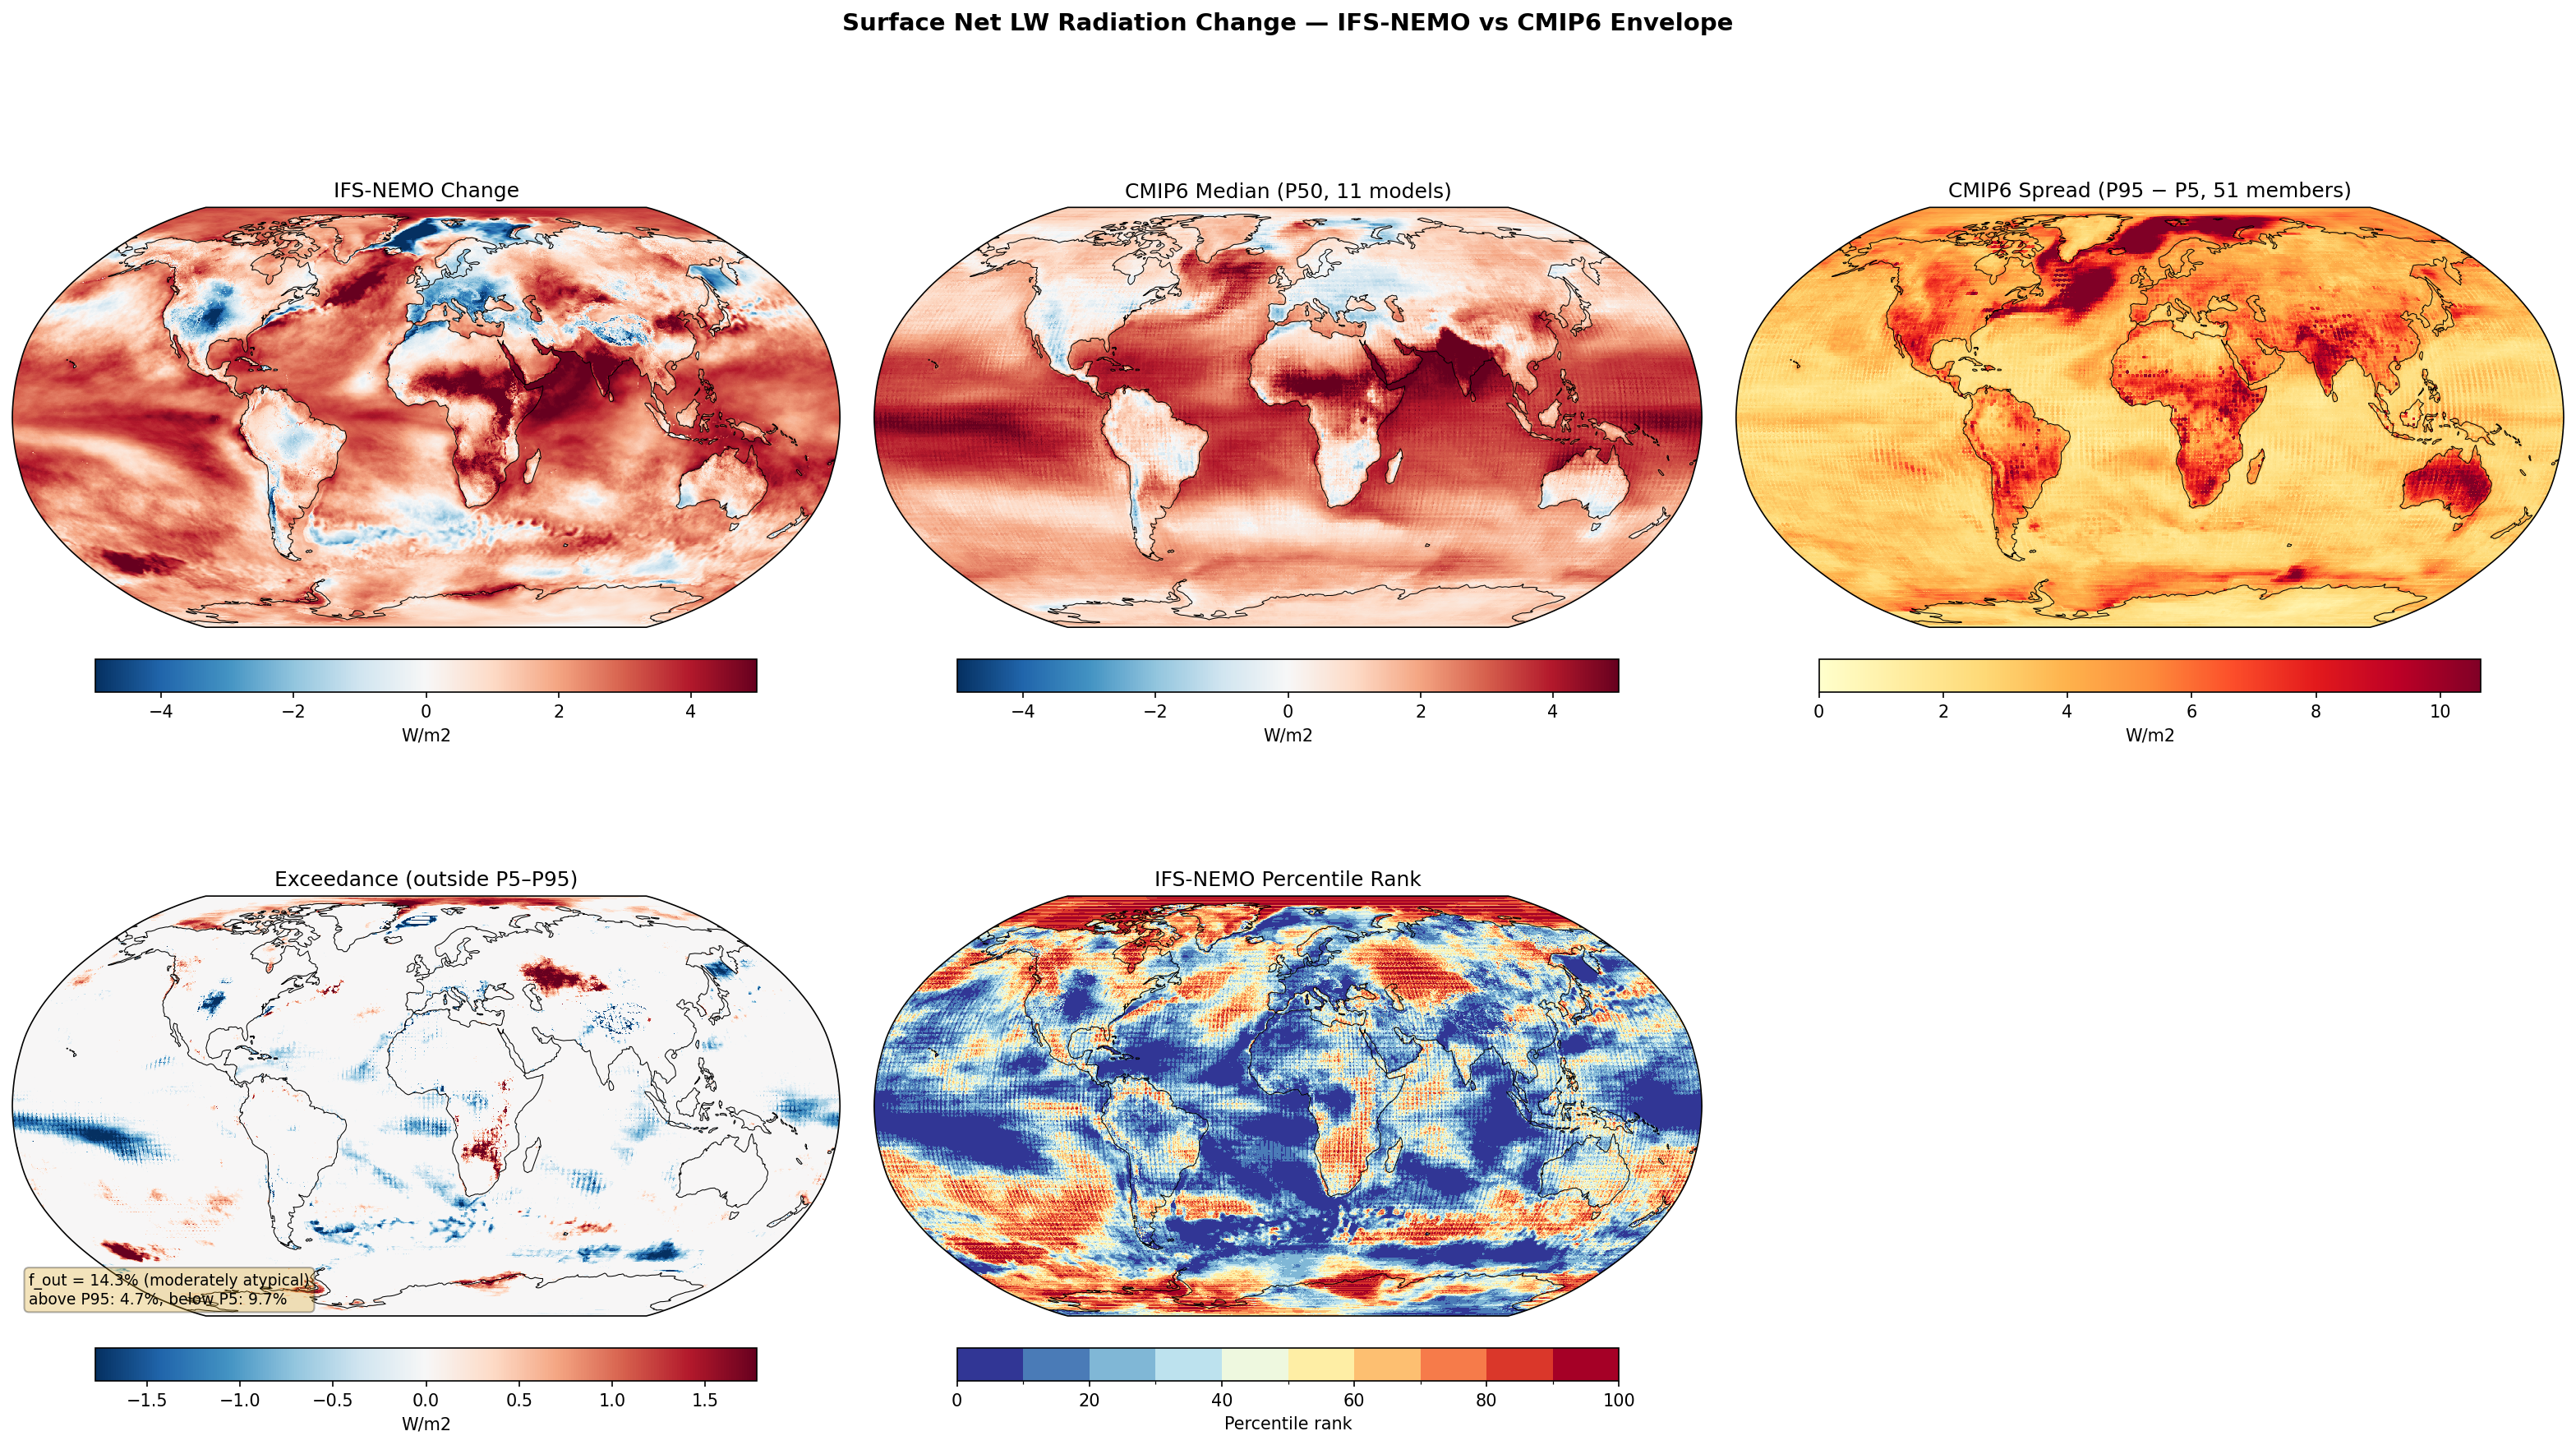
Envelope Metrics
| f_out (outside P5–P95) | 14.3% moderately atypical |
|---|---|
| Above P95 | 4.7% |
| Below P5 | 9.7% |
| CMIP6 ensemble | 11 models, 51 members |
| Variables | avg_snlwrf |
|---|---|
| Models | ifs-nemo |
| Units | W/m2 |
| Baseline | 1990-2014 |
| Future | 2040-2049 |
| Method | Future mean minus historical mean compared to CMIP6 percentile envelope (P5, P50, P95). |
Summary high
IFS-NEMO exhibits a moderately atypical response (f_out = 14.3%) in Surface Net Longwave Radiation change compared to CMIP6. The model is characterized by significantly weaker—and often negative—changes over vast oceanic regions (falling below the CMIP6 5th percentile), contrasting with stronger positive anomalies over specific land areas like Central Asia.
Key Findings
- IFS-NEMO displays a stark land-sea contrast: oceanic regions largely fall in the lowest percentiles (0–10%) of the CMIP6 distribution, while land regions often track the median or upper percentiles.
- A notable 9.7% of the global area falls below the CMIP6 P5 threshold, dominated by the North Atlantic, North Pacific, and tropical oceans, where IFS-NEMO shows negative net LW change (cooling surface tendency relative to historical) versus the positive CMIP6 median.
- IFS-NEMO exceeds the CMIP6 P95 envelope (4.7% of area) primarily in Central Asia, Southern Africa, and localized parts of the Southern Ocean, indicating stronger radiative heating in these regions.
Spatial Patterns
The spatial pattern is dominated by a global oceanic 'blue' shift in the percentile rank map, indicating IFS-NEMO consistently predicts lower net LW changes than the CMIP6 ensemble over water. Specifically, the North Atlantic warming hole region shows a distinct negative anomaly. Over land, patterns are more heterogeneous, with intense positive changes (red in change map) over the Amazon, Sahara, and Australia, though these generally align with the CMIP6 median or P95.
Model Agreement
The model agrees well with CMIP6 on the general sign of change over land and the Arctic (positive net LW change). The primary disagreement is over the global oceans, where IFS-NEMO suggests a decrease or neutral change in net LW radiation, whereas the CMIP6 median suggests a widespread increase (0 to +4 W/m2).
Physical Interpretation
Net LW radiation is the balance between downward atmospheric emission and upward surface emission. A decrease (or weaker increase) in Net LW over oceans suggests that in IFS-NEMO, the increase in upward emission (due to SST warming) is not being compensated by a sufficient increase in downward emission (from GHGs, water vapor, and clouds) to the same extent as in CMIP6. This could point to differences in cloud feedbacks (e.g., a reduction in low cloud cover) or a drier marine boundary layer in the high-resolution simulation. The specific anomaly in the North Atlantic may be linked to coupled ocean dynamics (e.g., AMOC slowing) resolving distinct SST patterns.
Caveats
- The 10-year analysis period (2040–2049) is susceptible to internal variability (e.g., ENSO, PDO phases), which may heavily influence the oceanic patterns compared to the larger CMIP6 ensemble mean.
- Differences in surface emissivity or skin temperature parameterizations between IFS-NEMO and standard CMIP6 models could contribute to the systematic offset over liquid water.
Surface Net SW Radiation Change
| Variables | avg_snswrf |
|---|---|
| Models | ifs-fesom, ifs-nemo, CMIP6-MMM |
| Units | W/m2 |
| Baseline | 1990-2014 |
| Future | 2040-2049 |
| Method | Future mean minus historical mean. |
Summary medium
The figure contrasts projected changes in surface net shortwave radiation (2040–2049 vs 1990–2014) between high-resolution DestinE models (IFS-FESOM, IFS-NEMO) and the CMIP6 multi-model mean. The high-resolution models exhibit sharper, higher-magnitude anomalies with a distinct 'land-brightening / tropical-ocean-dimming' contrast, whereas CMIP6-MMM shows a smoother, predominantly negative (dimming) signal, particularly in polar regions.
Key Findings
- High-resolution models (IFS-FESOM/NEMO) project strong increases in net surface shortwave radiation (brightening) over Europe, North America, and specific sea-ice loss regions (e.g., Hudson Bay, Barents Sea), likely due to reduced cloud cover and albedo feedback.
- Conversely, the IFS models show intense decreases in net shortwave radiation (dimming) across the tropical Atlantic, Africa, and Indian Ocean, suggesting a more vigorous intensification of the ITCZ and associated cloudiness compared to CMIP6.
- A major divergence occurs in the Arctic and Southern Oceans: CMIP6-MMM shows widespread decreases in net shortwave radiation (blue), whereas IFS models show localized, strong increases (red) consistent with surface albedo reduction from sea-ice loss.
- IFS-FESOM and IFS-NEMO show high structural agreement, indicating that the atmospheric model physics (cloud/convection schemes) dominate the surface radiation response over the specific choice of ocean grid.
Spatial Patterns
The IFS models display a granular, high-contrast pattern with a notable dipole: strong negative anomalies (blue, -4 to -6 W/m2) in the tropical convective belts (ITCZ region over Atlantic/Africa/India) and positive anomalies (red, +2 to +6 W/m2) over mid-latitude landmasses and sea-ice edges. The CMIP6-MMM is spatially smooth, dominated by weak negative anomalies over oceans and high latitudes, lacking the sharp positive land signals seen in the DestinE simulations.
Model Agreement
The two DestinE models agree closely on spatial patterns and magnitude. However, they disagree significantly with the CMIP6-MMM. Where DestinE predicts clearing/brightening over Europe and North America, CMIP6 suggests neutral or slight dimming conditions. In the Arctic, the DestinE models capture localized albedo-driven warming (positive net SW) which appears absent or overwhelmed by cloud masking/averaging in the CMIP6 mean.
Physical Interpretation
The strong negative anomalies in the tropics in IFS models likely reflect an intensified hydrological cycle and increased cloud optical depth in the ITCZ under warming (SSP3-7.0). The positive anomalies over mid-latitude land in IFS suggest a reduction in cloud fraction or aerosol optical depth (brightening). In the Arctic, the red patches in IFS models are physically consistent with the ice-albedo feedback (melting ice -> lower albedo -> more absorbed SW); the anomalous blue signal in CMIP6-MMM suggests that in the ensemble mean, increased cloud cover might be outweighing albedo changes, or that spatial smearing dilutes the sharp ice-edge signals.
Caveats
- The CMIP6-MMM Arctic signal (negative net SW change) is counter-intuitive for a warming scenario dominated by sea-ice loss; this may result from strong cloud feedbacks in the ensemble mean or potential inconsistencies in variable definitions across the ensemble.
- Differences may partly stem from internal variability (weather noise) in the short 10-year future window of the single-member IFS runs, whereas CMIP6-MMM averages out this variability.