Tier 1 Cloud Radiative Effect CMIP6 f_out 25.1%
CMIP6 Envelope Comparison
DestinE anomalies compared to the CMIP6 P5–P95 percentile envelope derived from 51 ensemble members across 11 models under SSP3-7.0.
Contributing models: ACCESS-ESM1-5, AWI-CM-1-1-MR, CNRM-CM6-1, CNRM-ESM2-1, EC-Earth3, FGOALS-g3, GISS-E2-1-G, INM-CM5-0, IPSL-CM6A-LR, MPI-ESM1-2-LR, MRI-ESM2-0
Outside CMIP6 does not mean wrong — it indicates an uncommon response within the CMIP6 distribution.
Synthesis
Related diagnostics
LW CRE Change
| Variables | avg_tnswrf, avg_tnswrfcs, avg_tnlwrf, avg_tnlwrfcs |
|---|---|
| Models | ifs-fesom, ifs-nemo |
| Units | W/m2 |
| Baseline | 1990-2014 |
| Future | 2040-2049 |
| Method | ΔLW CRE = Δ(allsky LW) − Δ(clearsky LW) at TOA. |
Summary high
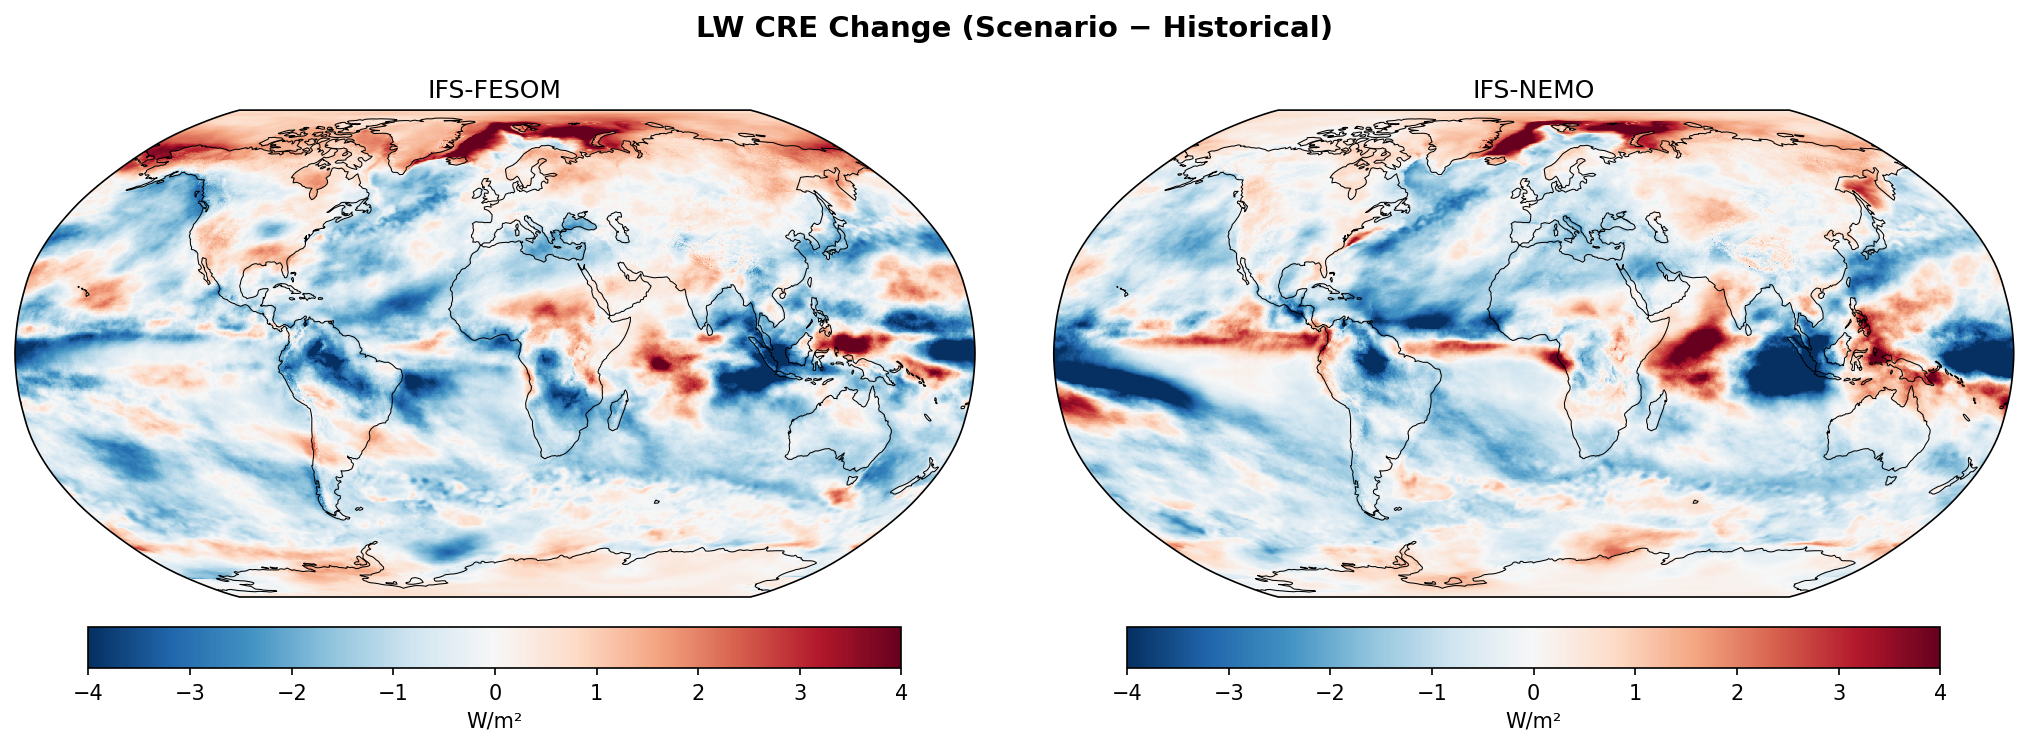
The figure compares the projected change in Longwave Cloud Radiative Effect (LW CRE) between IFS-FESOM and IFS-NEMO for the 2040–2049 period relative to 1990–2014. Both models show strong increases in LW CRE in the Arctic and complex shifts in the tropics, though regional details in the Intertropical Convergence Zone (ITCZ) differ.
Key Findings
- Widespread positive LW CRE anomalies (>3 W/m²) dominate the Arctic in both models, indicating increased cloud cover or opacity associated with polar warming.
- Strong negative anomalies are observed over the Amazon and Congo basins, suggesting a reduction in deep convective cloud cover or cloud top height (potential drying signal).
- Tropical oceans show zonal bands of alternating increases and decreases; IFS-NEMO displays a more pronounced and continuous intensification of LW CRE along the Pacific and Atlantic ITCZ compared to IFS-FESOM.
Spatial Patterns
The high latitudes (especially the Arctic Ocean) show uniform positive change (red). The tropics exhibit a 'shift' pattern: positive anomalies (red) in the central/western Indian Ocean and along the ITCZ track are flanked by negative anomalies (blue) in the subtropics and adjacent tropical bands. The Amazon region is notably distinct with a strong negative signal (deep blue).
Model Agreement
The models agree on the broad hemispheric patterns: Arctic amplification of LW warming from clouds, reduced LW CRE over major tropical rainforests, and the general location of Indian Ocean convection anomalies. Disagreement is most visible in the tropical Pacific, where IFS-NEMO shows a sharper, more continuous positive ITCZ band, while IFS-FESOM shows a more fragmented signal with larger negative areas, possibly reflecting different ENSO-like states or ocean coupling dynamics.
Physical Interpretation
Positive LW CRE change in the Arctic is physically consistent with sea-ice loss leading to increased open water, evaporation, and cloudiness which traps outgoing radiation. In the tropics, positive anomalies likely reflect rising cloud tops (thermodynamic effect) or intensified convection in warmer waters. The negative anomalies over the Amazon imply reduced deep convection and cloud cover, consistent with projected drying trends in the basin. The subtropical blue bands suggest a widening of the Hadley cell, pushing storm tracks poleward and suppressing high clouds in those regions.
Caveats
- The relatively short future period (10 years, 2040–2049) means internal variability (e.g., ENSO phases) could heavily influence the tropical patterns, particularly the differences seen in the Pacific between the two models.
- No statistical significance masking is applied, so smaller anomalies in the mid-latitudes should be interpreted with caution.
Net CRE Change
| Variables | avg_tnswrf, avg_tnswrfcs, avg_tnlwrf, avg_tnlwrfcs |
|---|---|
| Models | ifs-fesom, ifs-nemo, CMIP6-MMM |
| Units | W/m2 |
| Baseline | 1990-2014 |
| Future | 2040-2049 |
| Method | ΔNet CRE = ΔSW CRE + ΔLW CRE. |
Summary high
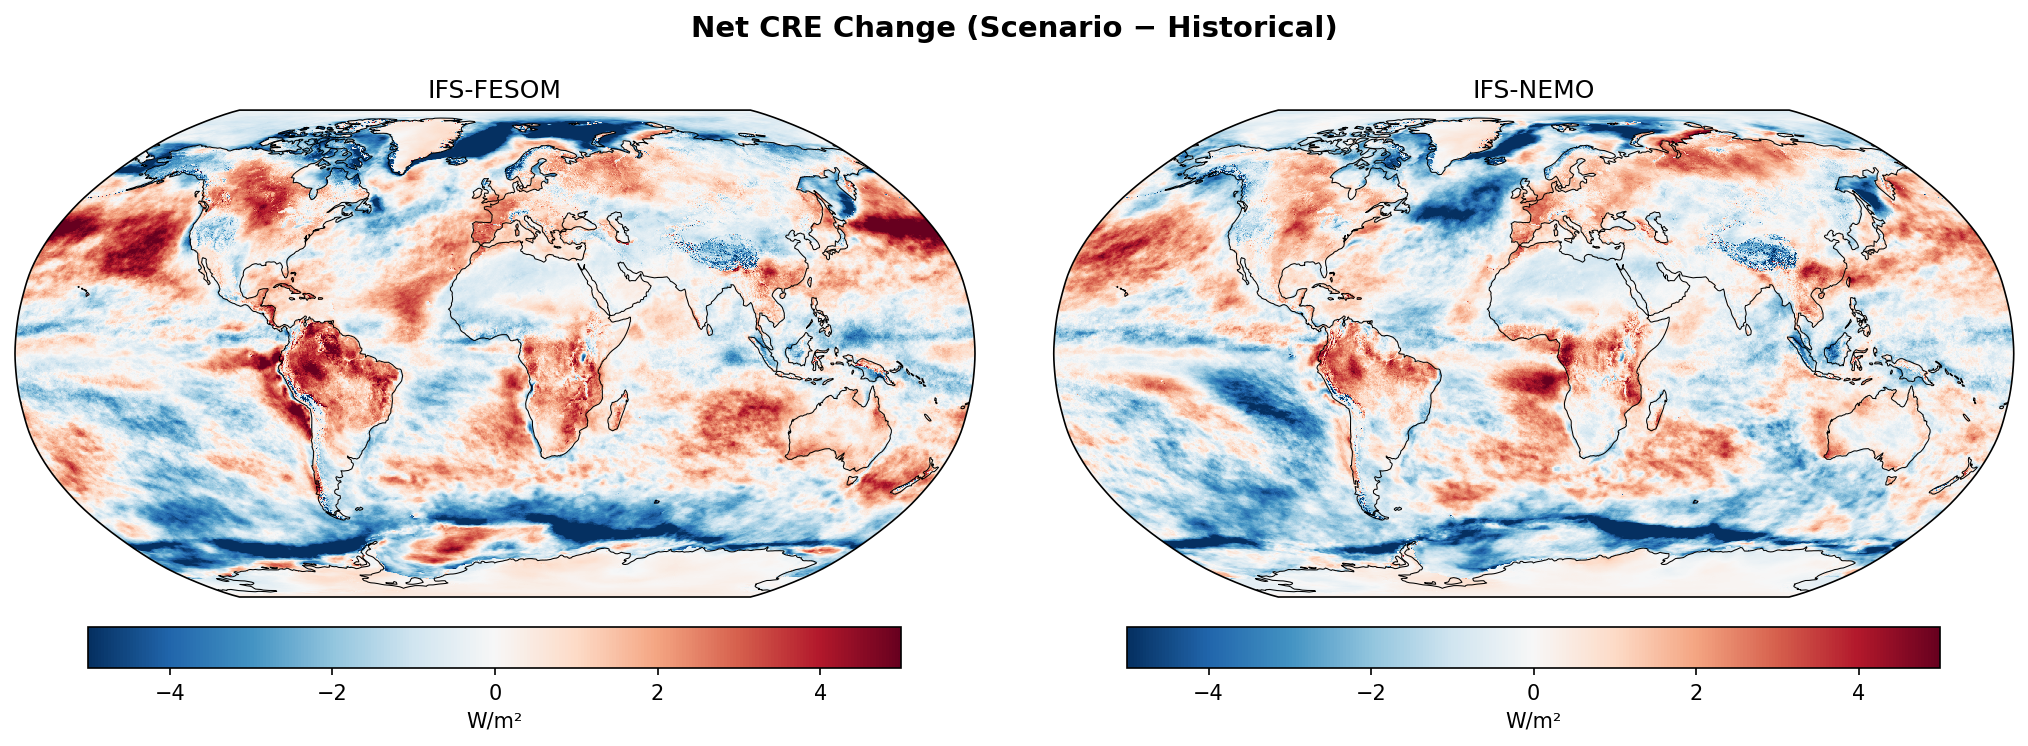
This figure compares the projected change in Net Cloud Radiative Effect (CRE) by the 2040s across two high-resolution DestinE models (IFS-FESOM, IFS-NEMO) and the CMIP6 multi-model mean. While there is broad consensus on positive feedbacks (red) in the subtropics and Northern Hemisphere mid-latitudes, the DestinE models exhibit distinct negative feedbacks (blue) in the Southern Ocean and parts of the Arctic that differ significantly from the CMIP6 mean.
Key Findings
- IFS models display a pronounced dipole in the Southern Ocean (negative change ~50–60°S, positive ~65–70°S), suggesting a strong cloud phase feedback not evident in the CMIP6 mean.
- Positive Net CRE change (warming feedback) is robust across all datasets over the Amazon and eastern subtropical ocean basins (e.g., off Peru/Chile), indicating a reduction in cloudiness.
- IFS-NEMO projects a large region of negative Net CRE change in the Eurasian sector of the Arctic, sharply contrasting with the uniform positive change (warming) seen in the CMIP6 ensemble.
Spatial Patterns
The CMIP6-MMM shows a relatively smooth global pattern dominated by positive anomalies (warming) in the Arctic, North Pacific, and North Atlantic. The IFS models resolve much sharper features, particularly in the Tropical Pacific (ITCZ/SPCZ) and Southern Ocean. A notable 'ring' of negative Net CRE change encircles Antarctica in the IFS simulations, while the CMIP6 mean shows weak or positive changes there.
Model Agreement
There is strong qualitative agreement on the 'positive feedback' signals: the reduction of cloud cooling effects in the North Atlantic and North Pacific storm tracks, and the reduction of cloud cover over the Amazon (drying signal). Disagreement is highest in the polar regions. IFS-FESOM is closer to CMIP6 in the Arctic than IFS-NEMO, but both IFS models diverge from CMIP6 in the Southern Ocean.
Physical Interpretation
Positive values in the eastern subtropical oceans imply a reduction in marine stratocumulus decks (a canonical positive climate feedback). The strong negative signal in the Southern Ocean in IFS models is likely driven by the 'optical depth feedback,' where warming causes mixed-phase clouds to convert from ice to liquid, becoming brighter and reflecting more shortwave radiation (cooling effect). The CMIP6 mean positive signal in the Arctic likely reflects sea-ice loss leading to increased heat trapping or reduced masking of cloud warming, whereas the negative signal in IFS-NEMO suggests a dominating increase in cloud reflectivity in that specific sector.
Caveats
- The analysis looks at Net CRE (SW+LW); opposing changes in Shortwave (reflection) and Longwave (trapping) components may mask underlying physical shifts.
- The single-realization nature of the IFS runs means internal variability (weather noise) is preserved, unlike in the CMIP6 Multi-Model Mean where it is averaged out, potentially exaggerating local differences.
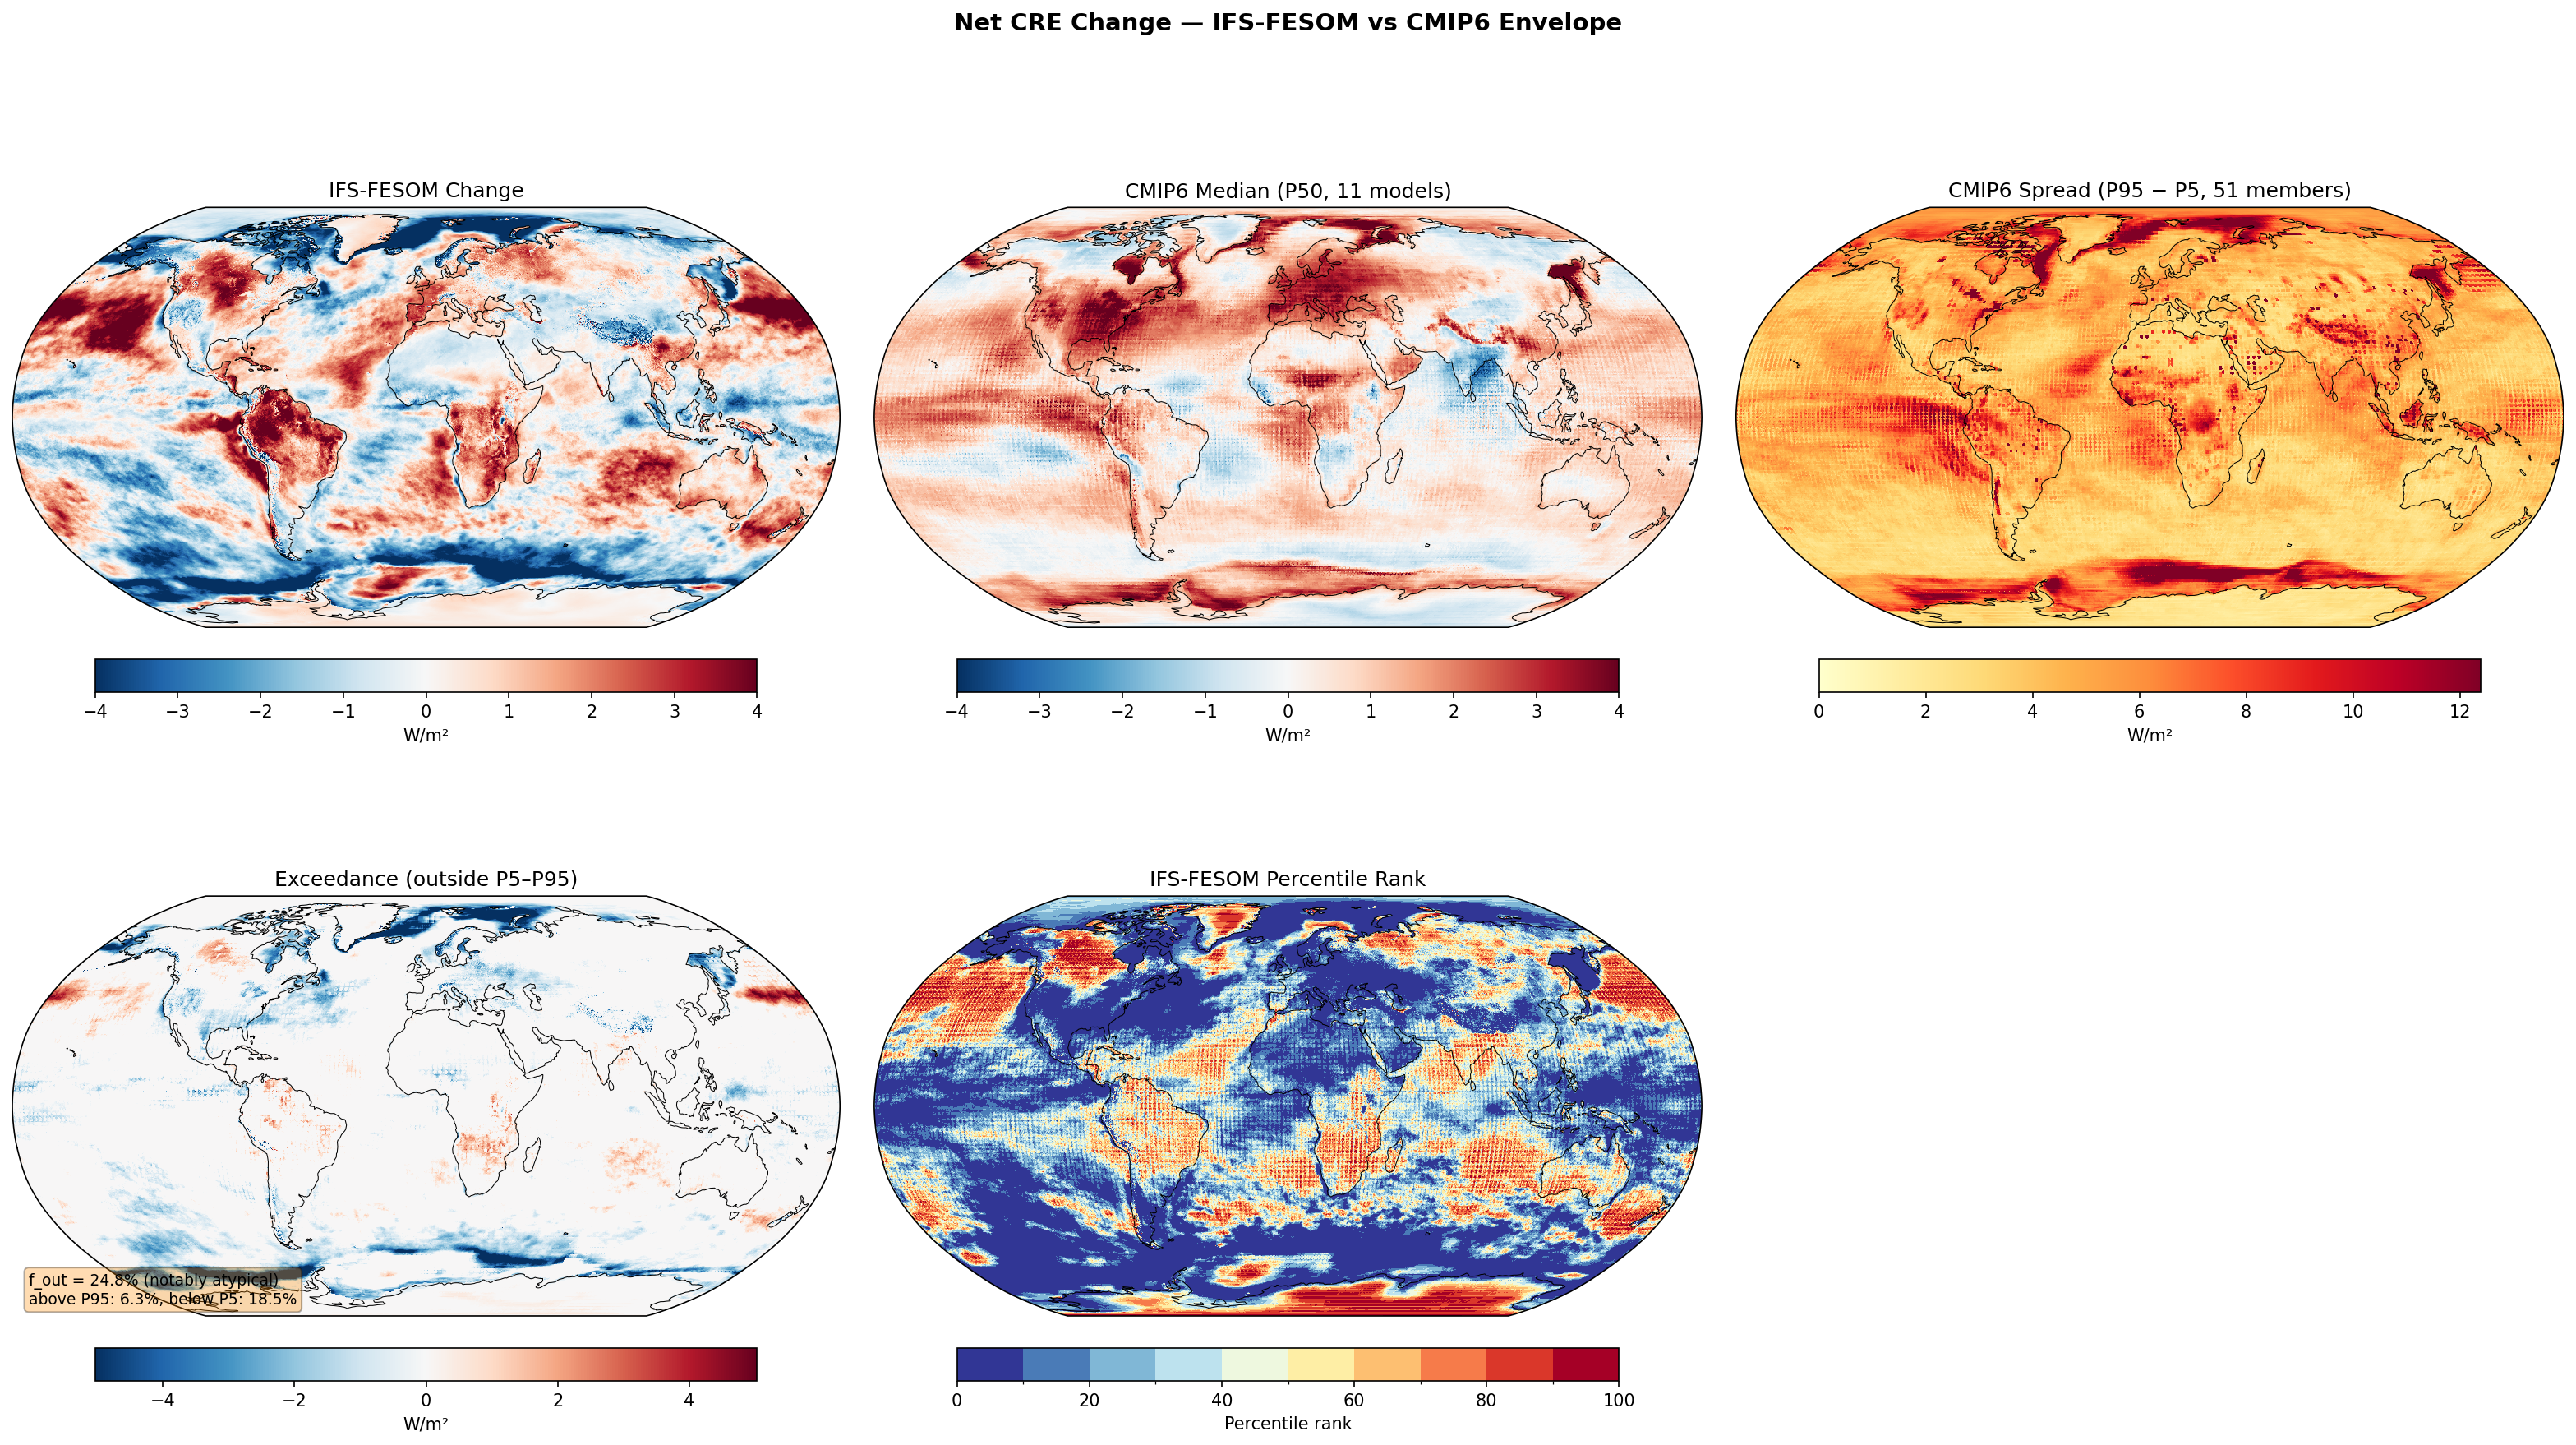
Net CRE Change — IFS-FESOM vs CMIP6 Envelope f_out 24.8%
Envelope Metrics
| f_out (outside P5–P95) | 24.8% notably atypical |
|---|---|
| Above P95 | 6.3% |
| Below P5 | 18.5% |
| CMIP6 ensemble | 11 models, 51 members |
| Variables | avg_tnswrf, avg_tnswrfcs, avg_tnlwrf, avg_tnlwrfcs |
|---|---|
| Models | ifs-fesom |
| Units | W/m2 |
| Baseline | 1990-2014 |
| Future | 2040-2049 |
| Method | All-sky net TOA change compared to CMIP6 percentile envelope (P5, P50, P95). Note: CMIP6 clearsky fluxes unavailable, so this is total net TOA, not CRE. |
Summary medium
The figure illustrates the projected change in Net Cloud Radiative Effect (CRE) for the IFS-FESOM model (2040s vs 1990s) compared to the CMIP6 SSP3-7.0 envelope. IFS-FESOM is notably atypical (f_out = 24.8%), primarily characterized by widespread negative anomalies (stronger cooling effects) in the Southern Ocean and tropics that fall below the CMIP6 5th percentile.
Key Findings
- IFS-FESOM exhibits a strong, zonally varying negative Net CRE change (-2 to -4 W/m²) in the Southern Ocean (50°S–60°S) and tropical convergence zones, indicating a potent negative cloud feedback not seen in the CMIP6 median.
- The model shows a distinct positive Net CRE change (warming) in the North Pacific and North Atlantic mid-latitudes, exceeding the CMIP6 P95 envelope, suggesting a reduction in low-cloud cover (positive feedback) in these regions.
- A substantial 18.5% of the global area in IFS-FESOM lies below the CMIP6 P5 threshold, dominated by oceanic regions, while only 6.3% lies above P95.
- The CMIP6 median shows much weaker, smoother spatial gradients, with spread maximized in the ENSO region and Southern Ocean.
Spatial Patterns
IFS-FESOM displays sharp, resolved features including a strong negative band in the Southern Ocean, negative anomalies along the ITCZ/SPCZ, and positive anomalies in the Northern Hemisphere storm tracks. The 'Exceedance' map is dominated by blue regions (below P5) over the global oceans.
Model Agreement
The model strongly disagrees with the CMIP6 ensemble in the Southern Ocean and tropical oceans, where IFS-FESOM predicts a much stronger cooling contribution from clouds. Agreement is better over land and in the Arctic, where both show positive tendencies (likely linked to sea-ice loss masking).
Physical Interpretation
The negative signal in the Southern Ocean implies IFS-FESOM maintains or increases cloud albedo (likely low-phase clouds) under warming, acting as a thermostat, whereas many CMIP6 models show reduced cover or optical depth. The 'Below P5' dominance is likely exacerbated by a potential variable mismatch (see caveats), where IFS CRE (excluding GHG forcing) is compared against CMIP6 Total Flux (including GHG forcing).
Caveats
- CRITICAL: Metadata states 'CMIP6 clearsky fluxes unavailable, so this is total net TOA'. If IFS-FESOM (CRE) is compared to CMIP6 (Total Flux), the comparison is invalid. Total Flux includes positive GHG forcing, naturally making the CRE-only IFS field appear systematically lower (explaining the 18.5% 'below P5').
- Decadal variability (10-year window) may influence regional patterns, particularly in the North Pacific (PDO-like structures).
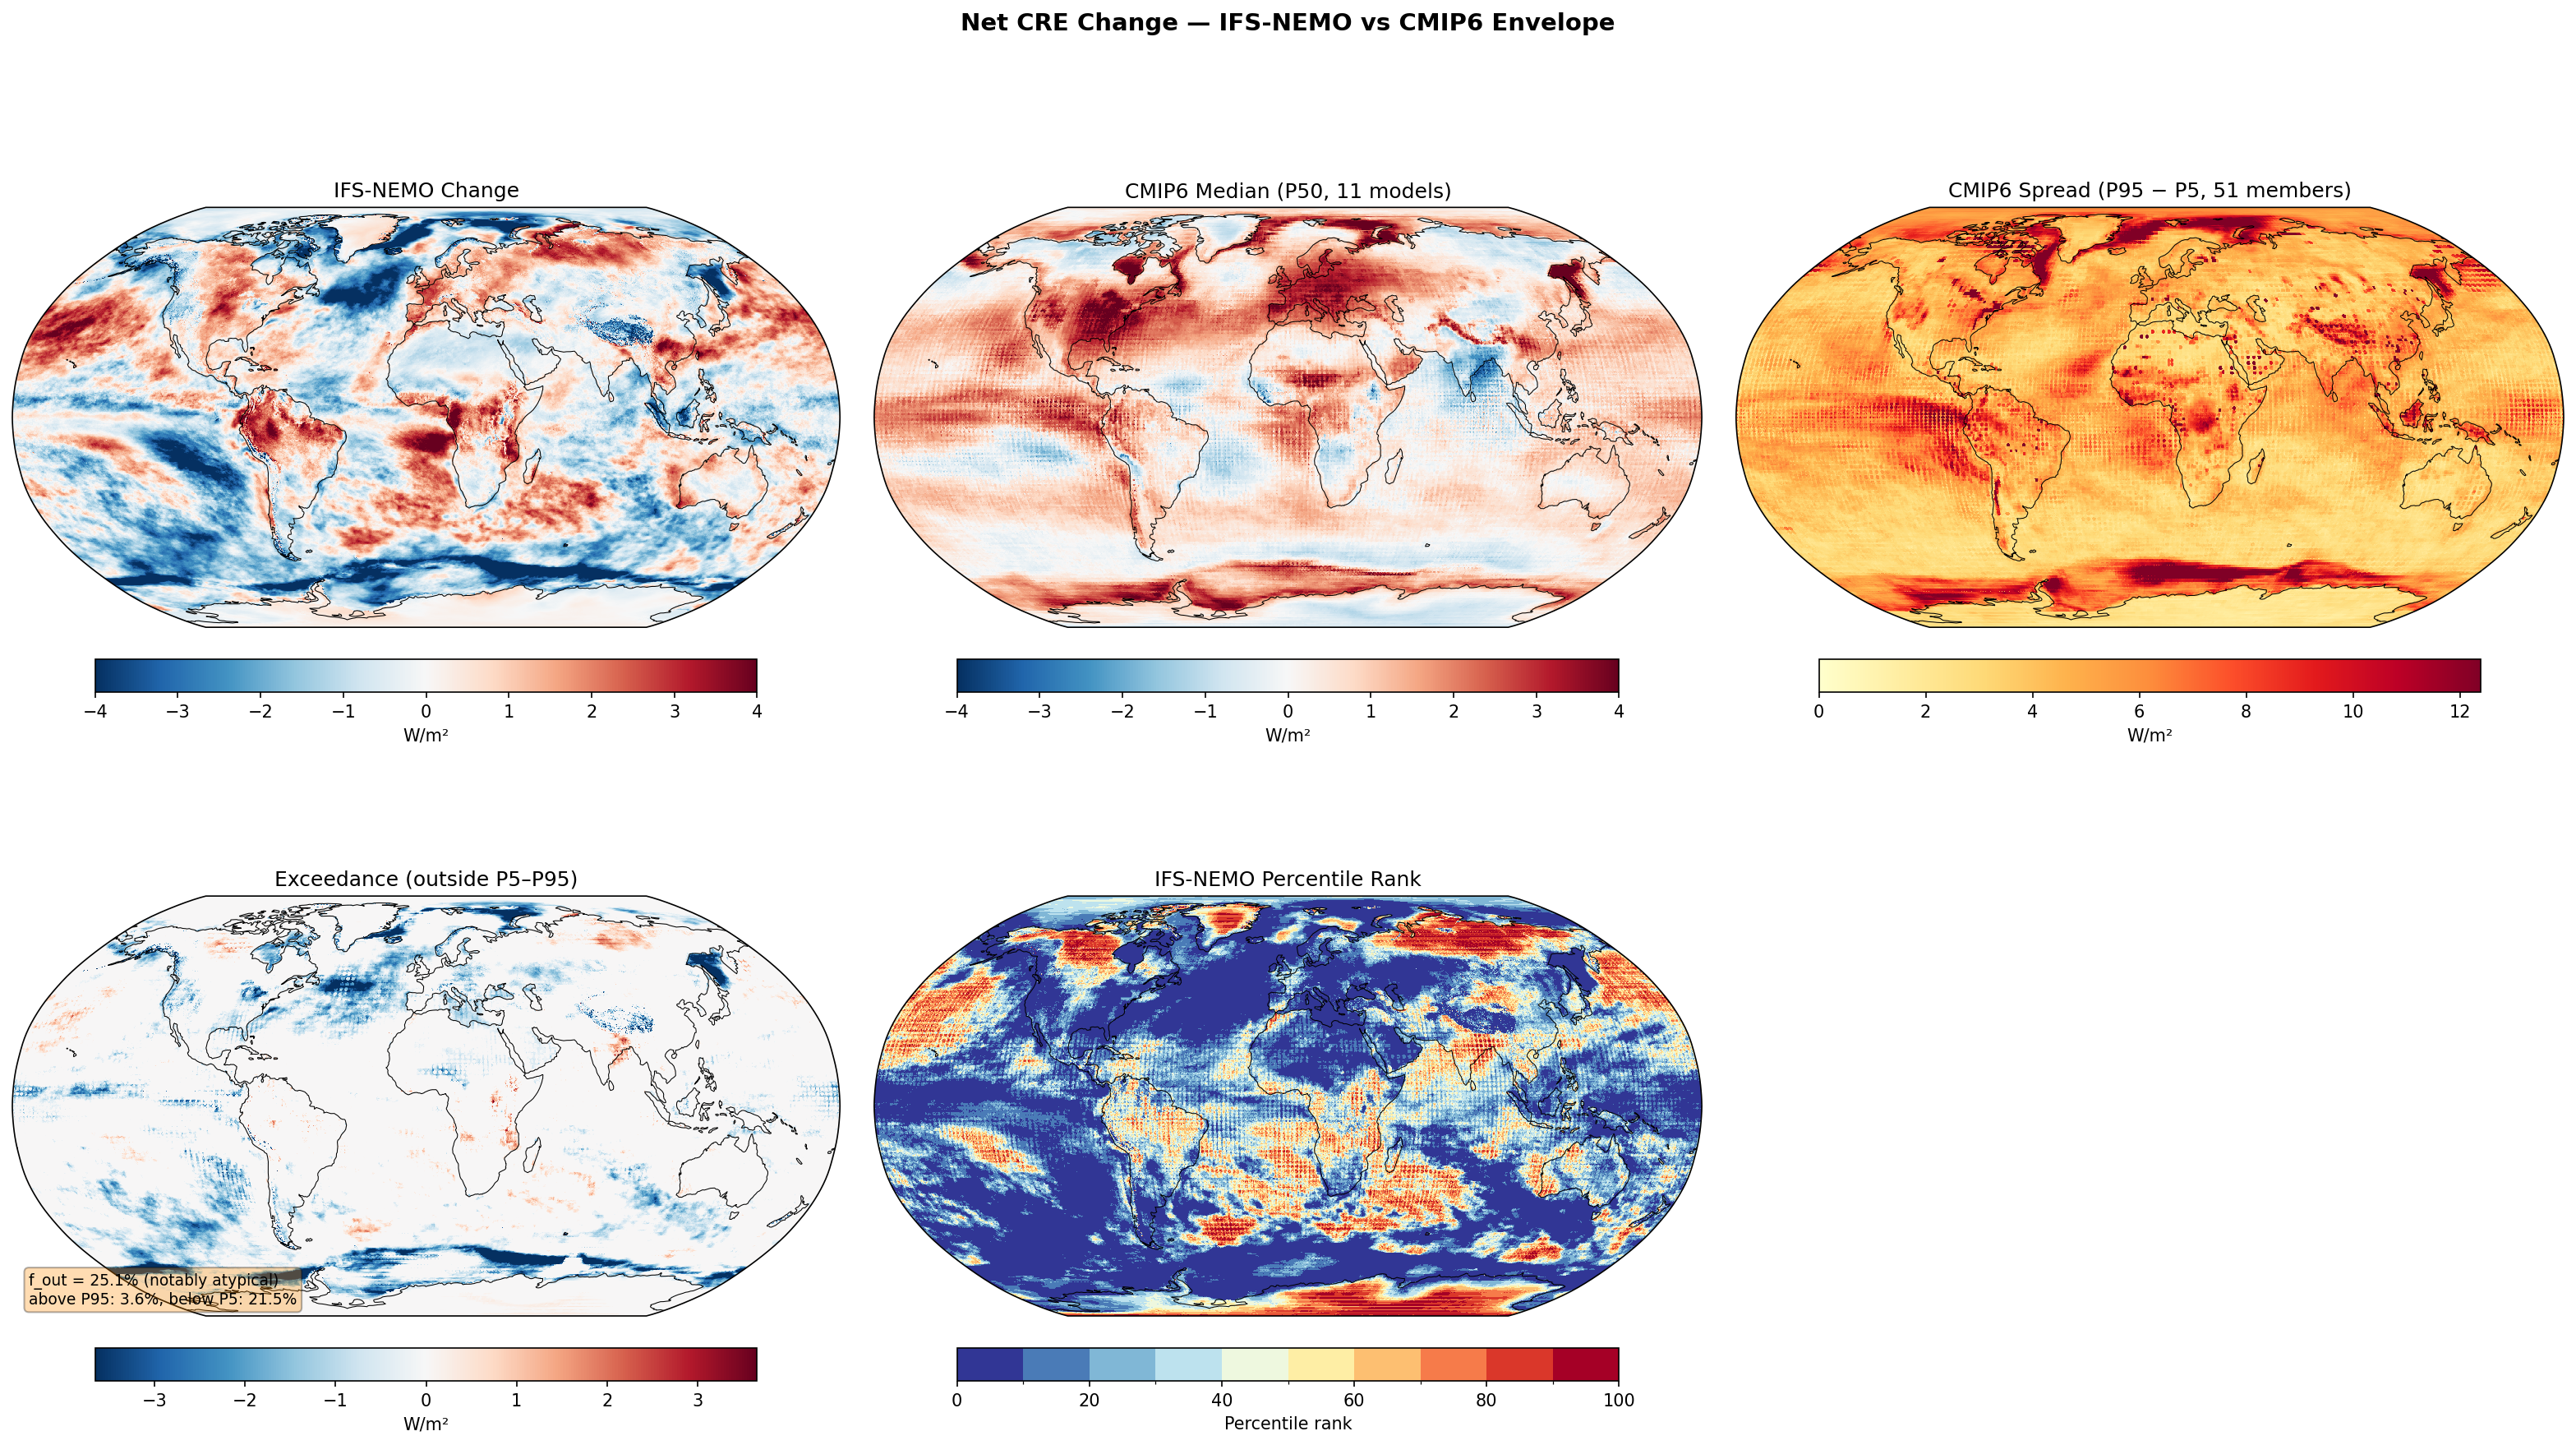
Net CRE Change — IFS-NEMO vs CMIP6 Envelope f_out 25.1%
Envelope Metrics
| f_out (outside P5–P95) | 25.1% notably atypical |
|---|---|
| Above P95 | 3.6% |
| Below P5 | 21.5% |
| CMIP6 ensemble | 11 models, 51 members |
| Variables | avg_tnswrf, avg_tnswrfcs, avg_tnlwrf, avg_tnlwrfcs |
|---|---|
| Models | ifs-nemo |
| Units | W/m2 |
| Baseline | 1990-2014 |
| Future | 2040-2049 |
| Method | All-sky net TOA change compared to CMIP6 percentile envelope (P5, P50, P95). Note: CMIP6 clearsky fluxes unavailable, so this is total net TOA, not CRE. |
Summary high
This figure displays the projected change in Net TOA Radiative Flux (labeled Net CRE but computed as Total Net TOA due to data limitations) for the IFS-NEMO model (2040–2049) compared to the CMIP6 SSP3-7.0 ensemble. IFS-NEMO exhibits a 'notably atypical' response (f_out = 25.1%), characterized by widespread negative radiative anomalies over the global oceans that fall below the CMIP6 5th percentile, indicating a distinct radiative cooling tendency (likely cloud-driven) relative to the standard model ensemble.
Key Findings
- IFS-NEMO falls below the CMIP6 5th percentile (P5) over 21.5% of the global area, primarily throughout the North Atlantic, Southern Ocean, and parts of the Pacific.
- The North Atlantic exhibits a strong negative anomaly (blue) in IFS-NEMO, significantly exceeding the magnitude of the cooling/radiative dip seen in the CMIP6 median, suggesting a stronger 'warming hole' dynamic or associated cloud response.
- Arctic regions show strong positive anomalies (>4 W/m²) in both IFS-NEMO and CMIP6, confirming robust agreement on sea-ice albedo feedbacks, although IFS-NEMO shows localized exceedance (both positive and negative) in marginal ice zones.
Spatial Patterns
The map is dominated by a land-sea contrast in exceedance. While land areas largely remain within the CMIP6 envelope (white/grey), ocean basins are marked by extensive regions of 'below P5' exceedance (blue). The Arctic stands out with intense positive changes (red) due to sea-ice loss. A notable dipole structure exists in the North Atlantic, with a deep negative anomaly south of Greenland contrasting with warming elsewhere.
Model Agreement
Agreement is highest over continental landmasses and the central Arctic (in terms of sign), where IFS-NEMO generally tracks the CMIP6 median. Disagreement is concentrated over the oceans, where IFS-NEMO is systematically 'dimmer' (more negative Net TOA change) than the CMIP6 ensemble. The low percentile rank (<5) across the Southern Ocean and North Atlantic indicates IFS-NEMO occupies the extreme lower tail of the distribution for radiative changes in these regions.
Physical Interpretation
The strong positive anomalies in the Arctic are driven by the surface albedo feedback (sea-ice loss increasing absorbed solar radiation). The widespread negative anomalies over the oceans in IFS-NEMO (relative to CMIP6) likely stem from differences in cloud physics; specifically, IFS-NEMO may be simulating a weaker positive (or stronger negative) low-cloud feedback, maintaining higher albedo than the CMIP6 median. The intense negative signal in the North Atlantic is consistent with a strong SST cooling ('warming hole') response, which locally reduces outgoing energy or enhances low-cloud formation, reducing net energy input.
Caveats
- Variable Mismatch: The title specifies 'Net CRE', but metadata confirms the diagnostic is 'All-sky net TOA change' because CMIP6 clear-sky fluxes were unavailable. Thus, patterns reflect total radiative changes (including surface albedo), not just cloud effects.
- Short Analysis Period: The future period (2040–2049) is only 10 years, meaning internal variability (e.g., phases of the PDO or AMO) could strongly influence the exceedance patterns compared to the longer-term climate signal.
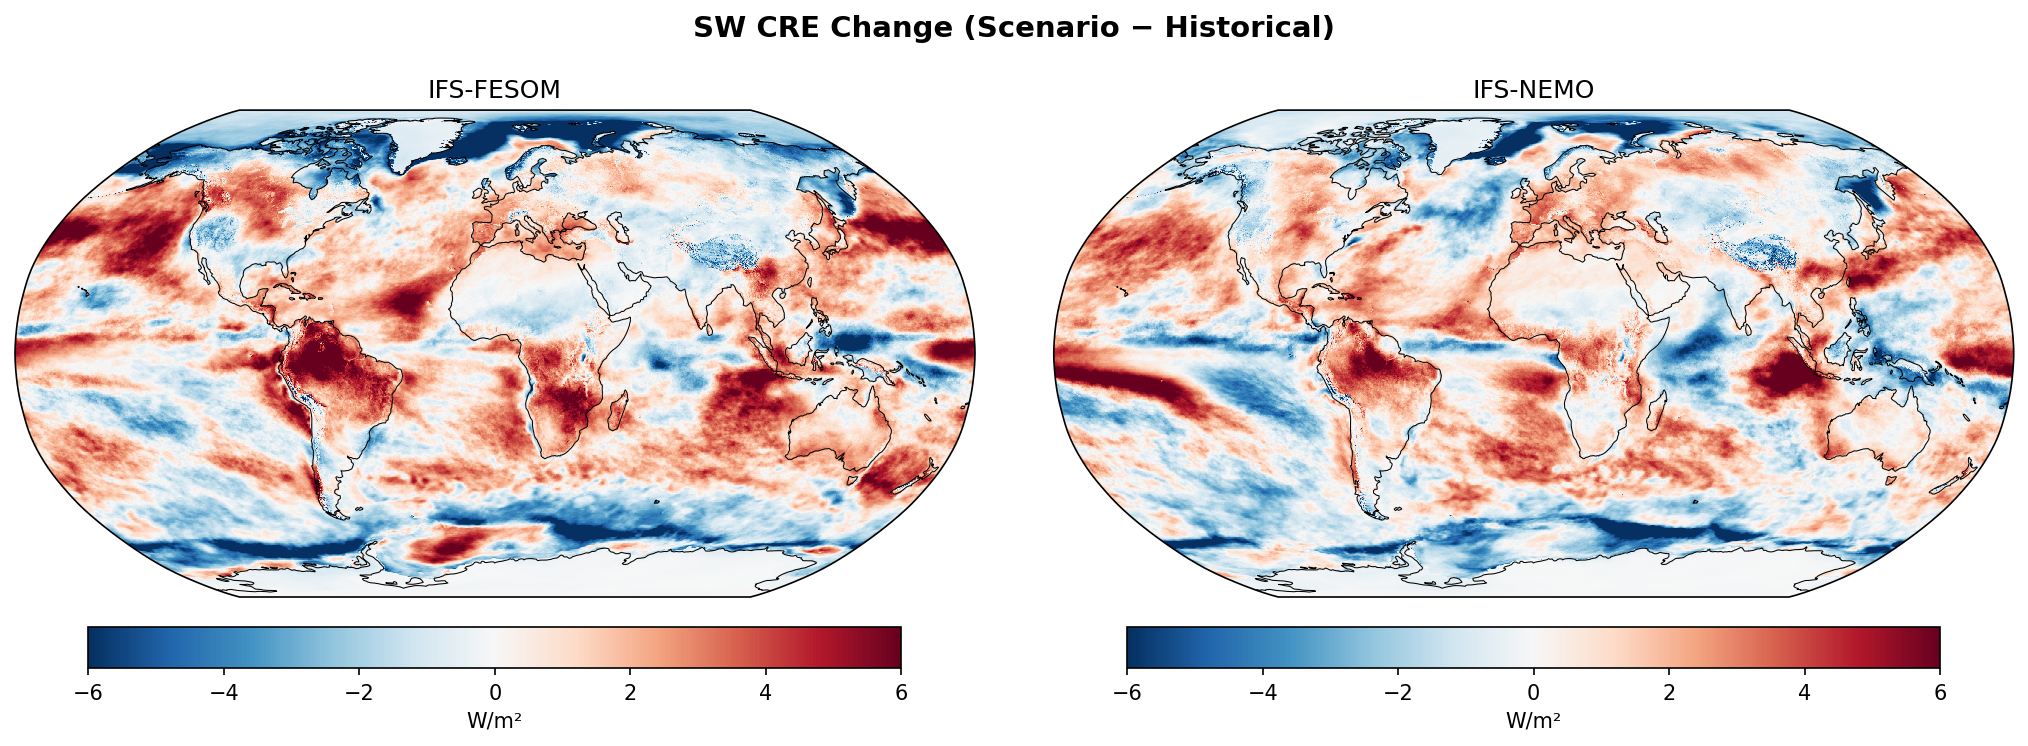
SW CRE Change
| Variables | avg_tnswrf, avg_tnswrfcs, avg_tnlwrf, avg_tnlwrfcs |
|---|---|
| Models | ifs-fesom, ifs-nemo |
| Units | W/m2 |
| Baseline | 1990-2014 |
| Future | 2040-2049 |
| Method | ΔSWE CRE = Δ(allsky SW) − Δ(clearsky SW) at TOA. |
Summary high
The figure illustrates the change in Shortwave Cloud Radiative Effect (SW CRE) for the period 2040–2049 relative to 1990–2014 for two high-resolution coupled models, IFS-FESOM and IFS-NEMO. Both models exhibit highly congruent patterns characterized by widespread positive anomalies (reduced cloud cooling) in the mid-latitudes and major land basins, contrasting with negative anomalies (increased cloud cooling) in the Arctic.
Key Findings
- Widespread positive SW CRE changes (red, +2 to +6 W/m²) dominate the mid-latitudes (North Atlantic, North Pacific) and subtropical oceans, indicating a reduction in cloud reflection likely due to storm-track shifts.
- Prominent positive anomalies are observed over key land regions, specifically the Amazon Basin, Southern Europe, and parts of Southeast Asia, suggesting reduced cloud cover consistent with regional drying trends.
- The Arctic Ocean exhibits a strong negative SW CRE change (blue), implying an increase in cloudiness or cloud optical depth, which acts as a negative feedback in the shortwave spectrum (though often outweighed by longwave trapping).
- A distinct dipole pattern is visible in the tropical Pacific, with a narrow band of negative change along the ITCZ flanked by broader positive anomalies, suggesting a narrowing or intensification of the convergence zone.
Spatial Patterns
The maps show a clear zonal structure: negative changes in the high Arctic, broad bands of positive changes in the mid-latitudes (30°–60° N/S), and complex patterns in the tropics. Notably, the 'warming hole' region in the North Atlantic is covered by positive anomalies (less cloud shielding). Strong terrestrial positive signals coincide with known drying hotspots like the Mediterranean and Amazon.
Model Agreement
There is exceptionally high agreement between IFS-FESOM and IFS-NEMO regarding both the spatial distribution and magnitude of the anomalies. This indicates that the atmospheric response (driven by the shared IFS physics) dominates the SW CRE signal, with the different ocean components (FESOM vs. NEMO) producing only minor local variations, primarily in the Southern Ocean and fine-scale features of the Indian Ocean.
Physical Interpretation
The positive anomalies in mid-latitudes likely result from the poleward expansion of the Hadley cells and the associated shift of storm tracks, leading to reduced cloud cover in the regions left behind. The strong positive signal over the Amazon and Europe reflects land-atmosphere coupling where surface drying suppresses convective cloud formation. In the Arctic, sea-ice loss exposes open water, enhancing evaporation and low-level cloud formation (stratus/stratocumulus) during the sunlit season.
Caveats
- In the Arctic, SW CRE changes are mathematically convolved with surface albedo changes (sea-ice retreat); the increased 'cloud cooling' relative to clear sky is partly a function of the darker surface reference.
- The analysis period (2040s vs 1990s) represents a mid-century snapshot; magnitudes would likely increase towards the end of the century.