Tier 2 Snowfall Fraction Change CMIP6 f_out 17.5%
CMIP6 Envelope Comparison
DestinE anomalies compared to the CMIP6 P5–P95 percentile envelope derived from 48 ensemble members across 11 models under SSP3-7.0.
Contributing models: AWI-CM-1-1-MR, CNRM-CM6-1, MIROC6, MPI-ESM1-2-LR, UKESM1-0-LL
Outside CMIP6 does not mean wrong — it indicates an uncommon response within the CMIP6 distribution.
Synthesis
Related diagnostics
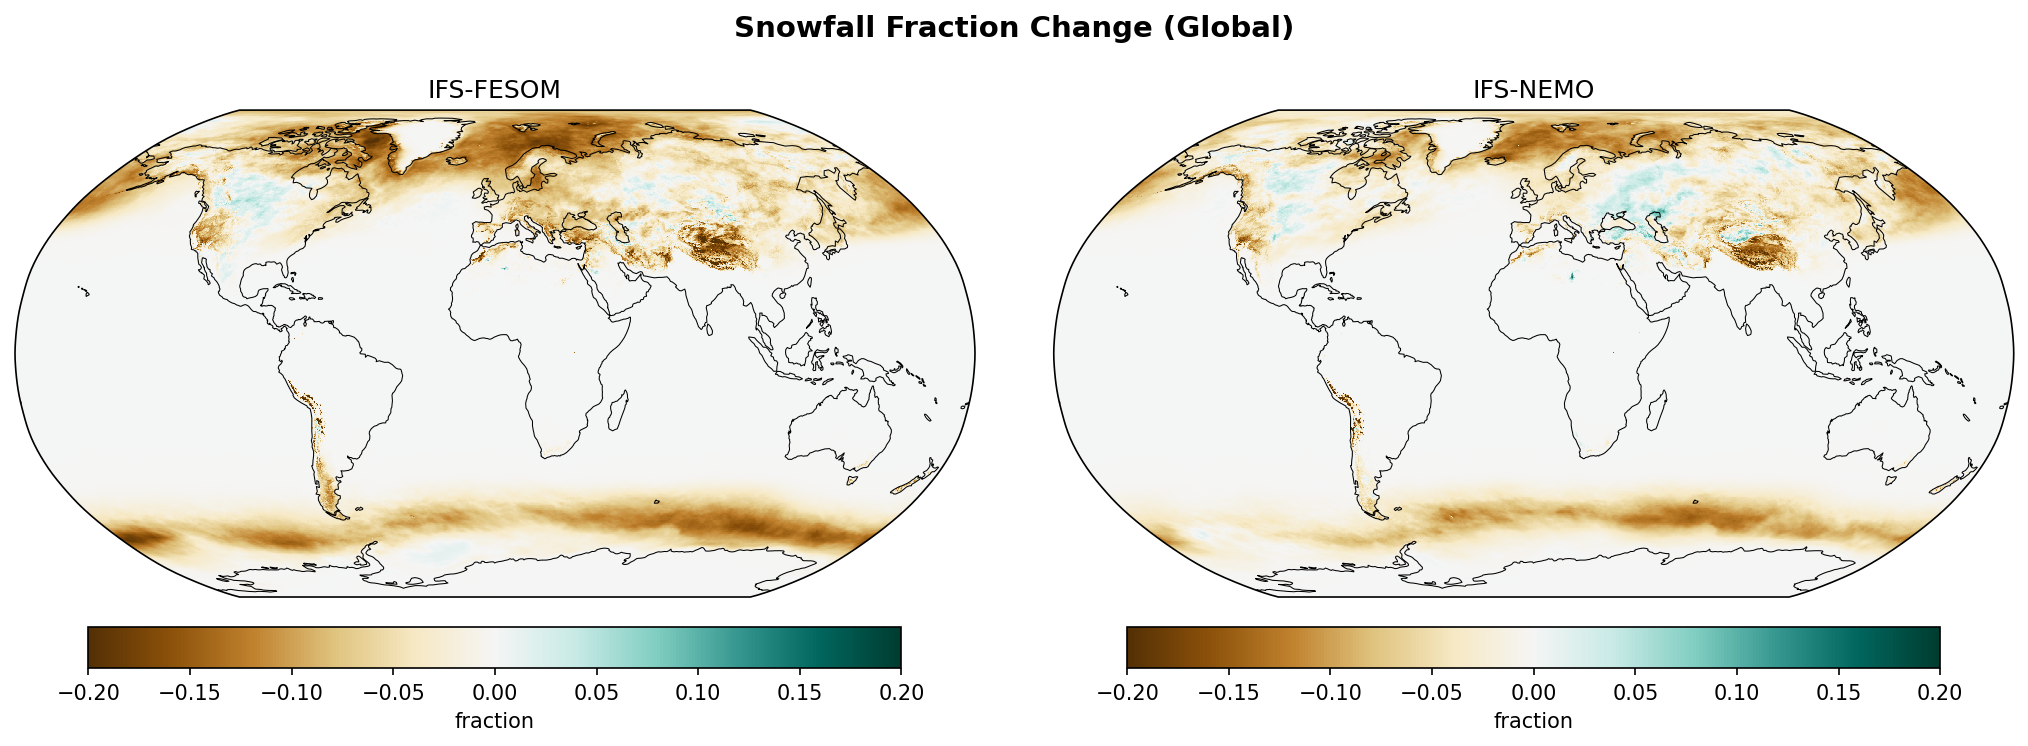
Snowfall Fraction Change (Global)
| Variables | avg_tsrwe, avg_tprate |
|---|---|
| Models | ifs-fesom, ifs-nemo, CMIP6-MMM |
| Units | kg/m2/s |
| Baseline | 1990-2014 |
| Future | 2040-2049 |
| Method | SF = avg_tsrwe / avg_tprate; ΔSF = SF_future − SF_hist. |
Summary high
The figure illustrates a widespread global reduction in snowfall fraction (the ratio of snow to total precipitation) for the 2040–2049 period relative to 1990–2014. The high-resolution IFS models (FESOM and NEMO) show broad agreement with the CMIP6 multi-model mean regarding the sign of change but provide significantly greater spatial detail over mountain ranges and high-latitude oceans.
Key Findings
- Global decline in snowfall fraction: All models show a dominant signal of reduced snowfall fraction (brown colors), particularly over the Northern Hemisphere high latitudes and the Southern Ocean, consistent with thermodynamic warming.
- Orographic amplification in DestinE: IFS-FESOM and IFS-NEMO resolve sharp reductions in snowfall fraction along narrow mountain ranges (Andes, Rockies, Alps, Himalayas) which appear as diffuse, smeared features in the coarser CMIP6-MMM.
- Southern Ocean intensity: The IFS models depict a more intense and spatially coherent reduction in snowfall fraction over the Southern Ocean compared to the CMIP6 mean, likely linked to differences in sea-ice coupling or cloud-phase physics at high resolution.
- Influence of internal variability: The single-realization IFS models exhibit 'patchy' signals with localized areas of increase (blue) in North America and Eurasia, likely reflecting decadal internal variability (weather noise) rather than a robust forced climate signal, as these are absent in the smoothed CMIP6 ensemble mean.
Spatial Patterns
The dominant pattern is a poleward-intensified reduction in snow fraction. The strongest decreases (down to -0.20) are seen over the Southern Ocean, the North Atlantic/Arctic sector, and major mountain belts. The IFS models reveal fine-scale linear features corresponding to topography (e.g., the Andes and the Tibetan Plateau margins) that are unresolved in CMIP6. The IFS models also show more granular variability over continental interiors compared to the smooth fields of the CMIP6-MMM.
Model Agreement
DestinE models and CMIP6-MMM agree on the large-scale sign of change (negative trends in snow fraction). However, the DestinE models diverge in spatial texture, showing higher variability and sharper gradients. The CMIP6-MMM is notably smoother, filtering out the decadal noise visible in the 10-year DestinE slices. The specific magnitude of decrease in the Southern Ocean is stronger in the DestinE simulations.
Physical Interpretation
The reduction in snowfall fraction is a direct thermodynamic consequence of global warming: as near-surface temperatures rise, the freezing level height increases, causing a phase shift where precipitation that previously fell as snow now falls as rain. The enhanced detail in IFS models demonstrates how this phase shift interacts with complex topography, where warming creates sharp elevational gradients in snow loss.
Caveats
- Short analysis period: The future period covers only 10 years (2040–2049). Localized areas of positive change (blue) in the IFS models are likely artifacts of internal decadal variability rather than long-term climatological shifts.
- Single realization: The IFS panels represent single ensemble members, making them noisier than the CMIP6 Multi-Model Mean.
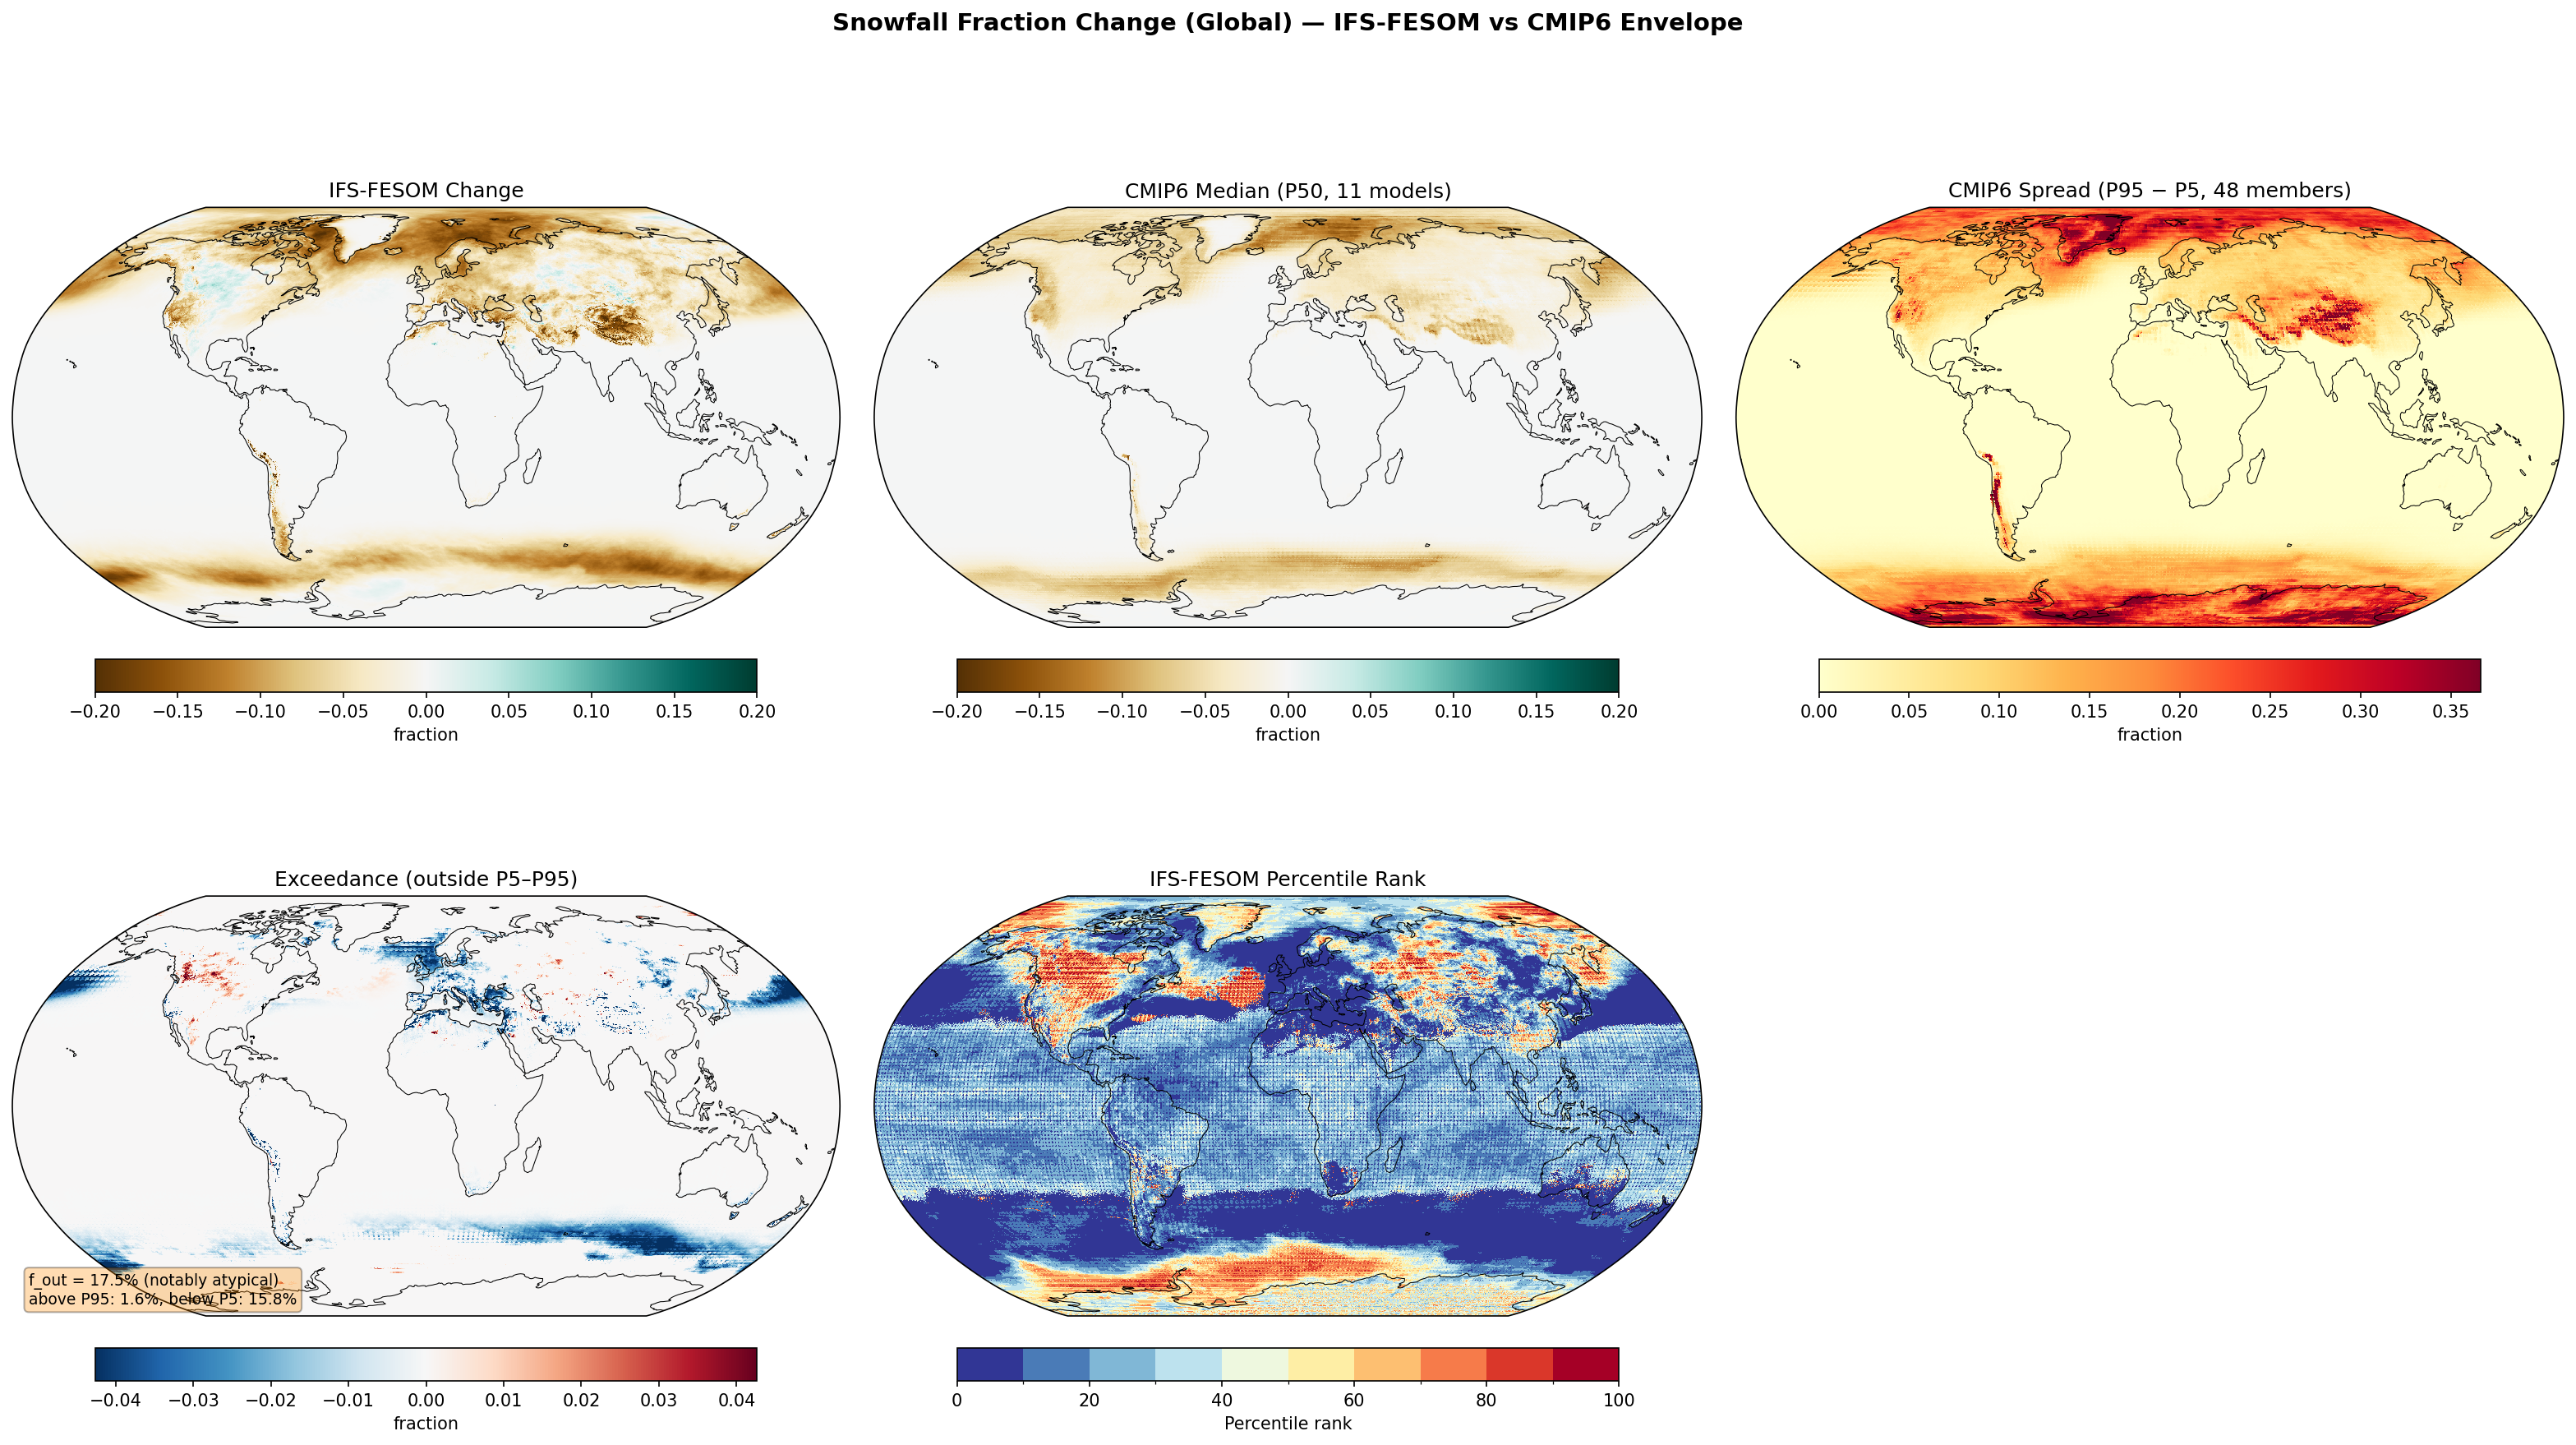
Snowfall Fraction Change (Global) — IFS-FESOM vs CMIP6 Envelope f_out 17.5%
Envelope Metrics
| f_out (outside P5–P95) | 17.5% notably atypical |
|---|---|
| Above P95 | 1.6% |
| Below P5 | 15.8% |
| CMIP6 ensemble | 11 models, 48 members |
| Variables | avg_tsrwe, avg_tprate |
|---|---|
| Models | ifs-fesom |
| Units | kg/m2/s |
| Baseline | 1990-2014 |
| Future | 2040-2049 |
| Method | SF = prsn / pr; ΔSF = SF_future − SF_hist. Compared to CMIP6 percentile envelope (P5, P50, P95). |
Summary high
IFS-FESOM projects a widespread reduction in snowfall fraction by 2040-2049, exhibiting a notably atypical response (f_out = 17.5%) where the loss of snow fraction is significantly more aggressive than the CMIP6 ensemble in maritime transition zones.
Key Findings
- The model is notably atypical with 15.8% of the global area falling below the CMIP6 5th percentile, indicating a much stronger reduction in snowfall fraction than the model consensus.
- The strongest deviations occur over the North Atlantic, Western Europe, and the Southern Ocean, where IFS-FESOM lies at the extreme lower tail (percentile rank ~0) of the CMIP6 distribution.
- While CMIP6 models show high uncertainty (spread) over topography and sea-ice edges, IFS-FESOM systematically projects faster snow-to-rain transition in these bands.
Spatial Patterns
The IFS-FESOM change field is dominated by negative values (brown). The Exceedance panel highlights a coherent 'blue' signal (below P5) stretching from the North Atlantic across Scandinavia/Northern Europe and ringing the Southern Ocean. Conversely, small pockets in the Canadian Archipelago show 'red' exceedance (change > P95), indicating a weaker reduction than CMIP6 in those specific high-latitude land areas.
Model Agreement
There is broad qualitative agreement on the sign of change (negative), but significant quantitative disagreement in magnitude. IFS-FESOM consistently predicts a sharper decline in snowfall fraction than the CMIP6 median, particularly in regions influenced by maritime air masses.
Physical Interpretation
The rapid loss of snowfall fraction likely reflects strong surface warming in the IFS-FESOM simulation, pushing winter temperatures above the freezing threshold more frequently than in the CMIP6 ensemble. Alternatively, differences in cloud microphysics parameterisations (specifically the temperature thresholds for rain/snow partitioning) or stronger zonal advection of warm maritime air by the high-resolution atmospheric flow could drive this faster phase transition.
Caveats
- Snowfall fraction is a derived diagnostic; variations in how different models diagnose solid vs. liquid precipitation could influence the comparison.
- The intense reduction in snow fraction implies potential deviations in surface albedo feedback and hydrological runoff timing compared to standard CMIP6 projections.
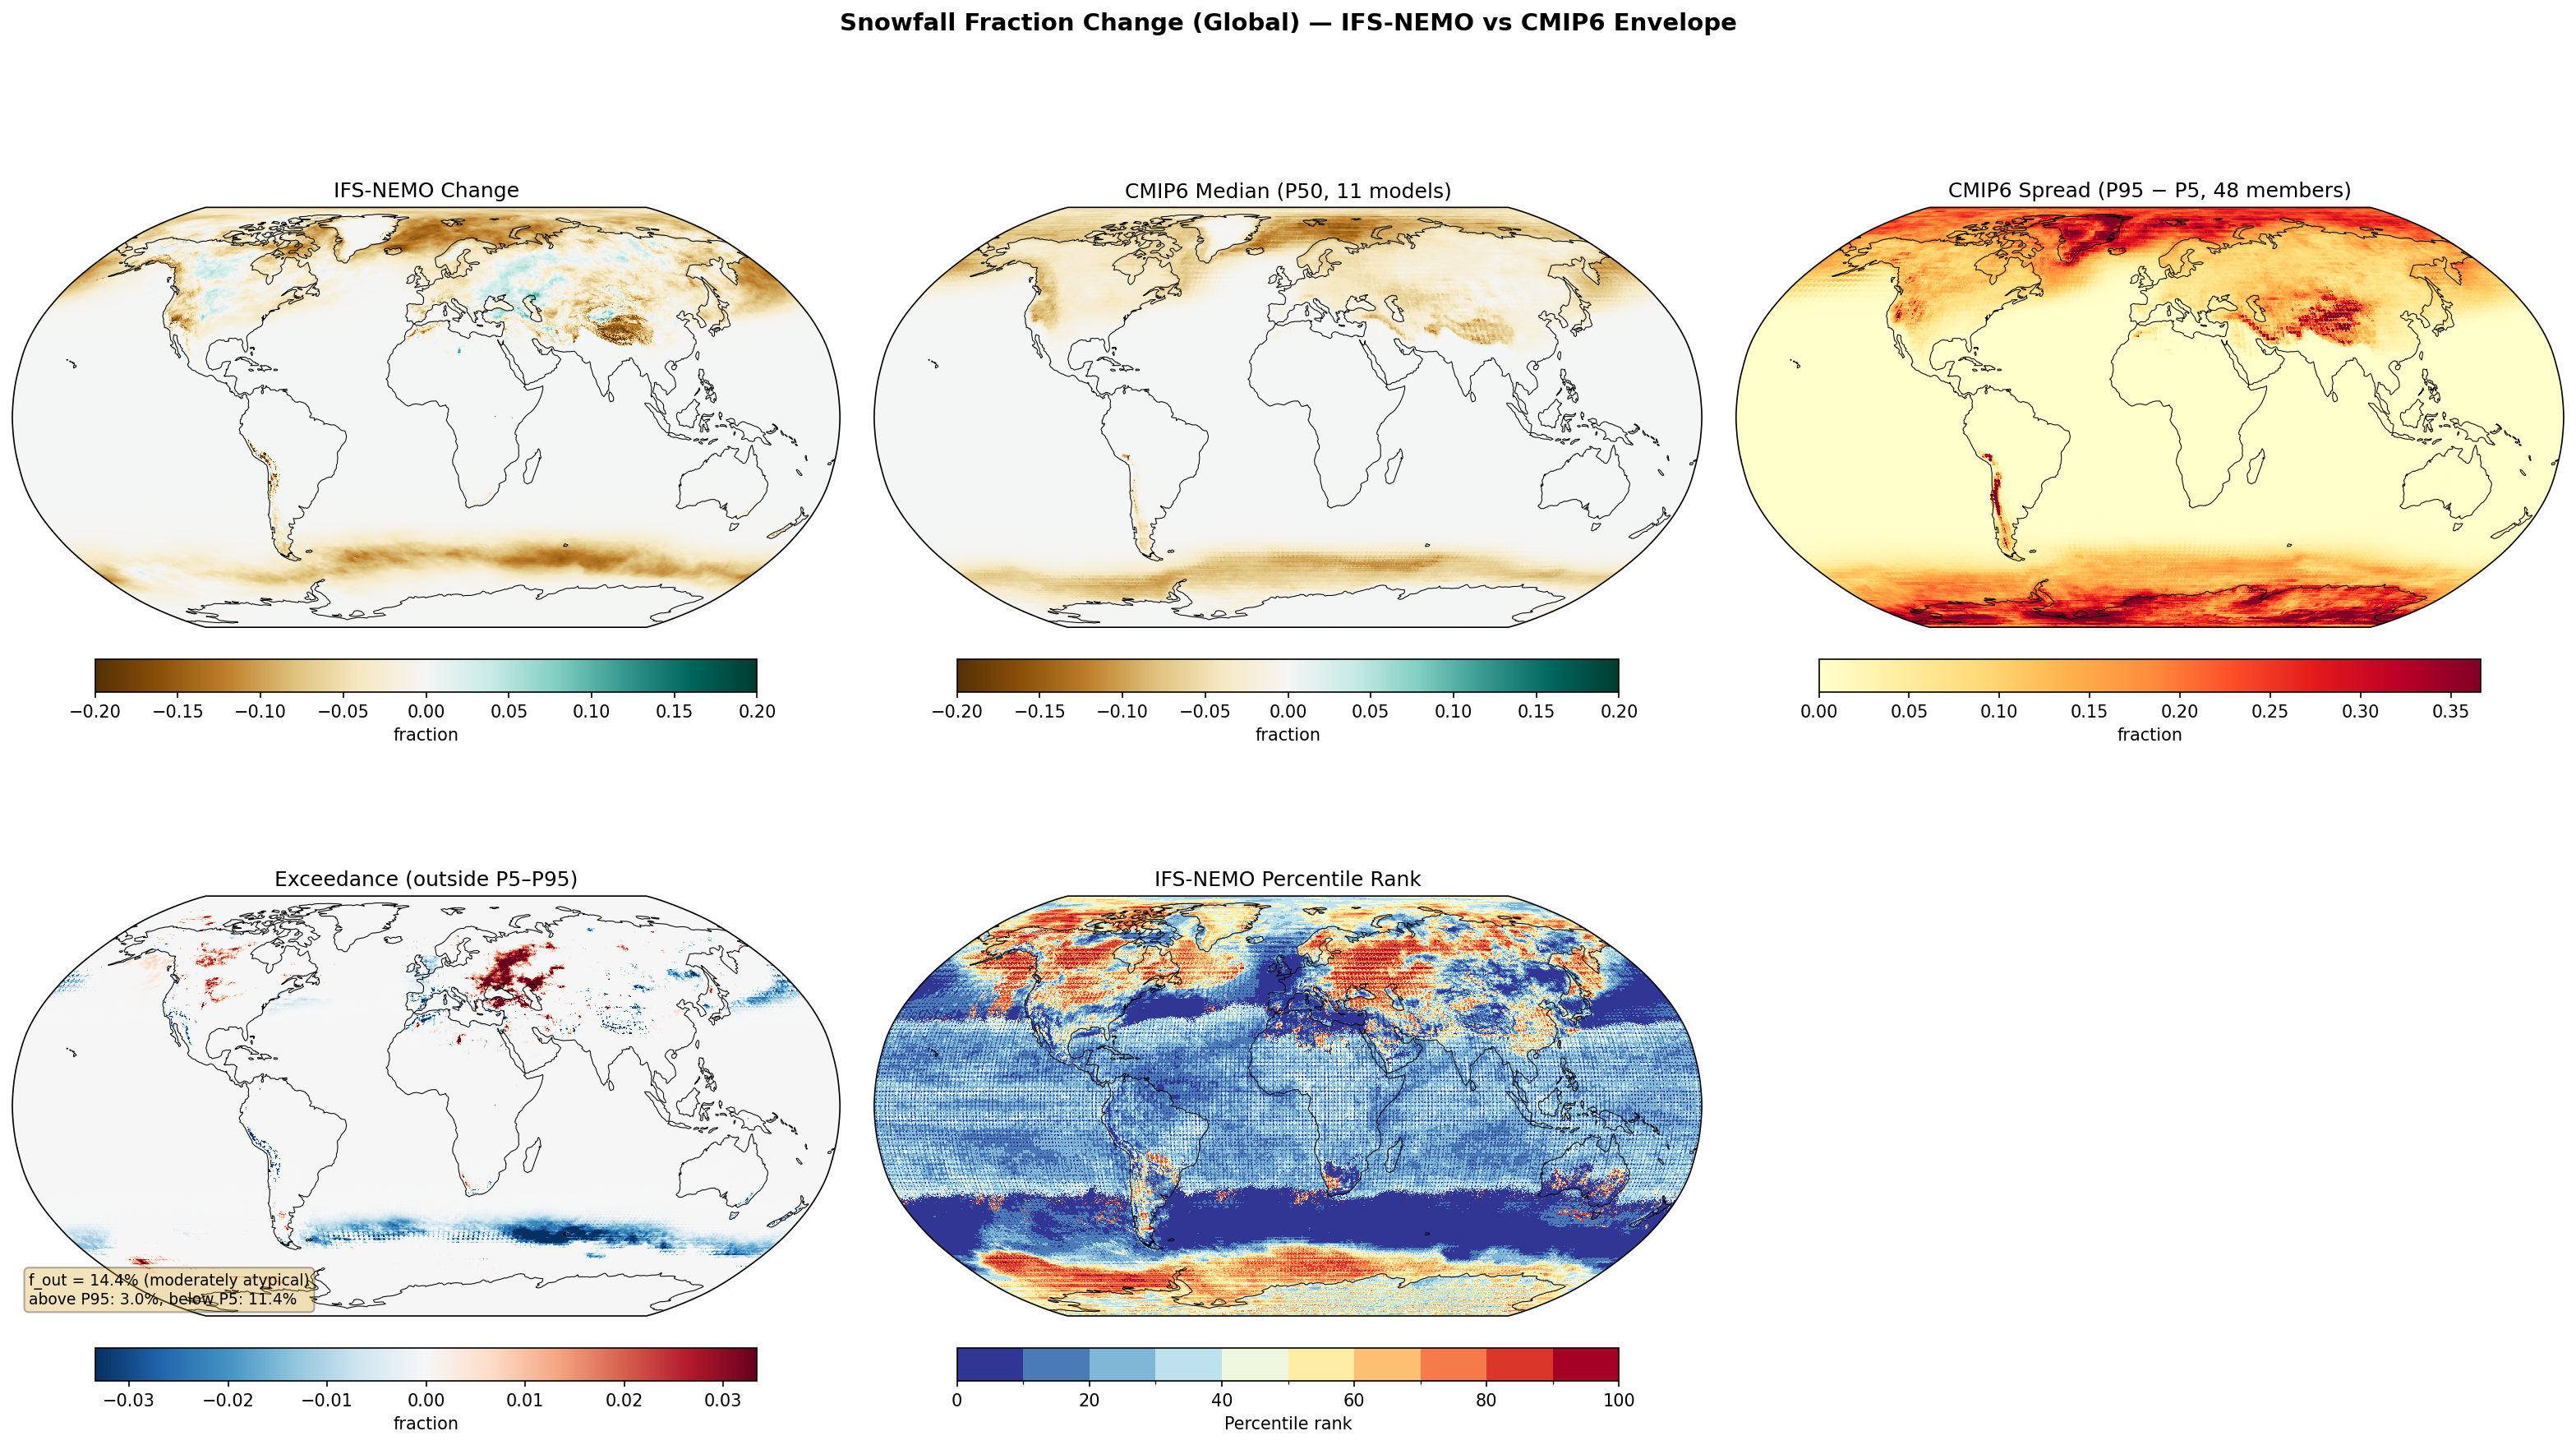
Snowfall Fraction Change (Global) — IFS-NEMO vs CMIP6 Envelope f_out 14.4%
Envelope Metrics
| f_out (outside P5–P95) | 14.4% moderately atypical |
|---|---|
| Above P95 | 3.0% |
| Below P5 | 11.4% |
| CMIP6 ensemble | 11 models, 48 members |
| Variables | avg_tsrwe, avg_tprate |
|---|---|
| Models | ifs-nemo |
| Units | kg/m2/s |
| Baseline | 1990-2014 |
| Future | 2040-2049 |
| Method | SF = prsn / pr; ΔSF = SF_future − SF_hist. Compared to CMIP6 percentile envelope (P5, P50, P95). |
Summary high
IFS-NEMO projects a widespread reduction in snowfall fraction (SF) due to warming, largely consistent with CMIP6 expectations but with notable regional outliers (f_out = 14.4%). The model predicts a significantly stronger shift from snow to rain in the Southern Ocean (below CMIP6 P5) while retaining higher snowfall fractions than the CMIP6 upper bound in Eastern Europe and Western Russia.
Key Findings
- Global reduction in snowfall fraction is the dominant signal, driven by thermodynamic warming.
- IFS-NEMO is moderately atypical (f_out = 14.4%), with deviations skewed towards the lower bound (11.4% of area < P5 vs 3.0% > P95).
- A distinct dipole exists: IFS-NEMO shows stronger snow-to-rain conversion in the Southern Ocean/North Atlantic (blue exceedance) but weaker conversion in Eastern Europe/Russia (red exceedance).
- CMIP6 inter-model spread is highest in the mid-latitude transition zones and over major topography (Himalayas, Andes, Rockies).
Spatial Patterns
The CMIP6 median shows a smooth, coherent decrease in SF across Northern Hemisphere land and Southern Ocean sea-ice margins. IFS-NEMO replicates this broad pattern but introduces sharper features. The Exceedance map reveals a prominent region in Eastern Europe and Western Russia where IFS-NEMO values are above the P95 envelope (indicating less snow loss). Conversely, a zonal band around the Antarctic sea-ice edge and patches in the North Atlantic fall below the P5 envelope (indicating more severe snow loss).
Model Agreement
IFS-NEMO generally agrees with the sign of change (negative) but disagrees on magnitude in key regions. The 11.4% of the globe falling below the P5 threshold suggests IFS-NEMO is generally more aggressive in converting snowfall to rainfall than the bulk of the CMIP6 ensemble, particularly over high-latitude oceans. The exception is Eurasia, where it sits at the opposite extreme of the distribution.
Physical Interpretation
The universal decrease in SF is driven by the poleward and upward migration of the 0°C isotherm (Clausius-Clapeyron response). The Southern Ocean anomaly suggests IFS-NEMO simulates stronger surface warming or a more rapid retreat of the freezing line in the marine boundary layer compared to CMIP6. The Eurasian anomaly (retaining relatively more snow fraction) could result from a colder regional bias in IFS-NEMO or differences in winter atmospheric circulation (e.g., blocking) that maintains colder air masses over the continent relative to the coarser CMIP6 mean.
Caveats
- Percentile ranks and exceedance in the Tropics (approx. 30°S–30°N) are dominated by numerical noise as snowfall is negligible in both baseline and future periods.
- Analysis relies on fractional change; regions with low total precipitation could show large fractional swings with minimal hydrological impact.
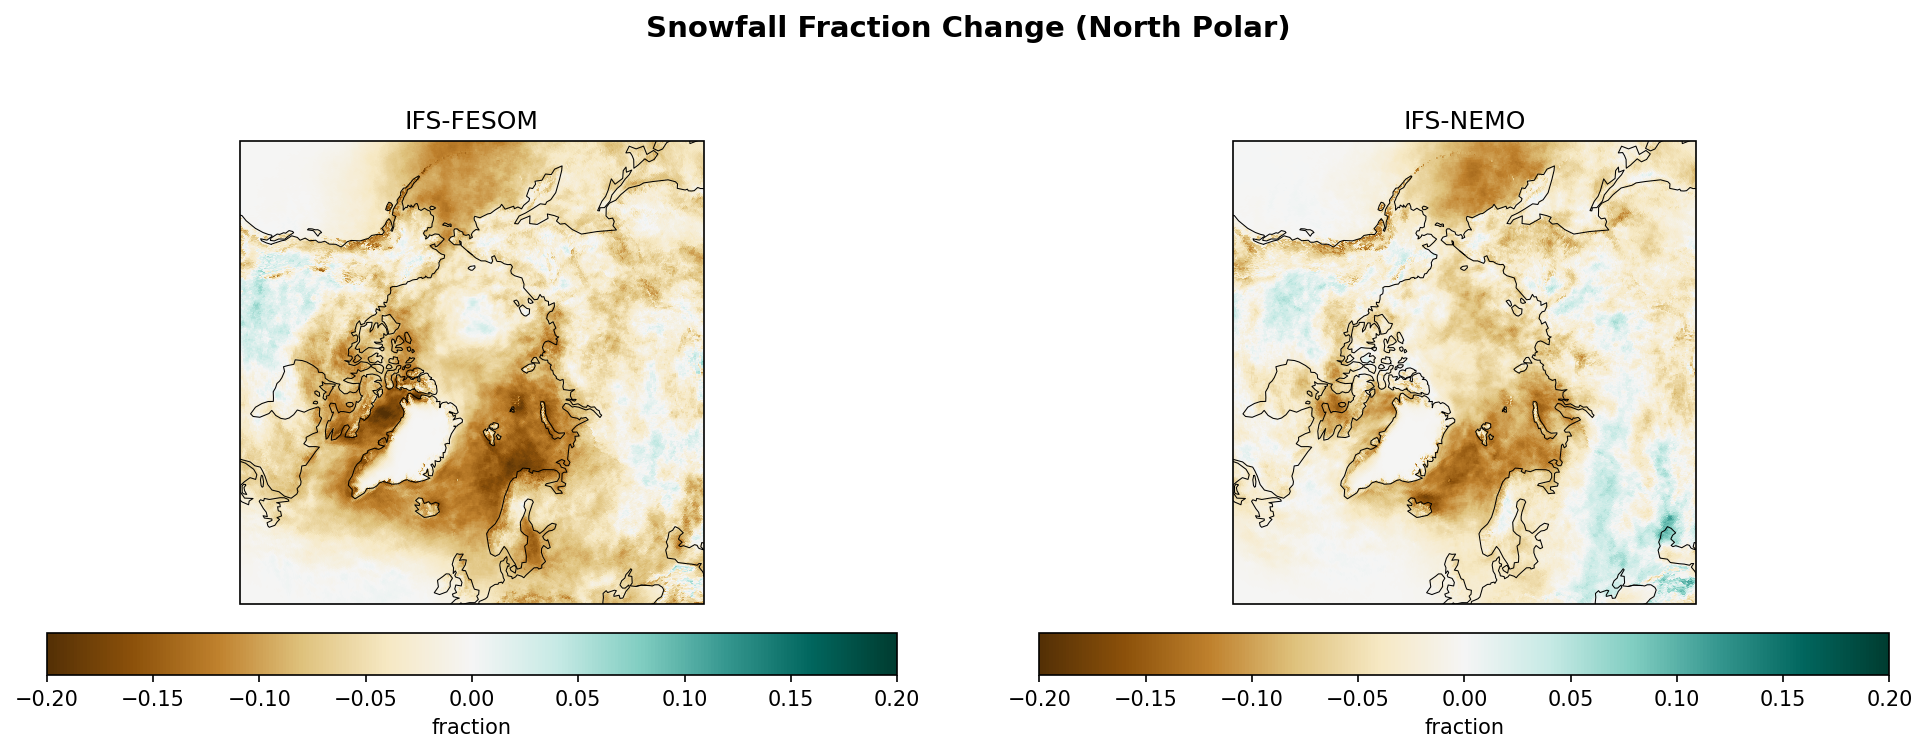
Snowfall Fraction Change (North Polar)
| Variables | avg_tsrwe, avg_tprate |
|---|---|
| Models | ifs-fesom, ifs-nemo, CMIP6-MMM |
| Units | kg/m2/s |
| Baseline | 1990-2014 |
| Future | 2040-2049 |
| Method | SF = avg_tsrwe / avg_tprate; ΔSF = SF_future − SF_hist. |
Summary high
The figure illustrates projected changes in North Polar snowfall fraction (snow to total precipitation ratio) for 2040-2049 relative to 1990-2014, comparing two high-resolution DestinE simulations (IFS-FESOM, IFS-NEMO) against the CMIP6 multi-model mean. While all models show a dominant reduction in snowfall fraction due to warming, the DestinE models exhibit significant spatial heterogeneity and localized increases absent in the smooth CMIP6 mean.
Key Findings
- Widespread decrease in snowfall fraction (brown) across the North Atlantic, Barents Sea, and Nordic Seas in all models, consistent with thermodynamic warming and sea-ice loss.
- CMIP6-MMM displays a smooth, concentric pattern of decrease extending into the central Arctic, whereas DestinE models show much sharper gradients controlled by topography (e.g., Greenland margins, Scandinavia).
- Both IFS-FESOM and IFS-NEMO show localized regions of increased snowfall fraction (teal) in the central Arctic and Siberia, contrasting with the monotonic decrease in CMIP6.
- IFS-FESOM and IFS-NEMO show high consistency in the North Atlantic sector but diverge in the spatial placement of anomalies over the continental interiors and central Arctic Ocean.
Spatial Patterns
The CMIP6-MMM shows a coherent poleward retreat of the snow-dominated zone. In contrast, IFS-FESOM and IFS-NEMO reveal complex 'noisy' patterns, particularly over the Canadian Basin and Siberia, where patches of increased snowfall fraction appear. Strong decreases are concentrated along major storm tracks (North Atlantic into Barents Sea) and coastal margins. Topographic features like the Greenland Ice Sheet stand out in high resolution, with decreases restricted to the coasts and minimal change in the high-altitude interior.
Model Agreement
All models agree on the sign and approximate magnitude of the decrease in the marginal ice zones and sub-polar oceans (Barents, Kara, Greenland Seas). Significant disagreement exists in the deep Arctic and continental interiors: CMIP6 projects a uniform decrease, while DestinE models suggest a mixed response with localized increases. This discrepancy likely stems from the CMIP6 averaging process smoothing out internal variability, whereas the single-realisation DestinE runs capture specific decadal phases.
Physical Interpretation
The dominant signal is the thermodynamic transition from snow to rain as the 0°C isotherm shifts poleward. The strong decrease in the Barents Sea is linked to sea-ice retreat and boundary layer warming. The counter-intuitive increases (teal) in DestinE models likely result from two factors: (1) Decadal internal variability (e.g., circulation changes causing local cooling or moisture transport shifts) dominating the short 10-year window; (2) Seasonal shifts where precipitation increases in winter (falling as snow) but decreases in summer (rain), raising the annual snowfall fraction despite mean warming.
Caveats
- The 10-year averaging period (2040-2049) is short, making the DestinE maps highly susceptible to internal climate variability (noise) compared to the CMIP6 ensemble mean.
- Differences in microphysics schemes between IFS and the diverse CMIP6 models may influence the exact temperature threshold for the rain/snow partition.
Snowfall Fraction Change (North Polar) — IFS-FESOM vs CMIP6 Envelope f_out 17.5%
Envelope Metrics
| f_out (outside P5–P95) | 17.5% notably atypical |
|---|---|
| Above P95 | 1.6% |
| Below P5 | 15.8% |
| CMIP6 ensemble | 11 models, 48 members |
| Variables | avg_tsrwe, avg_tprate |
|---|---|
| Models | ifs-fesom |
| Units | kg/m2/s |
| Baseline | 1990-2014 |
| Future | 2040-2049 |
| Method | SF = prsn / pr; ΔSF = SF_future − SF_hist. Compared to CMIP6 percentile envelope (P5, P50, P95). |
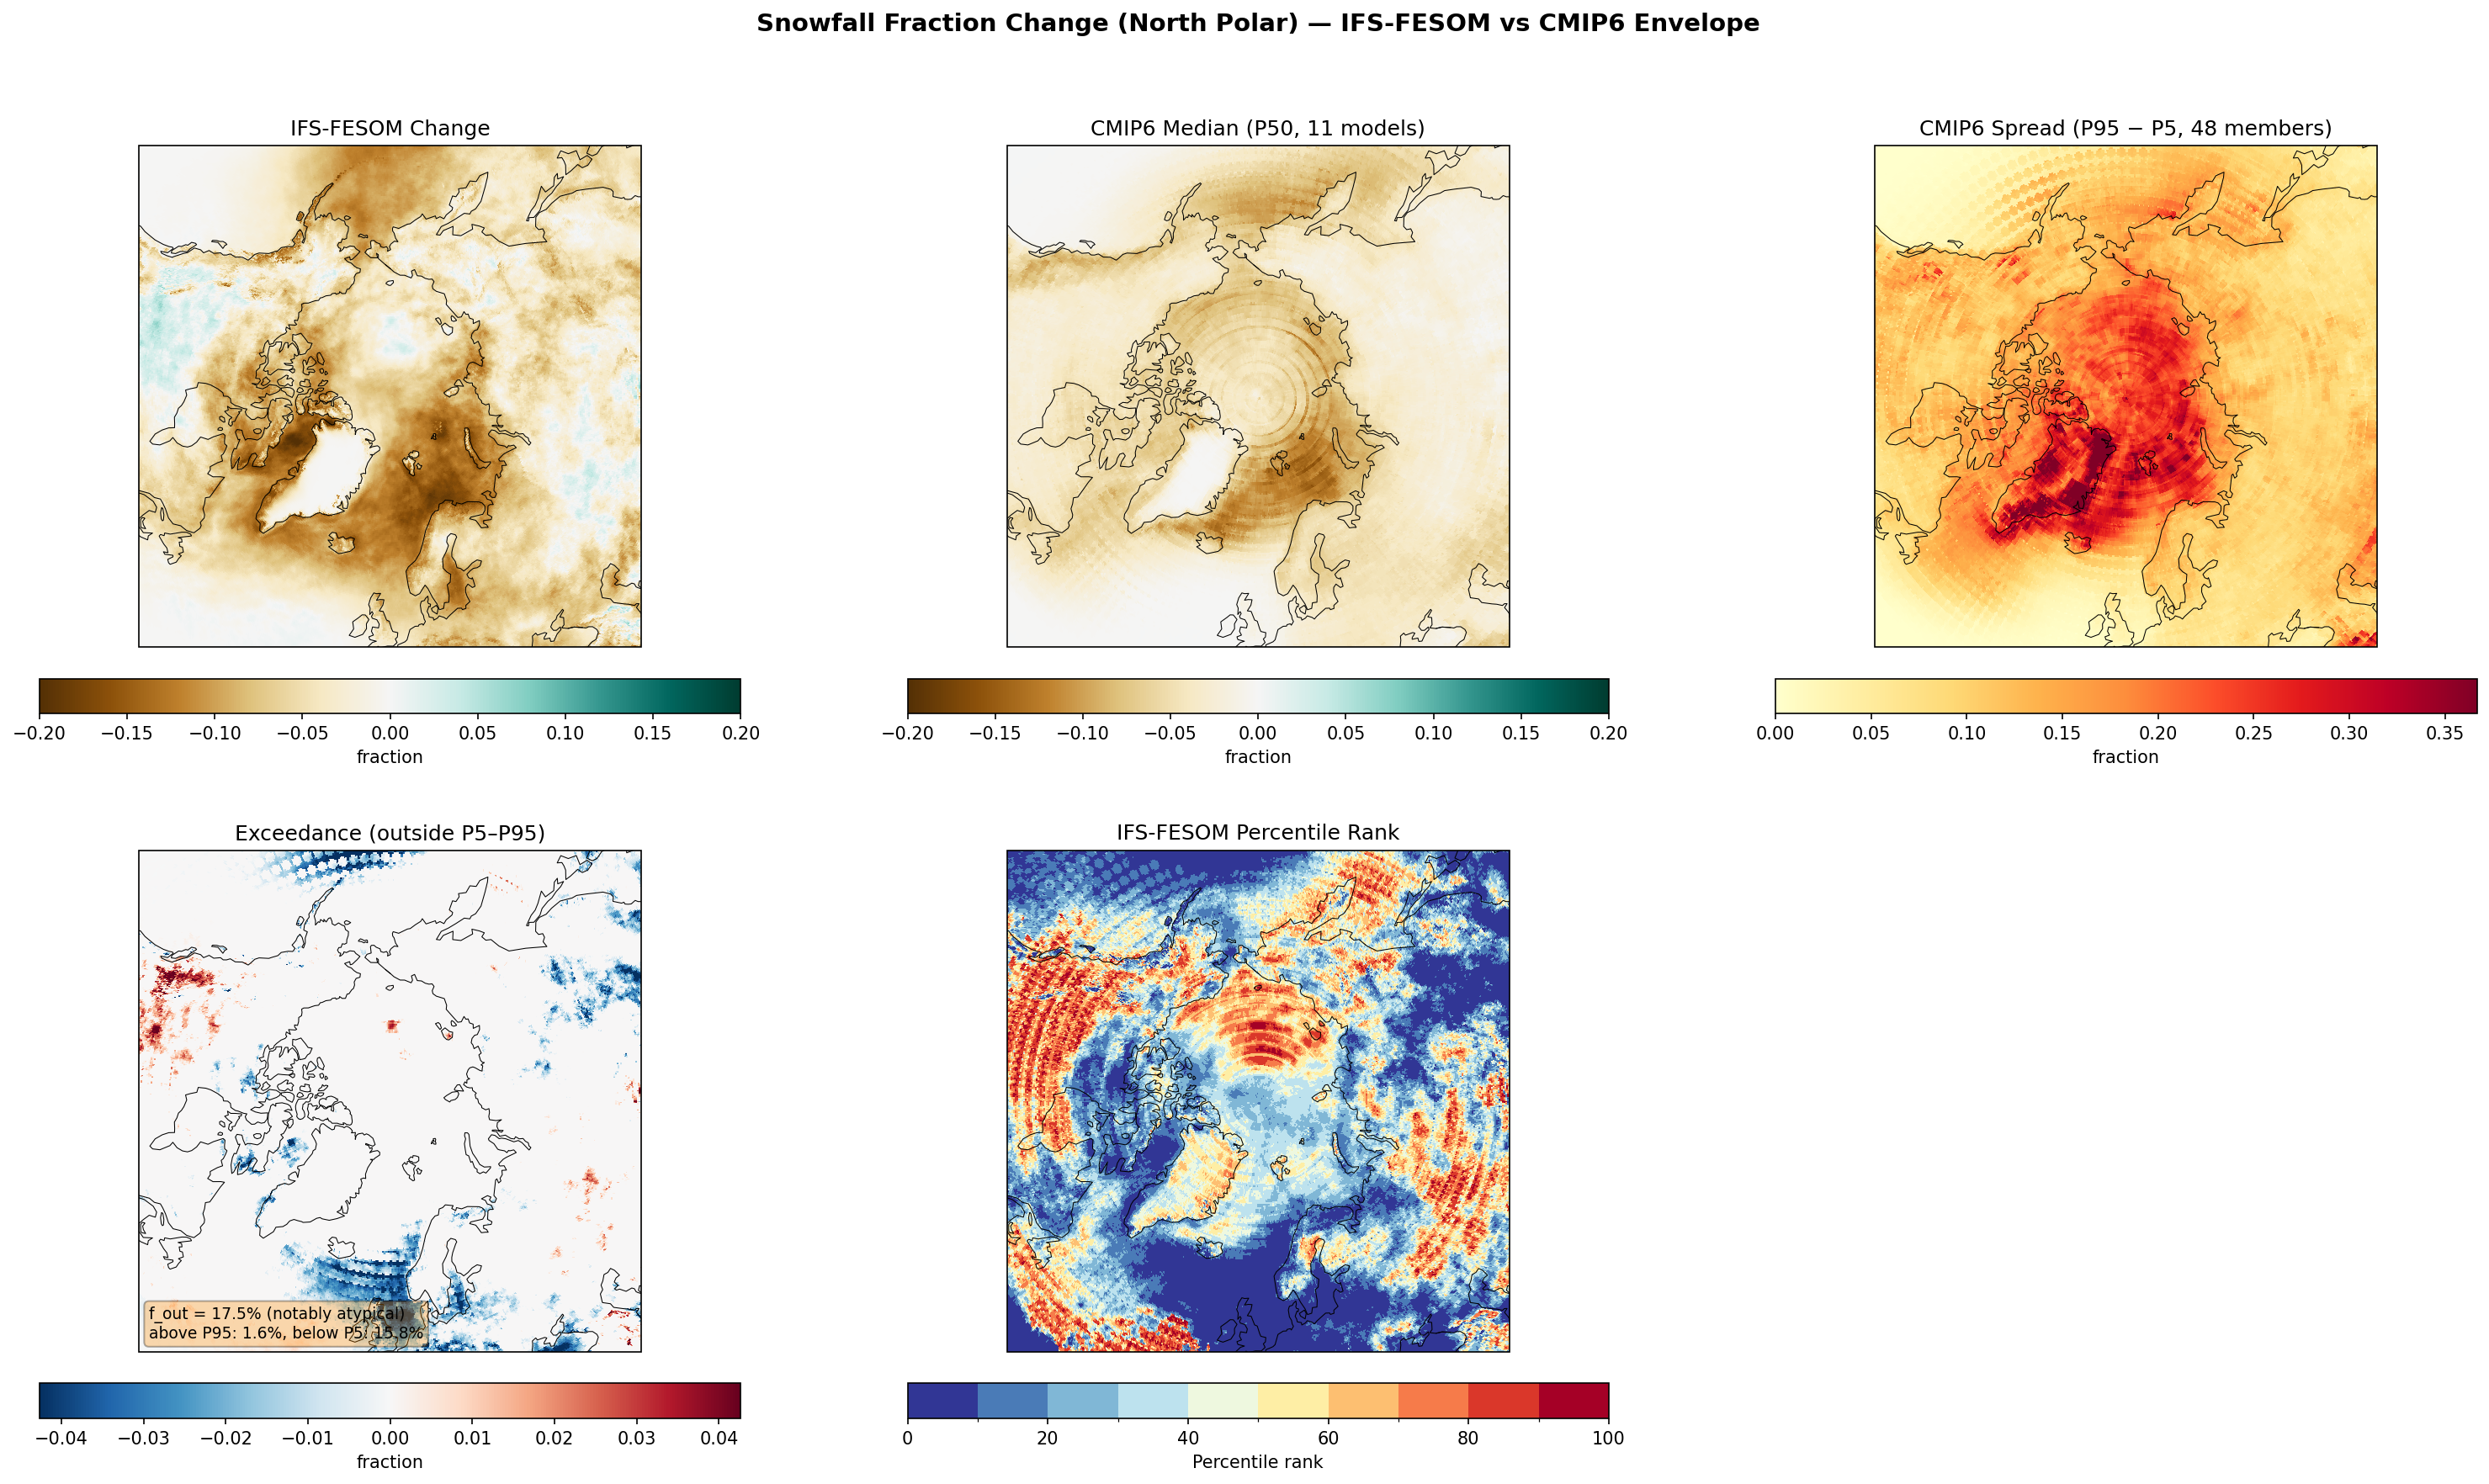
Summary high
IFS-FESOM projects a widespread and intense reduction in North Polar snowfall fraction (shift from snow to rain) by 2040-2049, exhibiting a notably stronger decline than the CMIP6 ensemble over nearly 16% of the domain.
Key Findings
- IFS-FESOM predicts a general decrease in snowfall fraction across the entire Arctic, with magnitudes often exceeding -0.20 (fraction) in sub-polar maritime regions.
- The model is 'notably atypical' (f_out = 17.5%), with the vast majority of deviations (15.8%) falling below the CMIP6 P5 threshold, indicating a significantly stronger shift from snow to rain than the multi-model envelope.
- The largest discrepancies (IFS-FESOM showing much greater loss of snow fraction) are concentrated in the North Atlantic inflow region (Norwegian/Barents Seas), the North Pacific, and coastal Eurasia.
Spatial Patterns
The most intense reductions in snowfall fraction appear over the North Atlantic storm track and the Barents Sea. The exceedance map shows coherent blue structures (below P5) stretching from the North Atlantic into the Eurasian continent and in the Bering Sea region. The central Arctic shows smaller absolute changes (remains mostly snow) but high relative spread in CMIP6.
Model Agreement
There is broad agreement on the sign of change (negative/drying of snow fraction) across the domain. However, IFS-FESOM systematically lies at the lower tail (Percentile Rank < 10) of the CMIP6 distribution for large swathes of the mid-to-high latitudes, suggesting it simulates a warmer or more rain-dominated future Arctic than most CMIP6 models.
Physical Interpretation
The widespread reduction is driven by thermodynamic warming (Polar Amplification) causing precipitation to fall as rain rather than snow. The stronger response in IFS-FESOM likely stems from either a stronger regional warming sensitivity (possibly due to resolved ocean heat transport in the Atlantic/Barents sector) or differences in microphysical parameterizations controlling the rain-snow partition temperature. The high resolution allows for more defined ingress of warm, moist air masses via storm tracks, potentially accelerating the phase transition in marginal zones.
Caveats
- Snowfall fraction is sensitive to specific microphysics schemes and temperature thresholds, which vary between models.
- The CMIP6 ensemble (11 models) spread is large in the transition zones (red areas in Spread panel), indicating high structural uncertainty in these specific regions.
Snowfall Fraction Change (North Polar) — IFS-NEMO vs CMIP6 Envelope f_out 14.4%
Envelope Metrics
| f_out (outside P5–P95) | 14.4% moderately atypical |
|---|---|
| Above P95 | 3.0% |
| Below P5 | 11.4% |
| CMIP6 ensemble | 11 models, 48 members |
| Variables | avg_tsrwe, avg_tprate |
|---|---|
| Models | ifs-nemo |
| Units | kg/m2/s |
| Baseline | 1990-2014 |
| Future | 2040-2049 |
| Method | SF = prsn / pr; ΔSF = SF_future − SF_hist. Compared to CMIP6 percentile envelope (P5, P50, P95). |
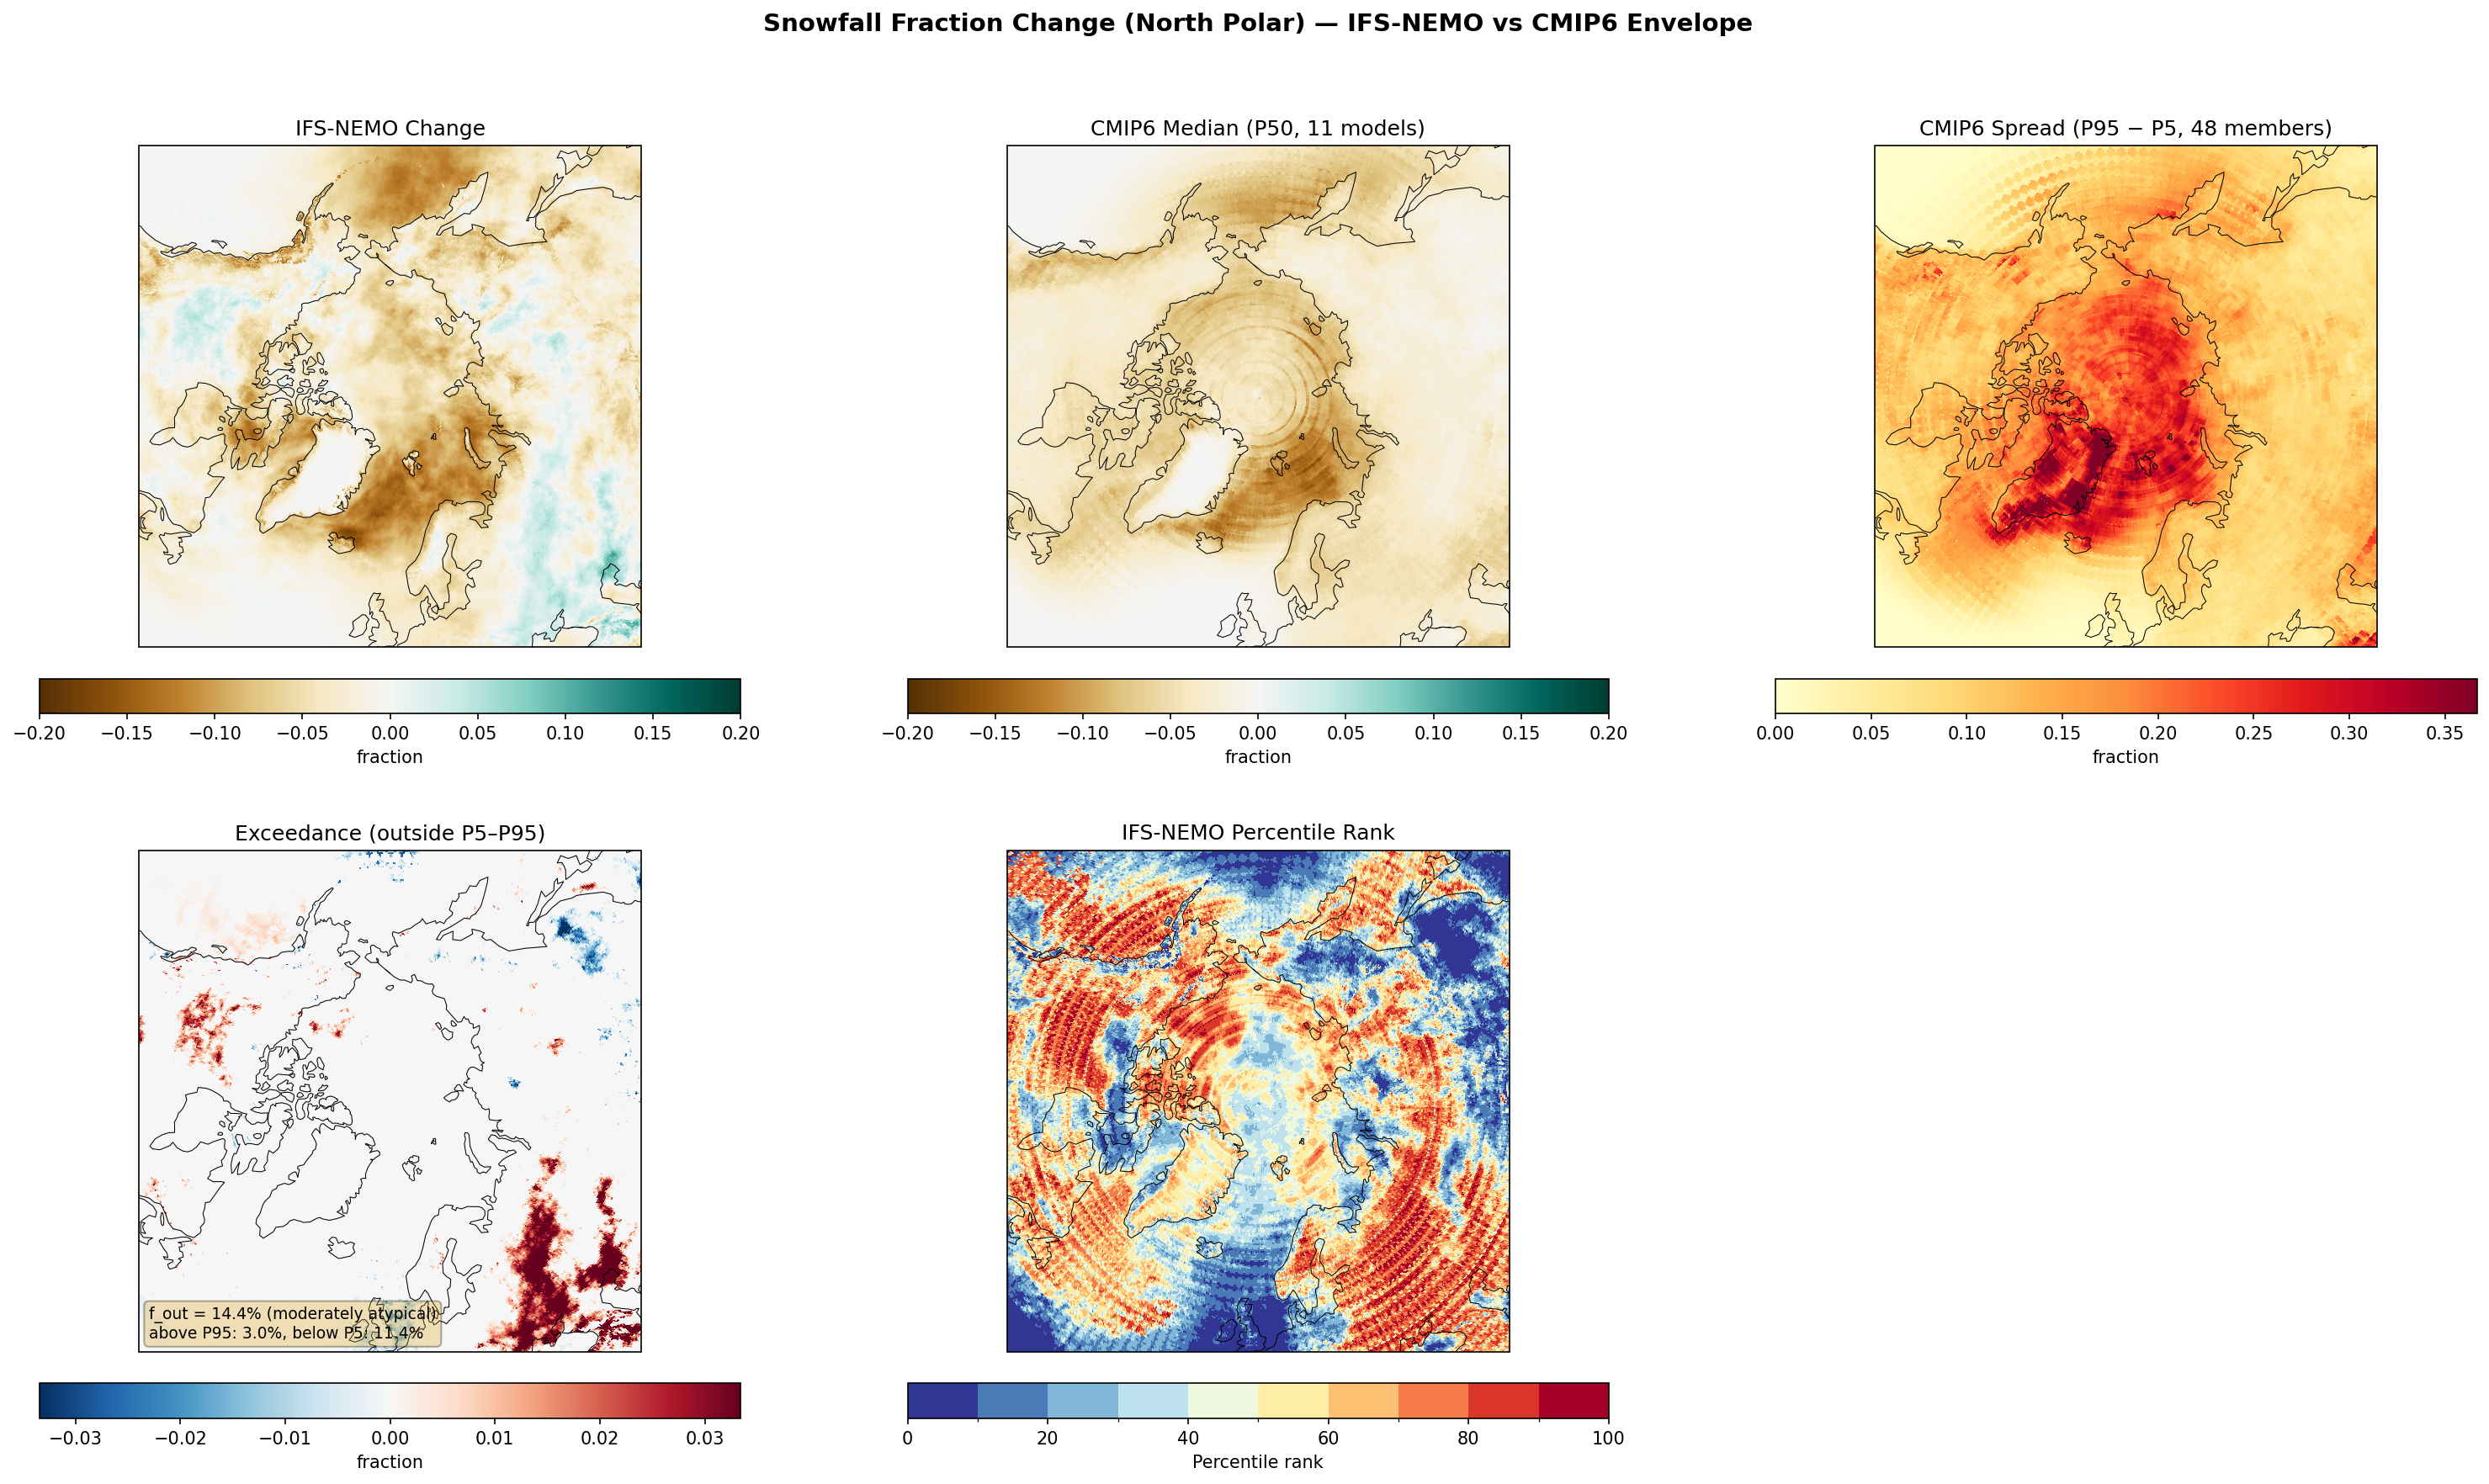
Summary high
IFS-NEMO projects a widespread reduction in snowfall fraction across the North Polar region by the 2040s, generally following the CMIP6 ensemble pattern but showing a stronger-than-typical shift from snow to rain in the North Atlantic and Barents Sea sectors.
Key Findings
- Snowfall fraction decreases significantly (up to -0.20) across the Arctic Ocean, Barents Sea, and high-latitude landmasses due to warming.
- IFS-NEMO is moderately atypical (f_out = 14.4%), with a skew towards stronger reductions than CMIP6 (11.4% of area < P5) rather than weaker ones (3.0% > P95).
- A distinct dipole pattern exists in the exceedance: IFS-NEMO shows excessive snow loss (vs CMIP6) in the North Atlantic/Barents Sea, but retains more snow fraction than CMIP6 in Western Russia.
Spatial Patterns
The spatial pattern of change is characterized by strong negative anomalies (browning) centered on the seasonal sea ice zones and the North Atlantic storm track. The 'Exceedance' map highlights a region of weaker decline (red) in Western Russia and widespread regions of stronger decline (blue) extending from the North Atlantic into the Barents Sea and parts of the Canadian Archipelago.
Model Agreement
IFS-NEMO agrees well with the CMIP6 median over the central Arctic Ocean and most of North America. Disagreement is concentrated in the maritime inflow regions (North Atlantic/Norwegian Sea) where IFS-NEMO falls below the CMIP6 5th percentile, indicating a more aggressive transition to liquid precipitation.
Physical Interpretation
The widespread reduction in snowfall fraction is a thermodynamic response to Arctic Amplification. The areas where IFS-NEMO shows stronger declines (North Atlantic/Barents) likely reflect enhanced 'Atlantification'—where the high-resolution ocean model (eddy-permitting) transports warm Atlantic water northward more effectively than coarse CMIP6 models, raising surface temperatures and shifting the precipitation phase from snow to rain. The localized retention of snow fraction in Russia may stem from internal variability or differences in continental winter cooling rates.
Caveats
- The analysis compares a single high-resolution realization against a coarse ensemble; internal variability (e.g., NAO phase) could influence the regional signals.
- Snowfall fraction is sensitive to microphysics parameterizations of the rain/snow transition temperature, which differ between models.
Snowfall Fraction Change (South Polar)
| Variables | avg_tsrwe, avg_tprate |
|---|---|
| Models | ifs-fesom, ifs-nemo, CMIP6-MMM |
| Units | kg/m2/s |
| Baseline | 1990-2014 |
| Future | 2040-2049 |
| Method | SF = avg_tsrwe / avg_tprate; ΔSF = SF_future − SF_hist. |
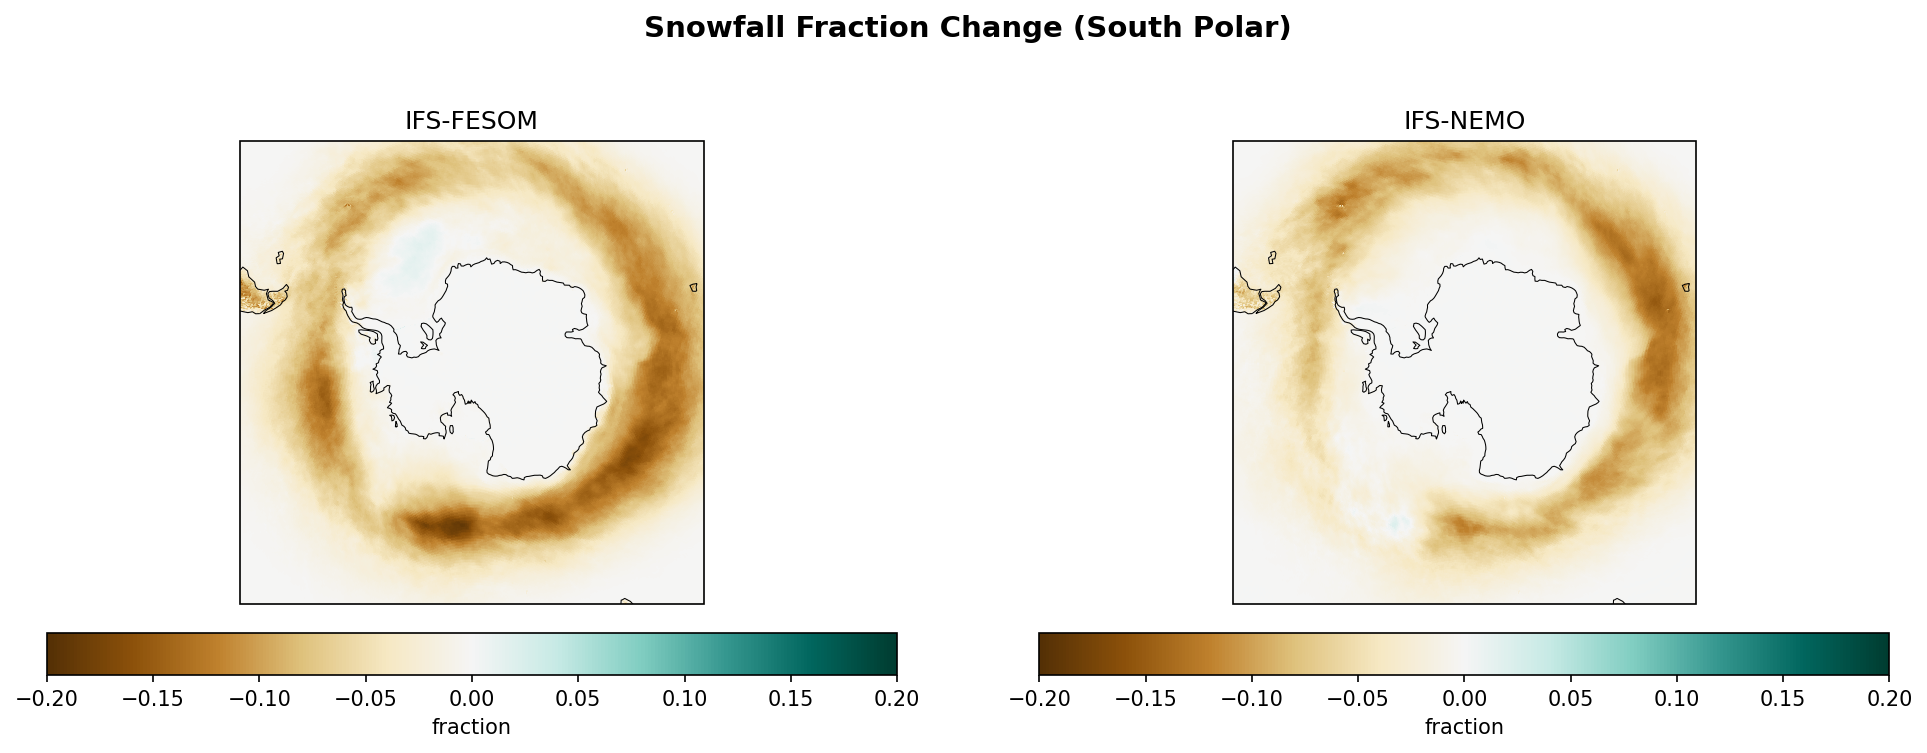
Summary high
IFS-FESOM, IFS-NEMO, and CMIP6-MMM all exhibit a prominent annular reduction in snowfall fraction over the Southern Ocean storm tracks, driven by thermodynamic warming, while the Antarctic continent shows negligible change.
Key Findings
- A distinct zonal band of decreased snowfall fraction (reductions of 0.1 to >0.2) encircles Antarctica between roughly 50°S and 65°S in all models.
- The Antarctic continent displays near-zero change (white), indicating that future temperatures remain sufficiently low to maintain 100% solid precipitation.
- IFS-FESOM and IFS-NEMO show high consistency with each other, with slightly more granular spatial structures compared to the smoother, striated pattern of the CMIP6-MMM.
Spatial Patterns
The dominant feature is a 'brown ring' of negative change over the Southern Ocean, indicating a shift from snow to rain. This band is strongest in the South Atlantic and Indian Ocean sectors. Over the Antarctic continent, the signal is neutral. CMIP6-MMM shows minor, likely noisy, positive anomalies (pale teal) near the Ross Sea/Ice Shelf which are not replicated in the DestinE models.
Model Agreement
There is strong structural agreement between the DestinE models (IFS-FESOM/NEMO) and the CMIP6 ensemble mean regarding the latitudinal position and sign of the changes. The IFS models resolve sharper gradients in the storm tracks, whereas CMIP6-MMM exhibits concentric smoothing artifacts.
Physical Interpretation
The pattern is driven by the poleward migration of the freezing level (0°C isotherm) due to global warming. In the Southern Ocean 'transition zone', warming causes a phase change in precipitation from snow to rain. Over the continent, despite warming, absolute temperatures remain well below freezing, preserving the snowfall fraction at 1.0 (no change).
Caveats
- CMIP6-MMM smoothness is a result of averaging diverse grids, obscuring potential regional variation seen in high-res models.
- Calculations of fraction can be sensitive/unstable in regions with very low total precipitation, though this is less relevant in the Southern Ocean storm track.
Snowfall Fraction Change (South Polar) — IFS-FESOM vs CMIP6 Envelope f_out 17.5%
Envelope Metrics
| f_out (outside P5–P95) | 17.5% notably atypical |
|---|---|
| Above P95 | 1.6% |
| Below P5 | 15.8% |
| CMIP6 ensemble | 11 models, 48 members |
| Variables | avg_tsrwe, avg_tprate |
|---|---|
| Models | ifs-fesom |
| Units | kg/m2/s |
| Baseline | 1990-2014 |
| Future | 2040-2049 |
| Method | SF = prsn / pr; ΔSF = SF_future − SF_hist. Compared to CMIP6 percentile envelope (P5, P50, P95). |
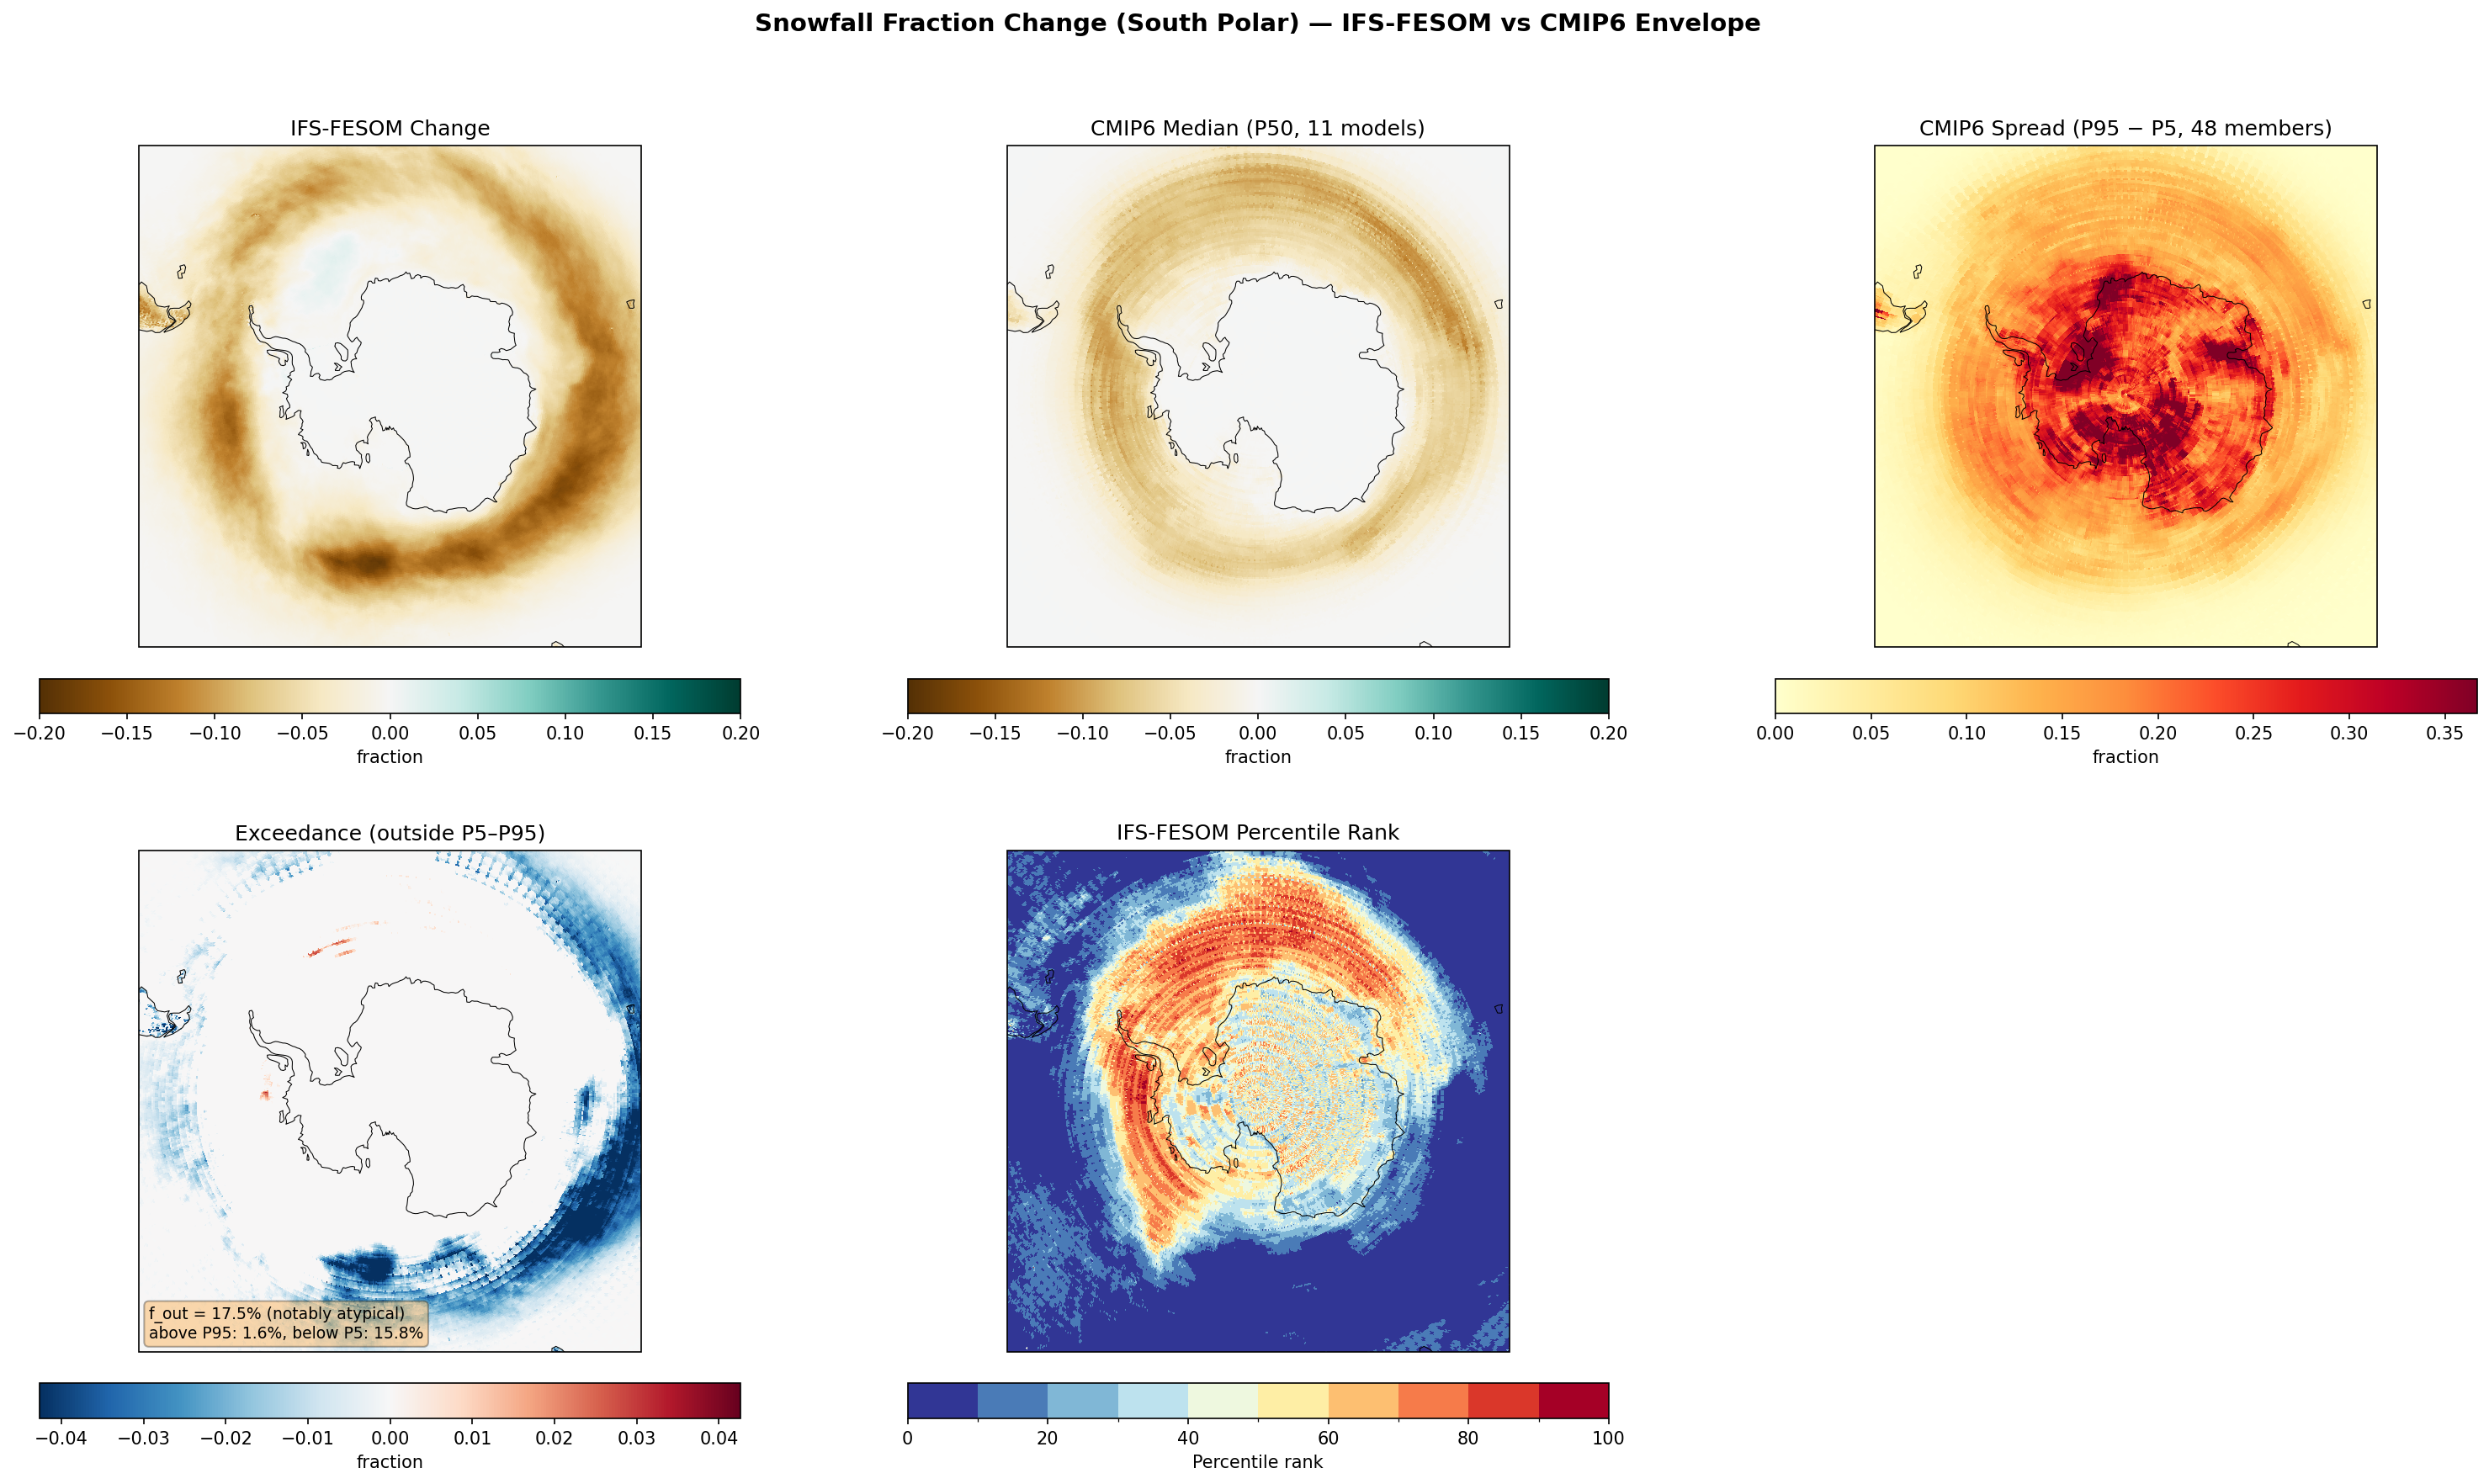
Summary high
IFS-FESOM projects a significantly stronger reduction in snowfall fraction (shift from snow to rain) over the Southern Ocean compared to the CMIP6 ensemble, with 17.5% of the domain falling outside the expected range (mostly below the 5th percentile).
Key Findings
- IFS-FESOM displays a pronounced ring of decreased snowfall fraction (-0.15 to -0.20) over the Southern Ocean (approx. 50°S–65°S), indicating a rapid transition to liquid precipitation.
- The model falls below the CMIP6 P5 threshold (blue in Exceedance panel) across broad swaths of the Southern Ocean, meaning it projects a more aggressive loss of snowfall fraction than 95% of CMIP6 members.
- Over the Antarctic continent, snowfall fraction changes are negligible, and IFS-FESOM aligns well with the CMIP6 median (Percentile Rank ~40–60).
Spatial Patterns
The figure exhibits a zonally symmetric 'bullseye' pattern: a stable core over Antarctica (no change), surrounded by a coastal ring of high CMIP6 uncertainty, and an outer ring over the Southern Ocean where IFS-FESOM shows strong negative anomalies (browning) exceeding the CMIP6 envelope.
Model Agreement
Agreement is high over the continental interior. Disagreement is significant over the Southern Ocean, where IFS-FESOM is 'notably atypical' (f_out = 17.5%) and systematically predicts a larger reduction in snowfall fraction (f_below_P5 = 15.8%) than the CMIP6 ensemble.
Physical Interpretation
The stronger decrease in snowfall fraction in IFS-FESOM suggests a more significant poleward shift of the 0°C isotherm or stronger surface warming in the Southern Ocean compared to coarser CMIP6 models. High-resolution models often resolve ocean eddies that reduce sea-ice extent and increase heat flux, potentially driving this enhanced snow-to-rain transition.
Caveats
- The high CMIP6 spread (P95-P5) over the continental margins suggests significant structural uncertainty in how standard models handle snow physics in transition zones.
- While 'atypical', the stronger signal in IFS-FESOM may represent added value from better-resolved storm tracks and air-sea interactions.
Snowfall Fraction Change (South Polar) — IFS-NEMO vs CMIP6 Envelope f_out 14.4%
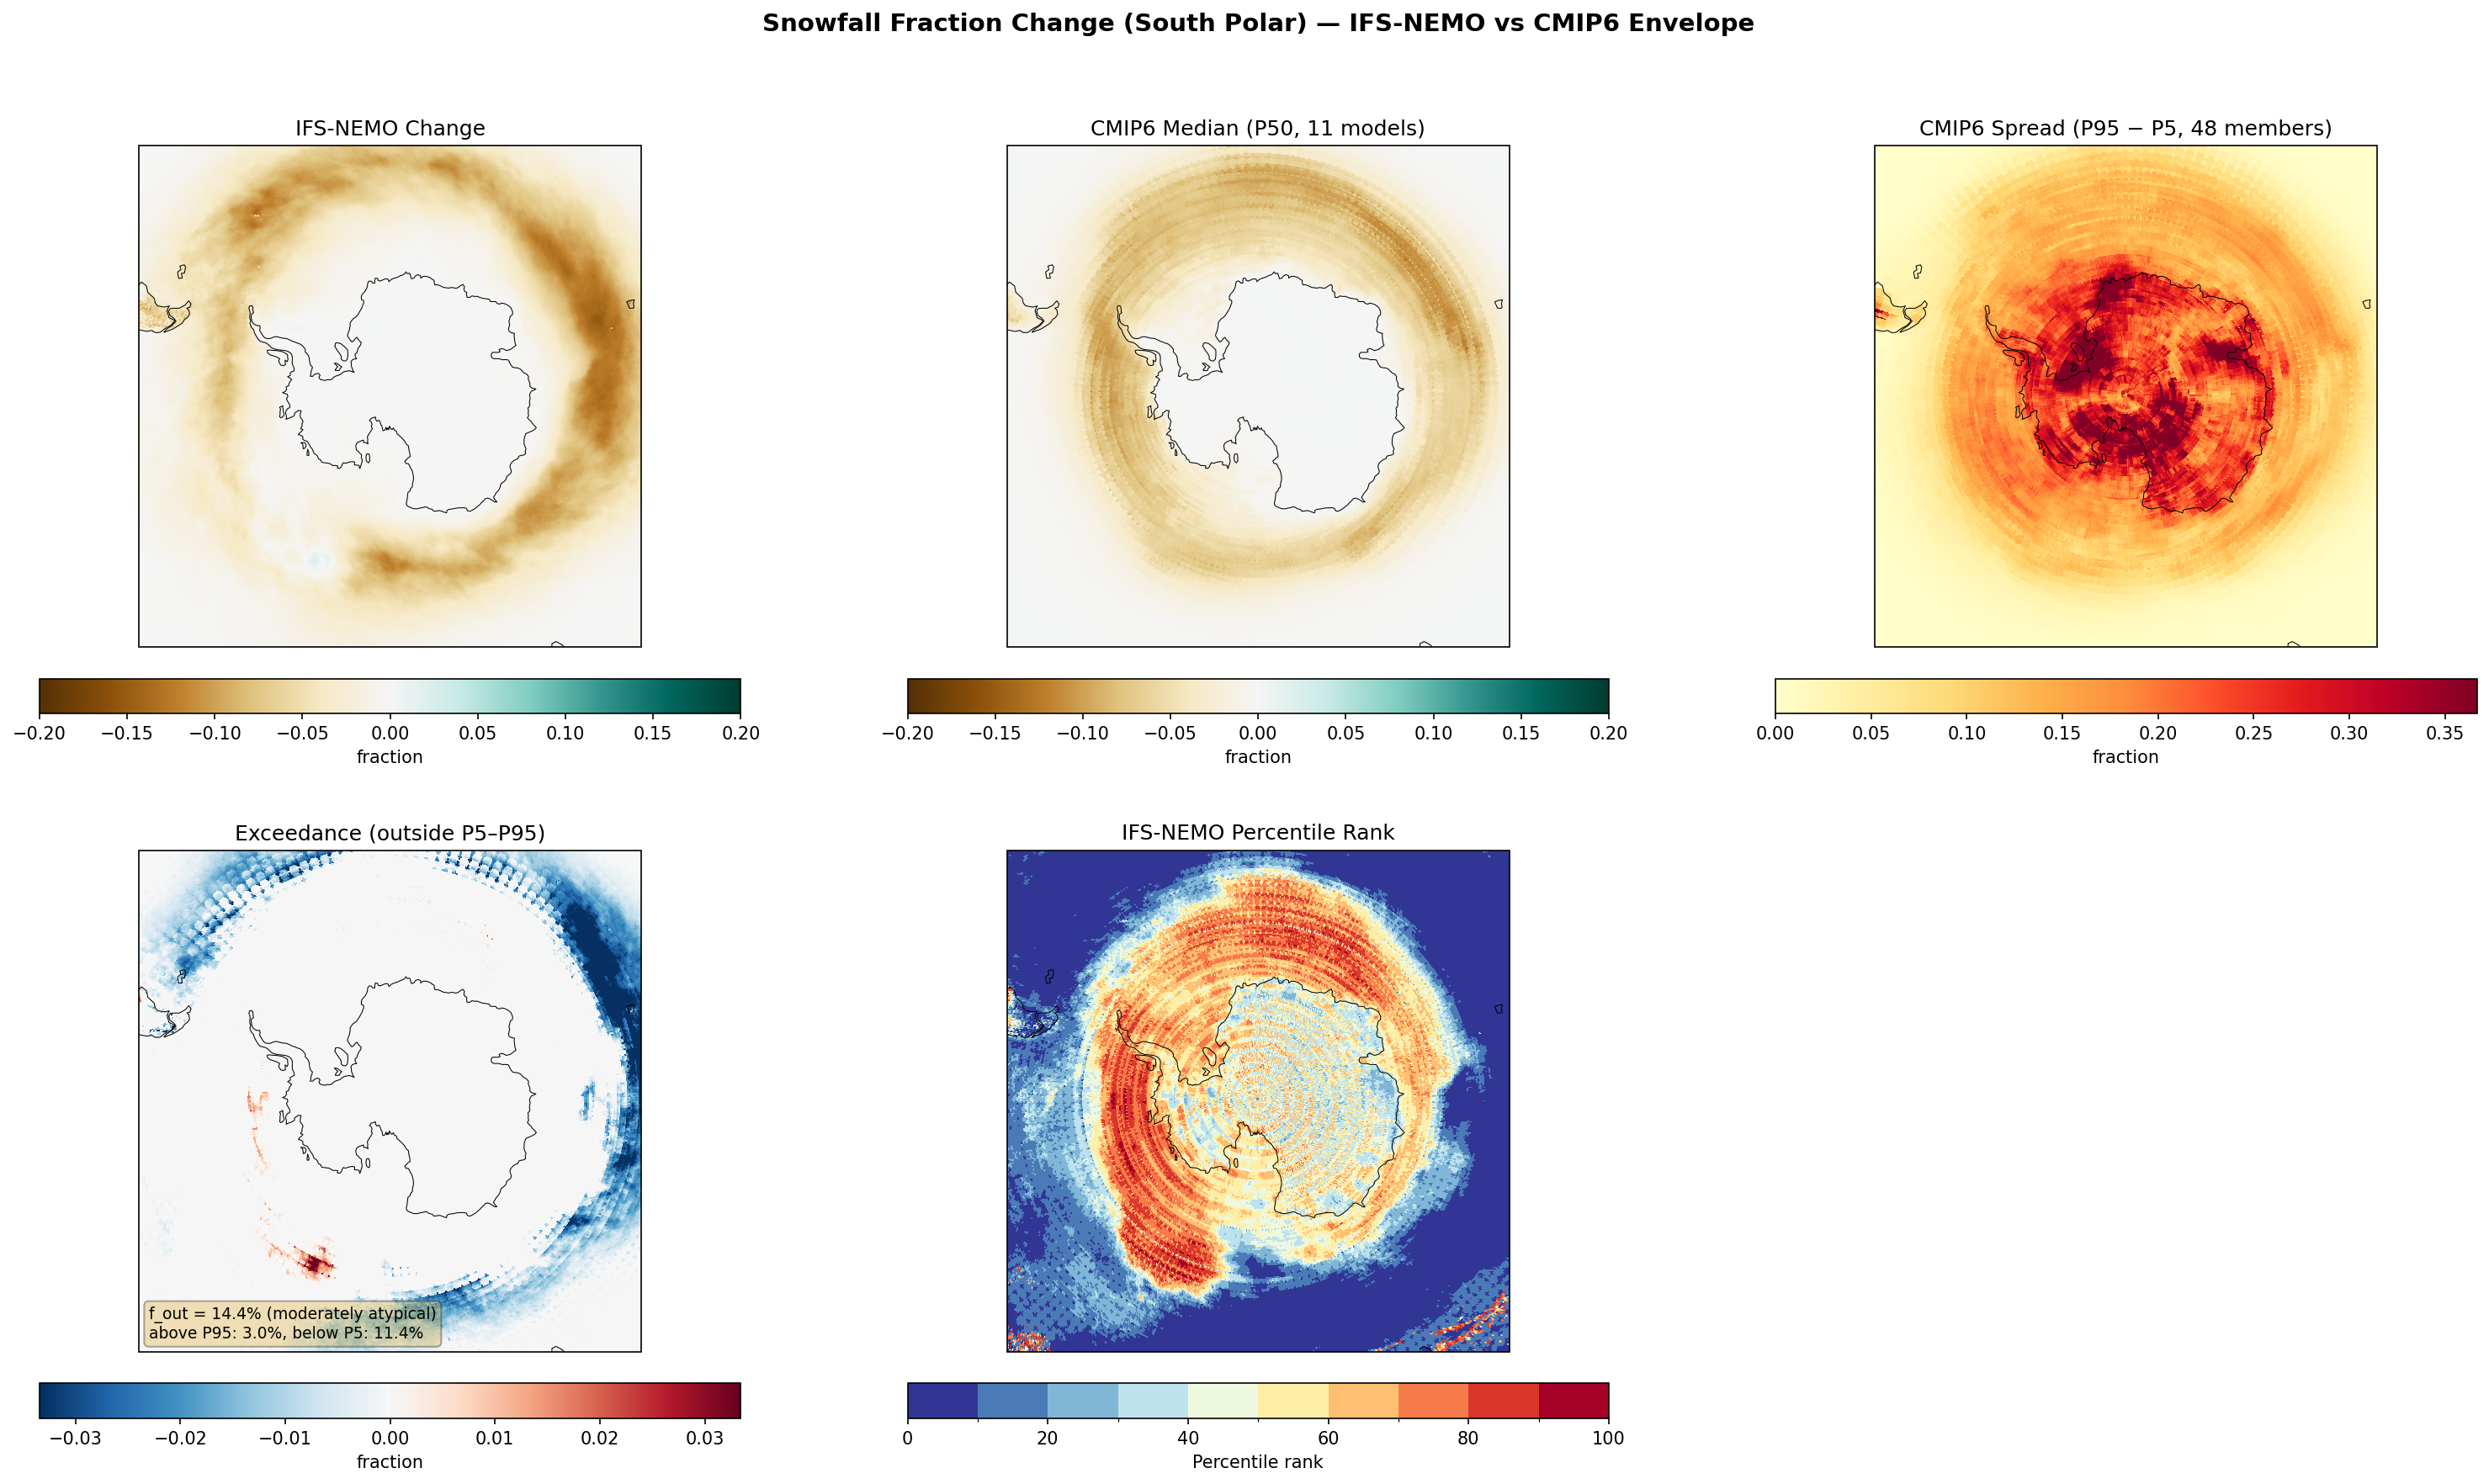
Envelope Metrics
| f_out (outside P5–P95) | 14.4% moderately atypical |
|---|---|
| Above P95 | 3.0% |
| Below P5 | 11.4% |
| CMIP6 ensemble | 11 models, 48 members |
| Variables | avg_tsrwe, avg_tprate |
|---|---|
| Models | ifs-nemo |
| Units | kg/m2/s |
| Baseline | 1990-2014 |
| Future | 2040-2049 |
| Method | SF = prsn / pr; ΔSF = SF_future − SF_hist. Compared to CMIP6 percentile envelope (P5, P50, P95). |
Summary high
IFS-NEMO projects a pronounced circum-Antarctic decrease in snowfall fraction over the Southern Ocean, significantly exceeding the magnitude of reduction predicted by the CMIP6 ensemble median.
Key Findings
- IFS-NEMO shows a strong annular reduction in snowfall fraction (up to -0.20) between 50°S and 70°S.
- The model falls below the CMIP6 P5 threshold over 11.4% of the domain, indicating a much more aggressive shift from snow to rain than the bulk of the CMIP6 ensemble.
- Changes over the Antarctic continent are negligible, as temperatures likely remain sufficiently low to maintain solid precipitation.
Spatial Patterns
A distinct zonal ring of negative anomalies surrounds Antarctica, corresponding to the storm tracks over the Southern Ocean. The exceedance (blue regions where IFS-NEMO < CMIP6 P5) is widespread across the Indian and Pacific sectors of the Southern Ocean, while the Atlantic sector shows better alignment with the CMIP6 range.
Model Agreement
While both IFS-NEMO and CMIP6 agree on the sign of the change (reduction in snowfall fraction over the ocean), IFS-NEMO is a significant outlier in magnitude. With 14.4% of the area classified as 'moderately atypical' (mostly below P5), the high-resolution model suggests a faster or more intense transition to liquid precipitation than the standard-resolution ensemble.
Physical Interpretation
The reduction in snowfall fraction is driven by atmospheric warming shifting the freezing level (0°C isotherm) poleward. The stronger response in IFS-NEMO suggests either stronger surface warming in the Southern Ocean (possibly linked to sea-ice retreat or eddy-resolving ocean heat transport) or a more poleward shift of the storm tracks compared to coarse CMIP6 models.
Caveats
- High spread in the CMIP6 ensemble over the continent suggests varied parameterisations of microphysics or temperature thresholds in cold, dry conditions.
- The analysis does not distinguish between a reduction in total snow versus a shift to rain, though the fraction metric implies the latter.