Tier 3 Global Mean Time Series CMIP6
CMIP6 Multi-Model Mean Context
Comparison with CMIP6 conventional-resolution ensemble mean (up to 8 models under SSP3-7.0, regridded to 0.25°).
Contributing models: MPI-ESM1-2-LR/r1i1p1f1, MPI-ESM1-2-LR/r2i1p1f1, MPI-ESM1-2-LR/r3i1p1f1, MPI-ESM1-2-LR/r4i1p1f1, MPI-ESM1-2-LR/r5i1p1f1, GISS-E2-1-G/r1i1p1f2, GISS-E2-1-G/r2i1p1f2, GISS-E2-1-G/r3i1p1f2, GISS-E2-1-G/r4i1p1f2, GISS-E2-1-G/r5i1p1f2, IPSL-CM6A-LR/r1i1p1f1, IPSL-CM6A-LR/r2i1p1f1, IPSL-CM6A-LR/r3i1p1f1, IPSL-CM6A-LR/r4i1p1f1, IPSL-CM6A-LR/r5i1p1f1, ACCESS-ESM1-5/r1i1p1f1, ACCESS-ESM1-5/r2i1p1f1, ACCESS-ESM1-5/r3i1p1f1, ACCESS-ESM1-5/r4i1p1f1, ACCESS-ESM1-5/r5i1p1f1, EC-Earth3/r1i1p1f1, EC-Earth3/r4i1p1f1, EC-Earth3/r6i1p1f1, EC-Earth3/r9i1p1f1, CNRM-CM6-1/r1i1p1f2, CNRM-CM6-1/r2i1p1f2, CNRM-CM6-1/r3i1p1f2, CNRM-CM6-1/r4i1p1f2, CNRM-CM6-1/r5i1p1f2, AWI-CM-1-1-MR/r1i1p1f1, AWI-CM-1-1-MR/r2i1p1f1, AWI-CM-1-1-MR/r3i1p1f1, AWI-CM-1-1-MR/r4i1p1f1, AWI-CM-1-1-MR/r5i1p1f1, CNRM-ESM2-1/r1i1p1f2, CNRM-ESM2-1/r2i1p1f2, CNRM-ESM2-1/r3i1p1f2, CNRM-ESM2-1/r4i1p1f2, CNRM-ESM2-1/r5i1p1f2, FGOALS-g3/r1i1p1f1, FGOALS-g3/r2i1p1f1, FGOALS-g3/r3i1p1f1, FGOALS-g3/r4i1p1f1, FGOALS-g3/r5i1p1f1, INM-CM5-0/r1i1p1f1, INM-CM5-0/r2i1p1f1, INM-CM5-0/r3i1p1f1, INM-CM5-0/r4i1p1f1, INM-CM5-0/r5i1p1f1, MRI-ESM2-0/r1i1p1f1, MRI-ESM2-0/r2i1p1f1, MRI-ESM2-0/r3i1p1f1, MRI-ESM2-0/r4i1p1f1, MRI-ESM2-0/r5i1p1f1
Synthesis
Related diagnostics
Global Mean 2m Temperature Time Series
| Variables | avg_2t |
|---|---|
| Models | ifs-fesom, ifs-nemo, CMIP6-MMM |
| Units | K |
| Baseline | 1990-2014 |
| Future | 2040-2049 |
| Method | Global mean = spatial .mean() (HealPix equal-area). Historical and scenario concatenated. Trend fit over scenario period only. |
Summary high
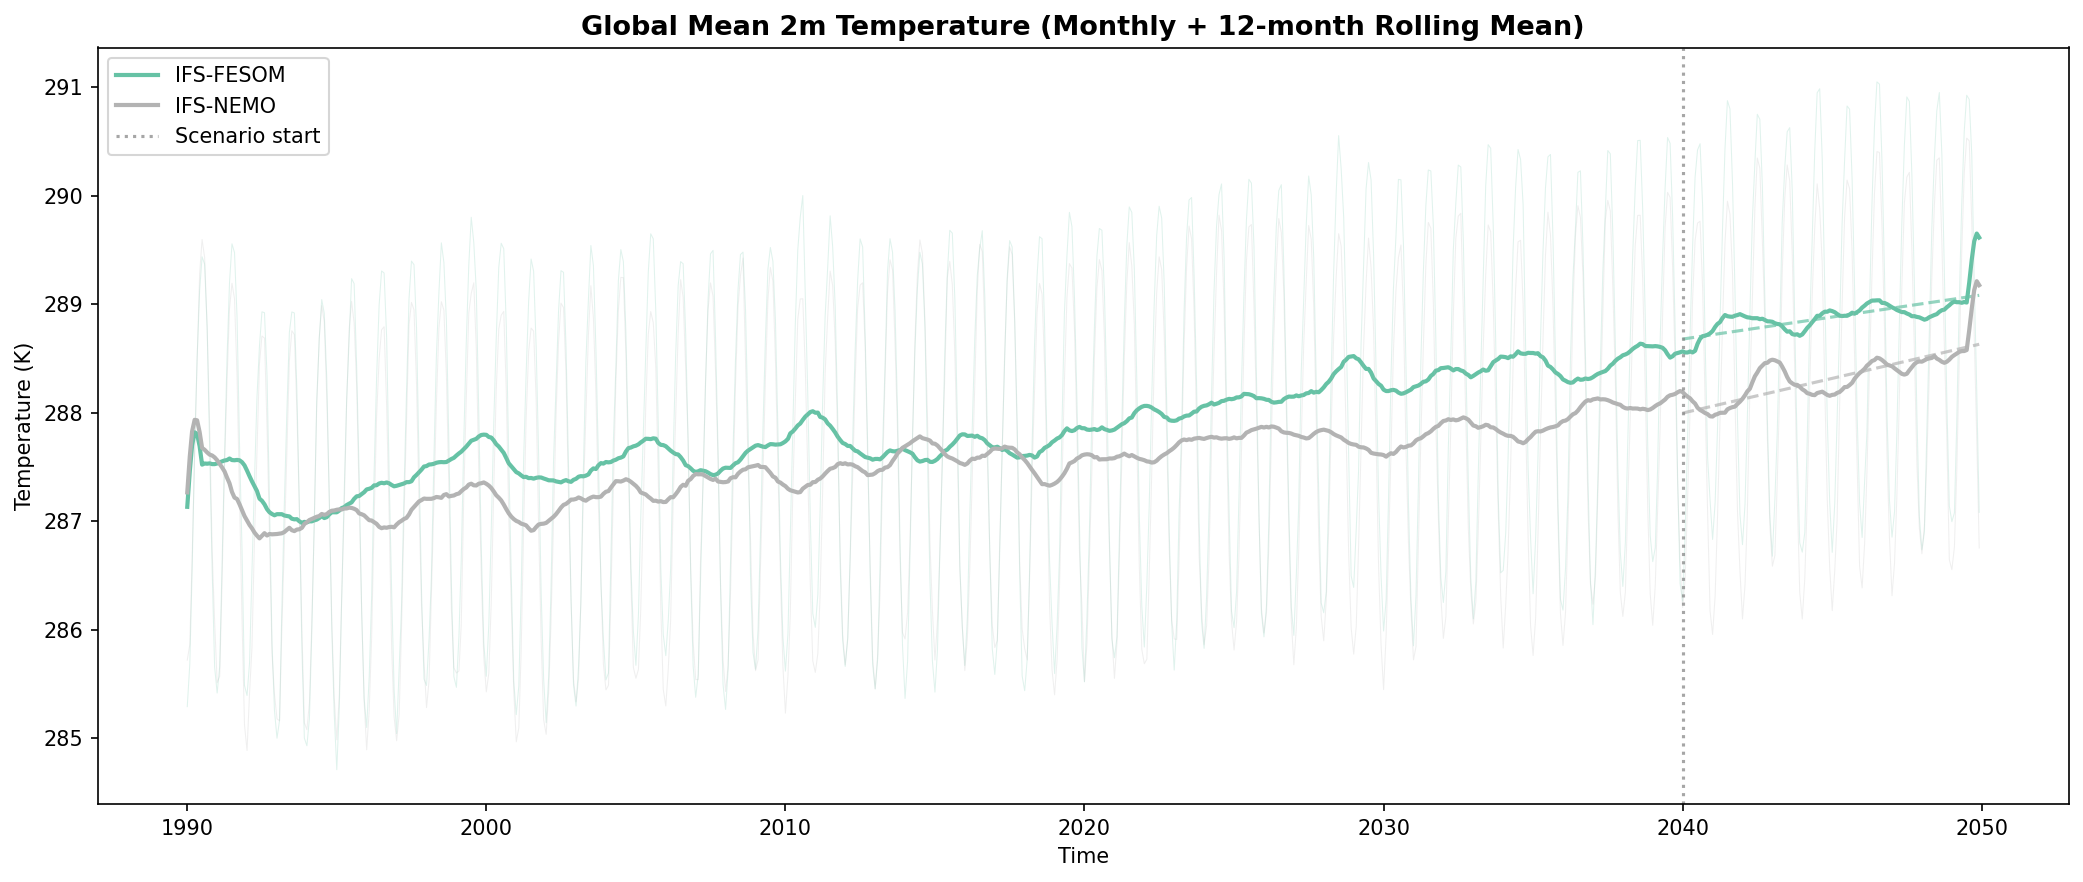
The time series shows Global Mean 2m Temperature (1990–2050) for IFS-FESOM and IFS-NEMO against the CMIP6 SSP3-7.0 envelope; both models capture the warming trend and fall well within the CMIP6 uncertainty range.
Key Findings
- IFS-FESOM is systematically warmer than IFS-NEMO by approximately 0.5–0.8 K throughout the simulation period.
- IFS-FESOM tracks slightly above the CMIP6 median (P50), while IFS-NEMO tracks consistently below the median, occupying the lower half of the CMIP6 envelope.
- Both DestinE models exhibit a warming rate consistent with the CMIP6 ensemble median under SSP3-7.0, validating their transient climate response.
- Interannual variability in both high-resolution models is realistic and comparable in magnitude to the CMIP6 range.
Spatial Patterns
N/A (Global mean time series; spatial patterns are not resolved in this figure).
Model Agreement
Both IFS-FESOM and IFS-NEMO show excellent agreement with the CMIP6 ensemble regarding the rate of warming (trend). However, there is a persistent offset in the absolute mean state, with IFS-FESOM initiating and remaining warmer than IFS-NEMO. Both remain strictly within the P5–P95 CMIP6 envelope.
Physical Interpretation
The persistent temperature offset between the two DestinE models is likely driven by differences in the ocean mean state (SSTs, sea ice extent) resulting from the different ocean cores (unstructured FESOM vs. structured NEMO) and their initialization/coupling. The shared upward trend confirms that both coupled systems are responding correctly to the increasing radiative forcing of the SSP3-7.0 scenario.
Caveats
- The vertical line labeled 'Scenario start' appears at 2040, likely marking the start of the specific 'Future period' defined in metadata rather than the standard CMIP6 scenario branch time (2015).
- The DestinE simulations cover a shorter period (~1990–2050) than the full CMIP6 range shown.
Global Mean Precipitation Rate Time Series
| Variables | avg_tprate |
|---|---|
| Models | ifs-fesom, ifs-nemo, CMIP6-MMM |
| Units | kg/m2/s |
| Baseline | 1990-2014 |
| Future | 2040-2049 |
| Method | Global mean = spatial .mean() (HealPix equal-area). Historical and scenario concatenated. Trend fit over scenario period only. |
Summary high
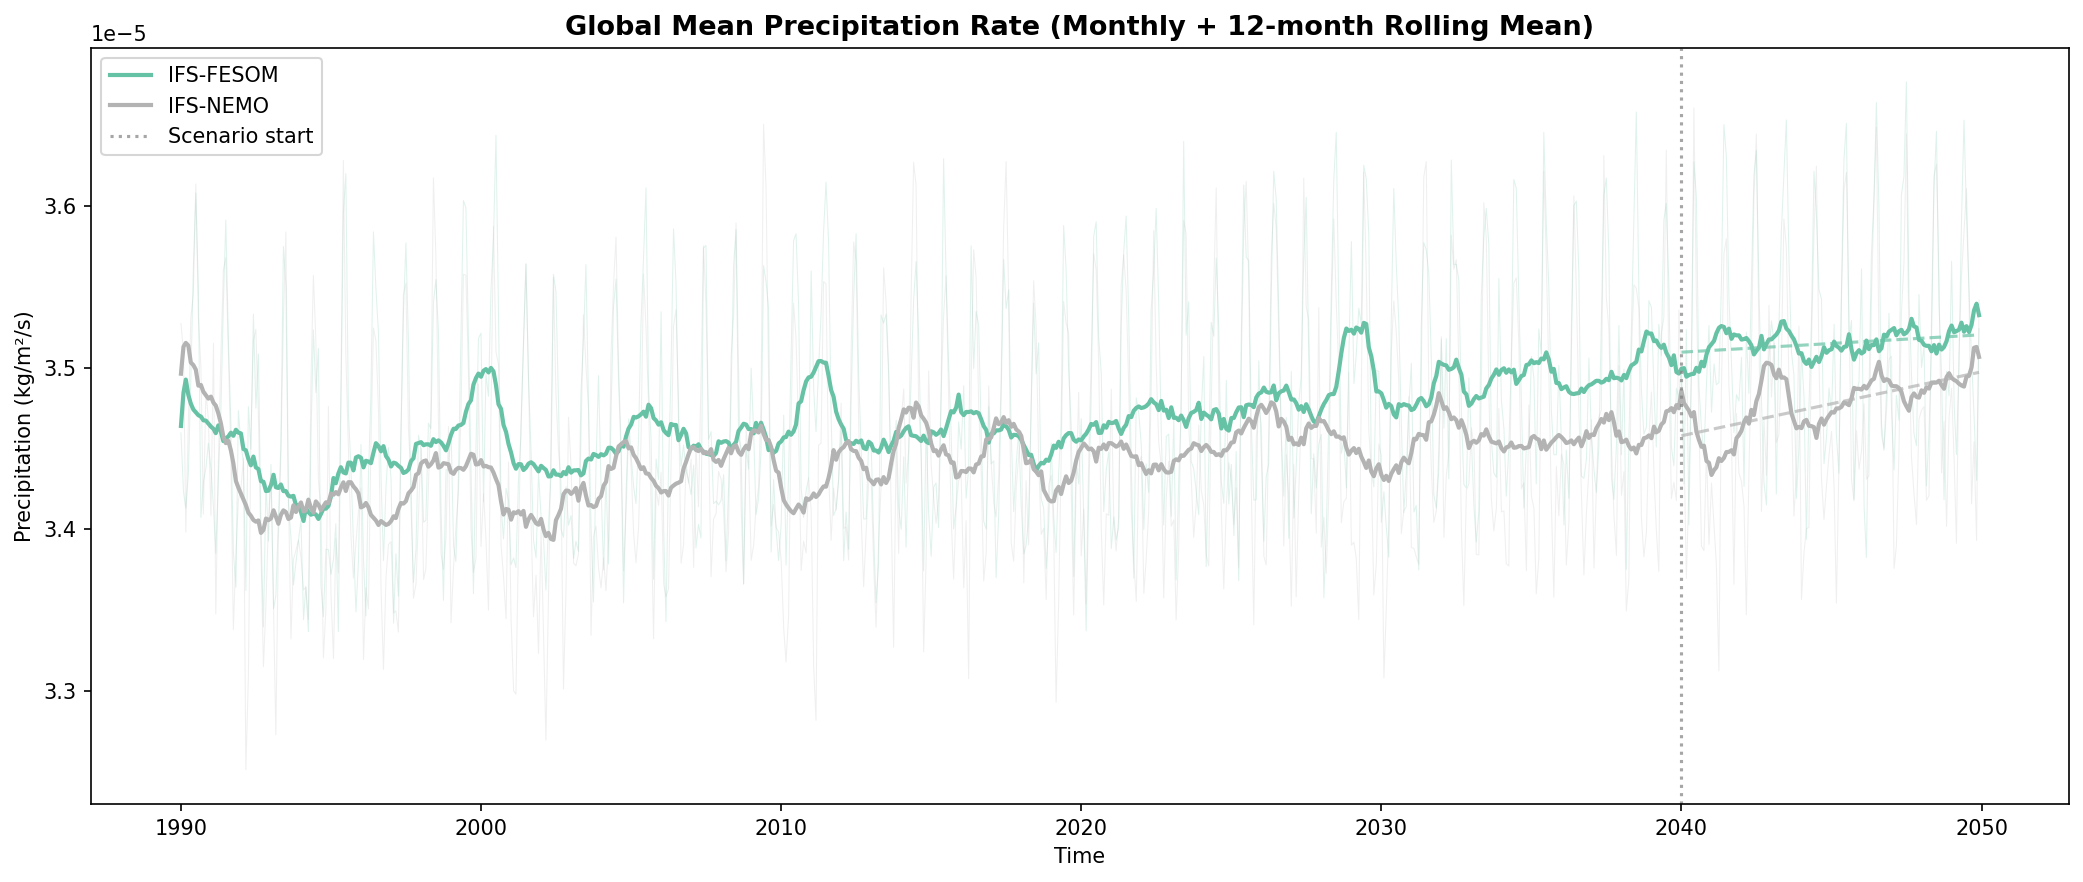
Time series analysis of global mean precipitation rates (1990–2050) for IFS-FESOM and IFS-NEMO compared against the CMIP6 SSP3-7.0 ensemble envelope (1850–2100).
Key Findings
- Both IFS-FESOM and IFS-NEMO fall well within the CMIP6 P5–P95 envelope, indicating their global mean precipitation climatology is consistent with the broader multi-model ensemble.
- The DestinE models track slightly above the CMIP6 median (P50), showing a wet bias of approximately 1-2% relative to the median but remaining far from the upper P95 bound.
- Both high-resolution models exhibit a steady increasing trend in global precipitation from ~2000 onwards, paralleling the gradient of the CMIP6 median response to warming.
Spatial Patterns
Not applicable (figure presents a 1-dimensional global mean time series rather than spatial fields).
Model Agreement
High agreement with CMIP6 expectations. The DestinE models are centrally located within the CMIP6 distribution, suggesting no outliers in global hydrological sensitivity or mean state. IFS-FESOM and IFS-NEMO track each other very closely after an initial adjustment period.
Physical Interpretation
The positive trend in precipitation is a robust response to global warming, driven by the Clausius-Clapeyron relation where specific humidity increases with temperature, intensifying the hydrological cycle. The slightly higher mean precipitation in DestinE compared to the CMIP6 median may reflect improved resolution of precipitation-generating processes (e.g., orographic uplift, resolved convection) that are parameterized in coarser models.
Caveats
- IFS-NEMO shows a visible initialization shock or adjustment period around 1990 before stabilizing.
- The analysis window for DestinE (ending ~2050) is shorter than the full CMIP6 projection.
TOA Radiative Imbalance Time Series
| Variables | avg_tnswrf, avg_tnlwrf |
|---|---|
| Models | ifs-fesom, ifs-nemo, CMIP6-MMM |
| Units | W/m2 |
| Baseline | 1990-2014 |
| Future | 2040-2049 |
| Method | DestinE: avg_tnswrf + avg_tnlwrf (net fluxes). CMIP6: rsdt - rsut - rlut (incoming - outgoing). Global mean at each timestep. |
Summary high
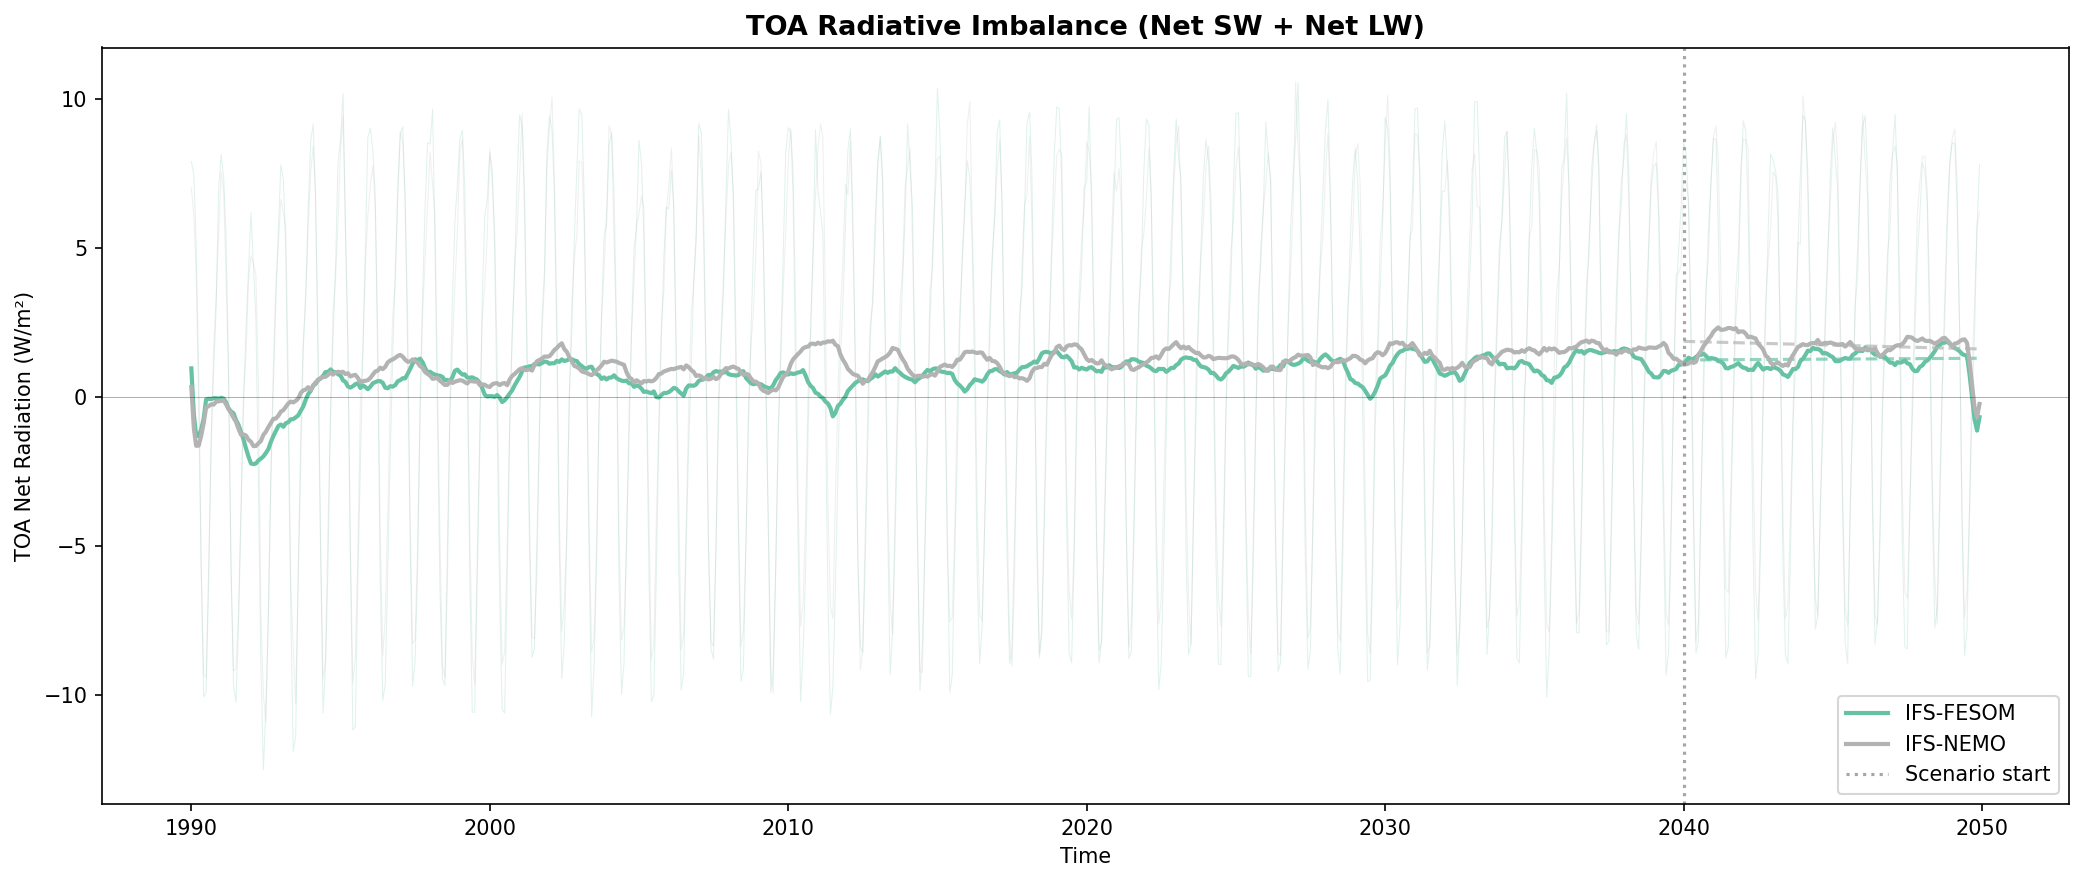
This time series analysis compares the global mean Top-of-Atmosphere (TOA) radiative imbalance of two DestinE models (IFS-FESOM and IFS-NEMO) against the CMIP6 historical and SSP3-7.0 ensemble envelope from 1990 to 2050.
Key Findings
- Both IFS-FESOM and IFS-NEMO show excellent agreement with the CMIP6 ensemble median (P50), tracking the multi-model mean closely throughout the simulation period.
- The models exhibit a persistent positive radiative imbalance of approximately 1.0–2.0 W/m² between 2020 and 2050, consistent with the planetary heating expected under the SSP3-7.0 scenario.
- A distinct negative excursion is visible at the beginning of the DestinE simulations (~1991), aligning with the radiative forcing reduction caused by the Mt. Pinatubo eruption.
- High-frequency seasonal oscillations (amplitude ~10 W/m²) are visible in the raw DestinE data, driven by the eccentricity of Earth's orbit (varying solar insolation), while the smoothed trend represents the climate response.
Spatial Patterns
Not applicable (global mean time series). The temporal pattern shows a recovery from the 1991 volcanic dip followed by a steady, slightly increasing positive energy imbalance indicative of continuous greenhouse gas forcing.
Model Agreement
There is high agreement between the two DestinE models (which overlap almost perfectly) and the CMIP6 median. Both DestinE simulations fall well within the CMIP6 P5–P95 envelope, suggesting no anomalous global energy drift or outlier behaviour.
Physical Interpretation
The positive TOA imbalance confirms the models are accumulating heat due to the enhanced greenhouse effect (reduced outgoing longwave radiation relative to absorbed shortwave). The 1991 dip demonstrates the models' response to volcanic stratospheric aerosols (increased reflection of shortwave radiation).
Caveats
- The simulation start date (1990) coincides with the Pinatubo eruption, making it difficult to completely disentangle potential initialization shock from the physical volcanic response, although the recovery tracks CMIP6 well.
- The faint vertical lines represent raw monthly data showing the orbital seasonal cycle, which dominates the visual variability compared to the interannual trend.