Tier 3 Temperature–Precipitation Scatter CMIP6
CMIP6 Multi-Model Mean Context
Comparison with CMIP6 conventional-resolution ensemble mean (up to 8 models under SSP3-7.0, regridded to 0.25°).
Contributing models: MPI-ESM1-2-LR, GISS-E2-1-G, IPSL-CM6A-LR, ACCESS-ESM1-5, EC-Earth3, CNRM-CM6-1, AWI-CM-1-1-MR, CNRM-ESM2-1, FGOALS-g3, INM-CM5-0, MRI-ESM2-0
Synthesis
Related diagnostics
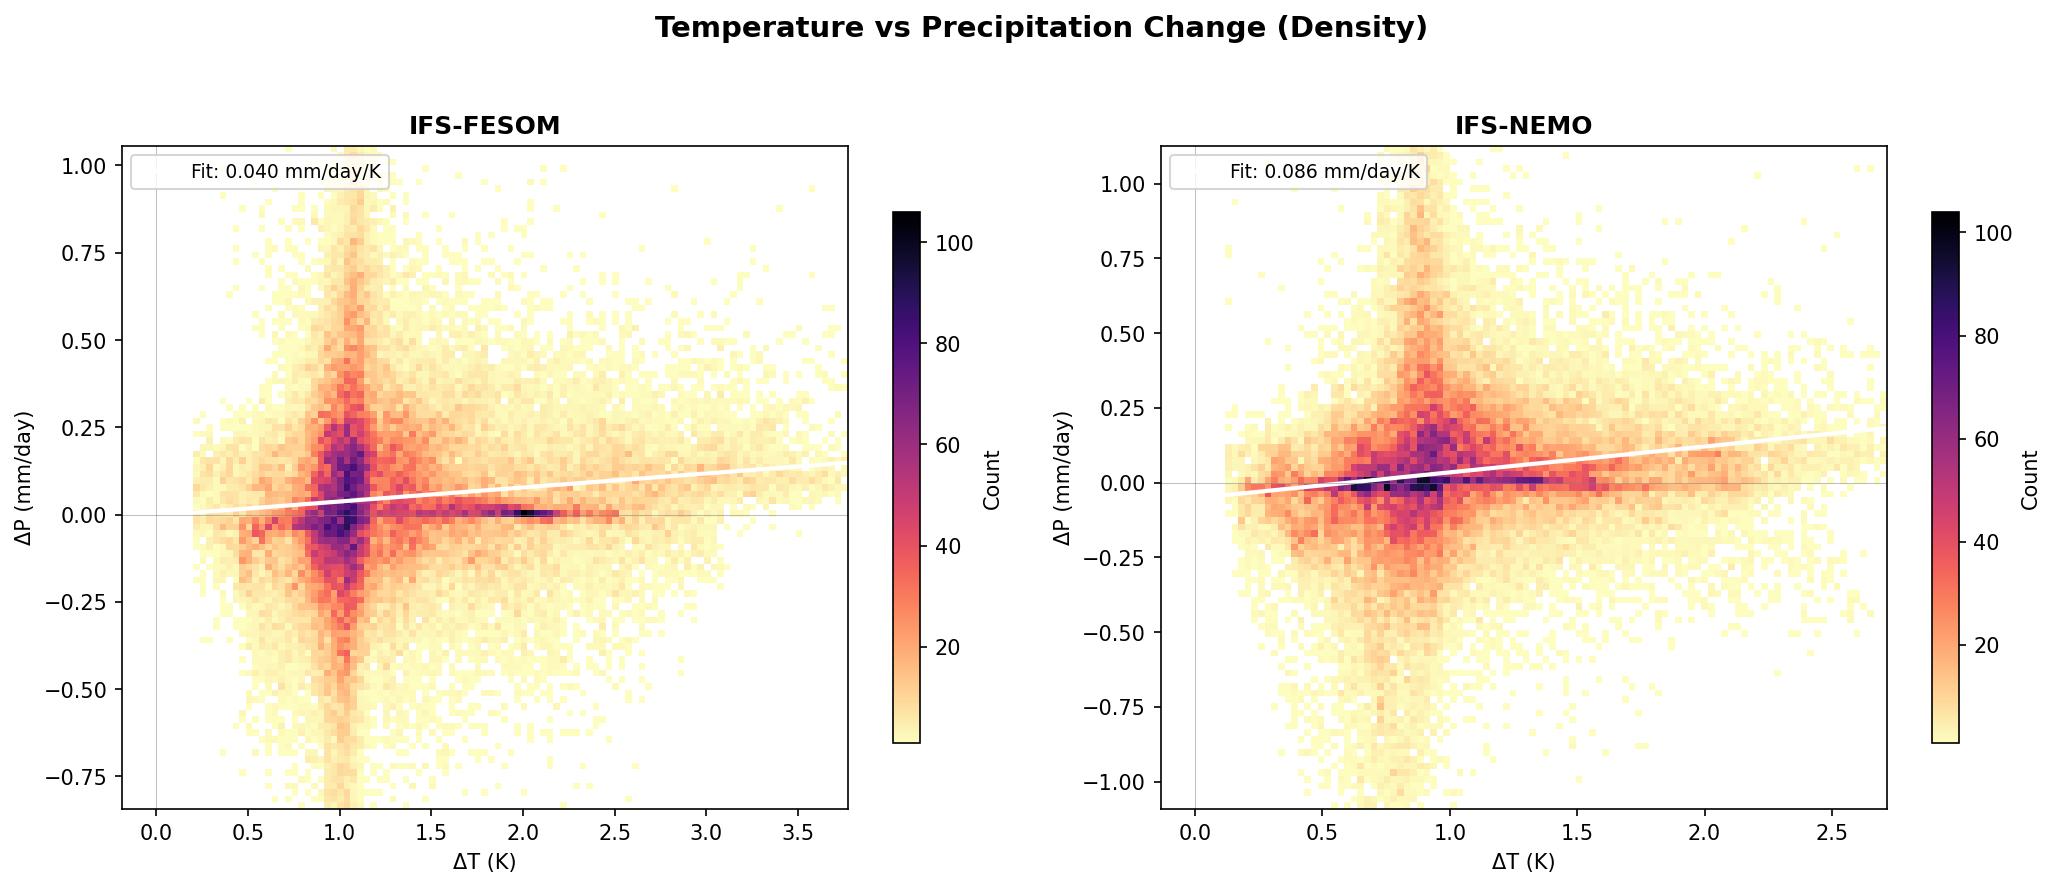
Temperature–Precipitation Density
| Variables | avg_2t, avg_tprate |
|---|---|
| Models | ifs-fesom, ifs-nemo |
| Units | K |
| Baseline | 1990-2014 |
| Future | 2040-2049 |
| Method | 100×100 bin 2D histogram with 1st–99th percentile range. |
Summary high
This diagnostic compares the joint density distribution of temperature (ΔT) and precipitation (ΔP) changes for IFS-FESOM and IFS-NEMO against a CMIP6 reference. While both models show similar warming distributions, IFS-NEMO exhibits a significantly higher hydrological sensitivity than IFS-FESOM.
Key Findings
- IFS-FESOM displays a hydrological sensitivity (slope of ΔP/ΔT) of 0.040 mm/day/K, which aligns almost perfectly with the CMIP6 median value of 0.039 mm/day/K.
- IFS-NEMO shows a much stronger hydrological response with a fitted slope of 0.086 mm/day/K, more than double that of IFS-FESOM and the CMIP6 median.
- Both models show the highest density of grid cells (darkest colors) clustered around a warming of 0.8 K to 1.2 K for the 2040–2049 period, indicating similar global mean surface temperature responses.
Spatial Patterns
The plots are density histograms rather than maps. They reveal a 'cross' pattern where the highest density of grid points lies near ΔT ≈ 1.0 K and ΔP ≈ 0 mm/day. While the central mass is similar, IFS-NEMO shows a broader spread of positive precipitation anomalies at higher warming levels (ΔT > 1.5 K), pulling the regression line upwards compared to IFS-FESOM.
Model Agreement
IFS-FESOM shows excellent agreement with the CMIP6 ensemble median regarding the global scaling of precipitation with warming. In contrast, IFS-NEMO diverges significantly, suggesting a more aggressive acceleration of the hydrological cycle compared to the standard CMIP6 response.
Physical Interpretation
The stark difference in slopes (hydrological sensitivity) despite similar atmospheric physics (IFS) suggests that the ocean coupling (NEMO vs FESOM) strongly influences global evaporation rates or the spatial pattern of SST warming. IFS-NEMO's slope (~3% per K if assuming global mean P ≈ 2.9 mm/day) is closer to the theoretical energetic constraint for precipitation increase, whereas IFS-FESOM (~1.4% per K) is more damped, possibly due to different ocean heat uptake or surface flux parametrizations.
Caveats
- The linear fit aggregates distinct physical regimes (e.g., wet-get-wetter vs. dry-get-drier), masking regional heterogeneity.
- The analysis relies on a single future decade (2040s), so internal variability may still influence the calculated slopes compared to long-term equilibrium sensitivity.
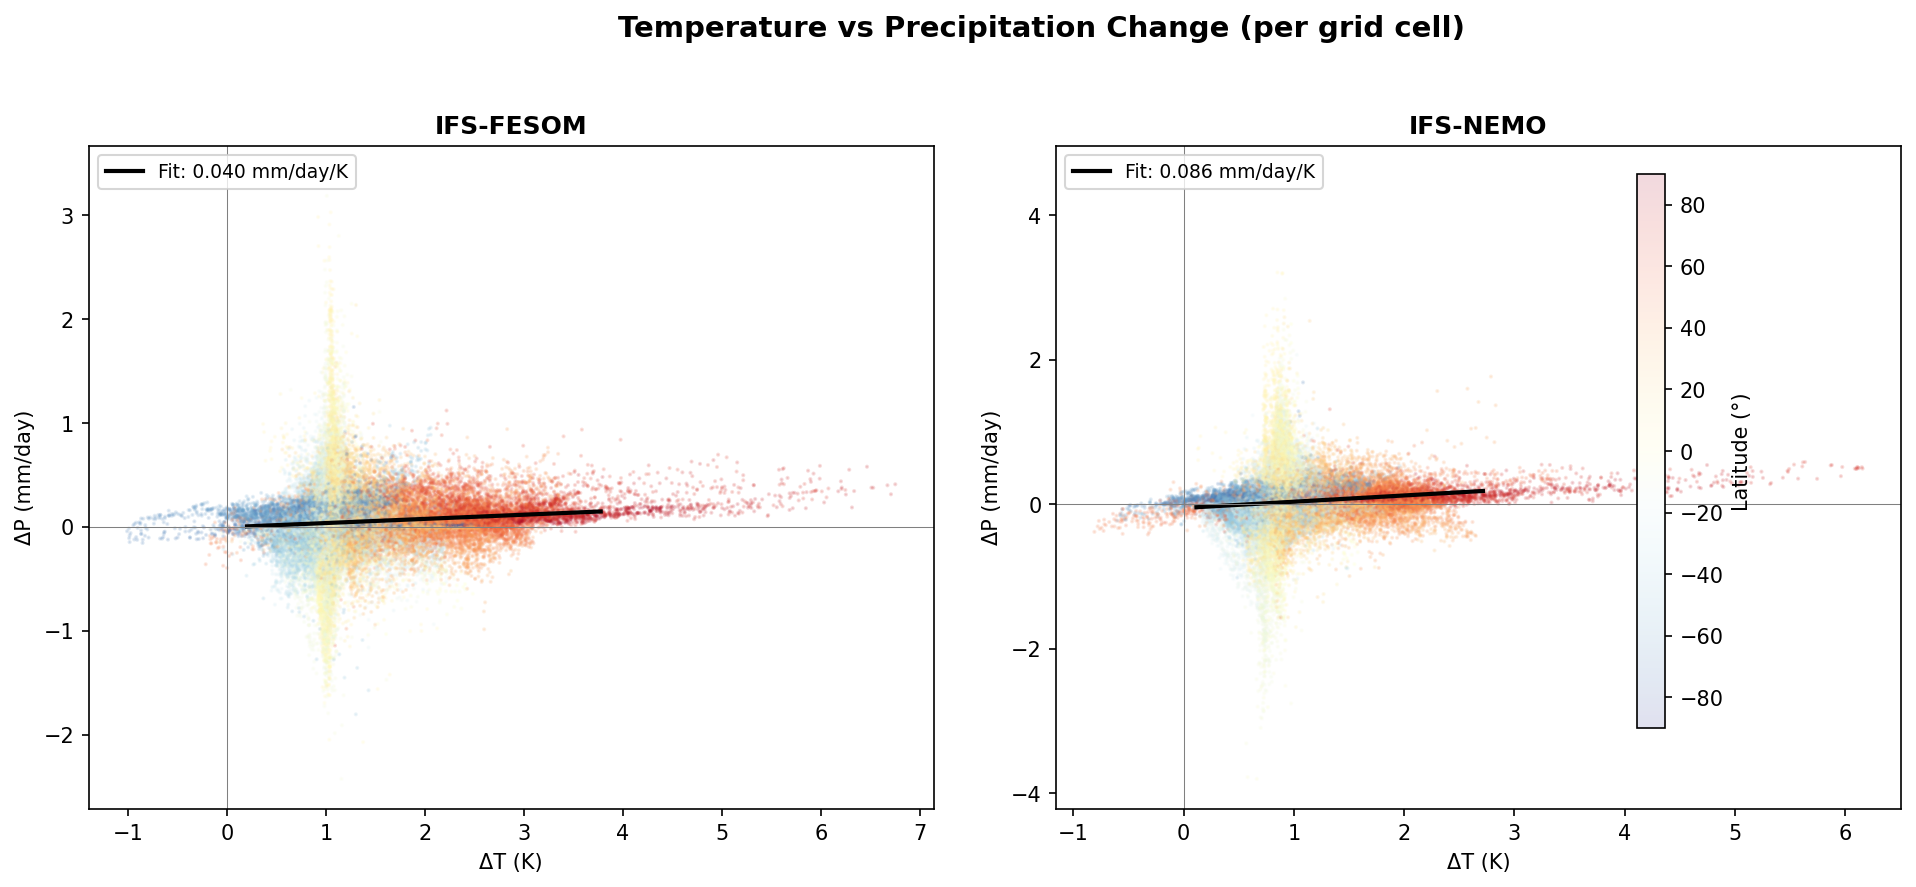
Temperature–Precipitation Scatter
| Variables | avg_2t, avg_tprate |
|---|---|
| Models | ifs-fesom, ifs-nemo |
| Units | K |
| Baseline | 1990-2014 |
| Future | 2040-2049 |
| Method | ΔP converted to mm/day (×86400 from kg/m²/s). Sub-sampled to 50k cells per model. |
Summary high
This scatter analysis compares local hydrological sensitivity (precipitation change vs. temperature change) for IFS-FESOM and IFS-NEMO against the CMIP6 ensemble. While IFS-FESOM exhibits a precipitation response nearly identical to the CMIP6 median, IFS-NEMO displays a significantly stronger hydrological sensitivity that exceeds the typical CMIP6 range.
Key Findings
- IFS-FESOM shows a local hydrological sensitivity slope of 0.040 mm/day/K, effectively matching the CMIP6 median of 0.039 mm/day/K.
- IFS-NEMO shows a remarkably steep sensitivity slope of 0.086 mm/day/K, which is more than double the CMIP6 median and lies well outside the CMIP6 interquartile range (0.026–0.060 mm/day/K).
- High northern latitudes (red points) consistently exhibit the strongest warming (>2.5 K) and positive precipitation changes, reflecting polar amplification and thermodynamic wetting.
- Tropical regions (yellow points) show the highest variance in precipitation response, with significant wetting and drying occuring at similar warming levels (~1.0–1.5 K).
Spatial Patterns
The data is clearly stratified by latitude: High northern latitudes (red) cluster at the high-warming/wetting tail (thermodynamic dominance). The tropics (yellow) cluster in the mid-warming range with massive vertical spread in precipitation change, indicating dynamic drivers (ITCZ shifts) dominate over simple thermodynamic scaling. The Southern Hemisphere (blue) shows the lowest warming and moderate wetting.
Model Agreement
IFS-FESOM demonstrates excellent agreement with the CMIP6 ensemble mean behavior. In contrast, IFS-NEMO is an outlier with respect to the coupling between local warming and precipitation increase, showing a much stronger 'wet-get-wetter' signal or global hydrological intensification than the CMIP6 standard.
Physical Interpretation
The general positive correlation is driven by the Clausius-Clapeyron relationship (warmer atmosphere holds more water vapor). The high scatter in the tropics reflects circulation changes (dynamic contributions) which can locally oppose thermodynamic wetting. The anomalously high slope in IFS-NEMO suggests a structural difference in the model configuration—potentially related to air-sea flux parameterizations or ocean surface coupling—that results in a hyper-active hydrological cycle response to warming.
Caveats
- The linear regression aggregates all grid cells, masking regional heterogeneity where the slope might differ (e.g., land vs. ocean).
- The analysis covers a relatively short future period (2040-2049), meaning internal variability (e.g., ENSO phases) strongly influences the scatter, particularly in the tropics.