Tier 2 Inter-model Agreement CMIP6 f_out 10.2%
CMIP6 Envelope Comparison
DestinE anomalies compared to the CMIP6 P5–P95 percentile envelope derived from 51 ensemble members across 11 models under SSP3-7.0.
Contributing models: AWI-CM-1-1-MR, CESM2, CNRM-CM6-1, EC-Earth3, MIROC6, MPI-ESM1-2-LR, UKESM1-0-LL
Outside CMIP6 does not mean wrong — it indicates an uncommon response within the CMIP6 distribution.
Synthesis
Related diagnostics
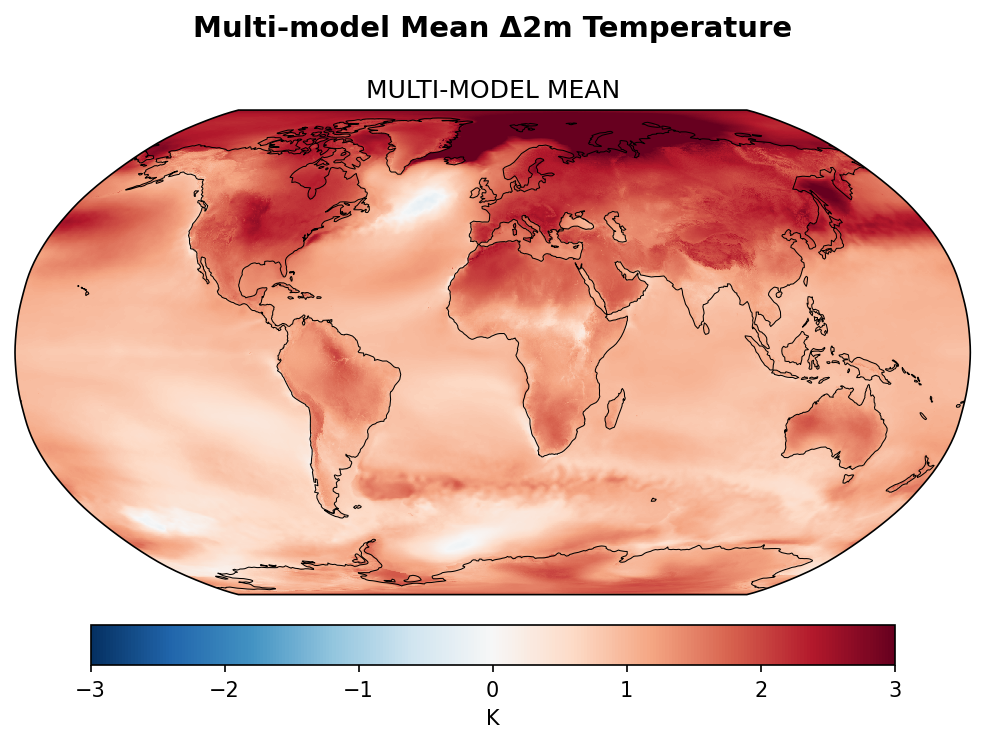
Multi-model Mean 2m Temperature Change
| Variables | avg_2t |
|---|---|
| Models | ifs-fesom, ifs-nemo |
| Units | K |
| Baseline | 1990-2014 |
| Future | 2040-2049 |
| Method | Arithmetic mean of per-model (future − historical) differences. |
Summary high
This figure compares the projected 2m temperature change (2040–2049 vs 1990–2014) between the high-resolution DestinE mean (IFS-FESOM and IFS-NEMO) and the CMIP6 multi-model mean under SSP3-7.0.
Key Findings
- Both ensembles exhibit robust global warming patterns, characterized by strong Arctic amplification and pronounced land-sea warming contrast.
- The DestinE mean displays a striking 'warming hole' (absolute cooling) in the subpolar North Atlantic, which is much more intense and clearly defined than the reduced warming signal seen in the CMIP6-MMM.
- High-resolution topographic features influence local warming rates in the DestinE models, particularly visible over the Andes, Himalayas, and Rockies, where patterns follow the terrain more closely than in the smoother CMIP6 mean.
Spatial Patterns
Arctic amplification is the dominant signal in both panels, with warming exceeding 4 K in the Barents-Kara sector. The DestinE models show a distinct blue cooling patch in the North Atlantic south of Greenland, contrasted by strong warming in the Nordic Seas. The Southern Ocean in DestinE shows complex zonal structures with localized cooling near the Antarctic coast, whereas CMIP6 presents a more uniform warming gradient.
Model Agreement
There is strong agreement on the broad-scale thermodynamic response to forcing (general warming magnitude, polar amplification). The primary disagreement lies in the North Atlantic, where DestinE suggests a dynamic cooling response not captured to the same extent by the CMIP6 ensemble mean, and in the granularity of continental warming patterns.
Physical Interpretation
The pronounced North Atlantic cooling in DestinE is consistent with a slowdown of the Atlantic Meridional Overturning Circulation (AMOC), a feature often better resolved or more sensitive in high-resolution eddy-permitting models. The intense Arctic warming is driven by sea-ice albedo feedback. Topographic impacts on warming likely stem from resolved lapse-rate feedbacks and snow-albedo changes in mountain regions.
Caveats
- The DestinE mean comprises only two models, making it more susceptible to internal variability (e.g., AMOC phasing) than the 7-model CMIP6 mean.
- The 'cooling' in the North Atlantic might be exaggerated by decadal variability given the relatively short projection horizon (2040s).
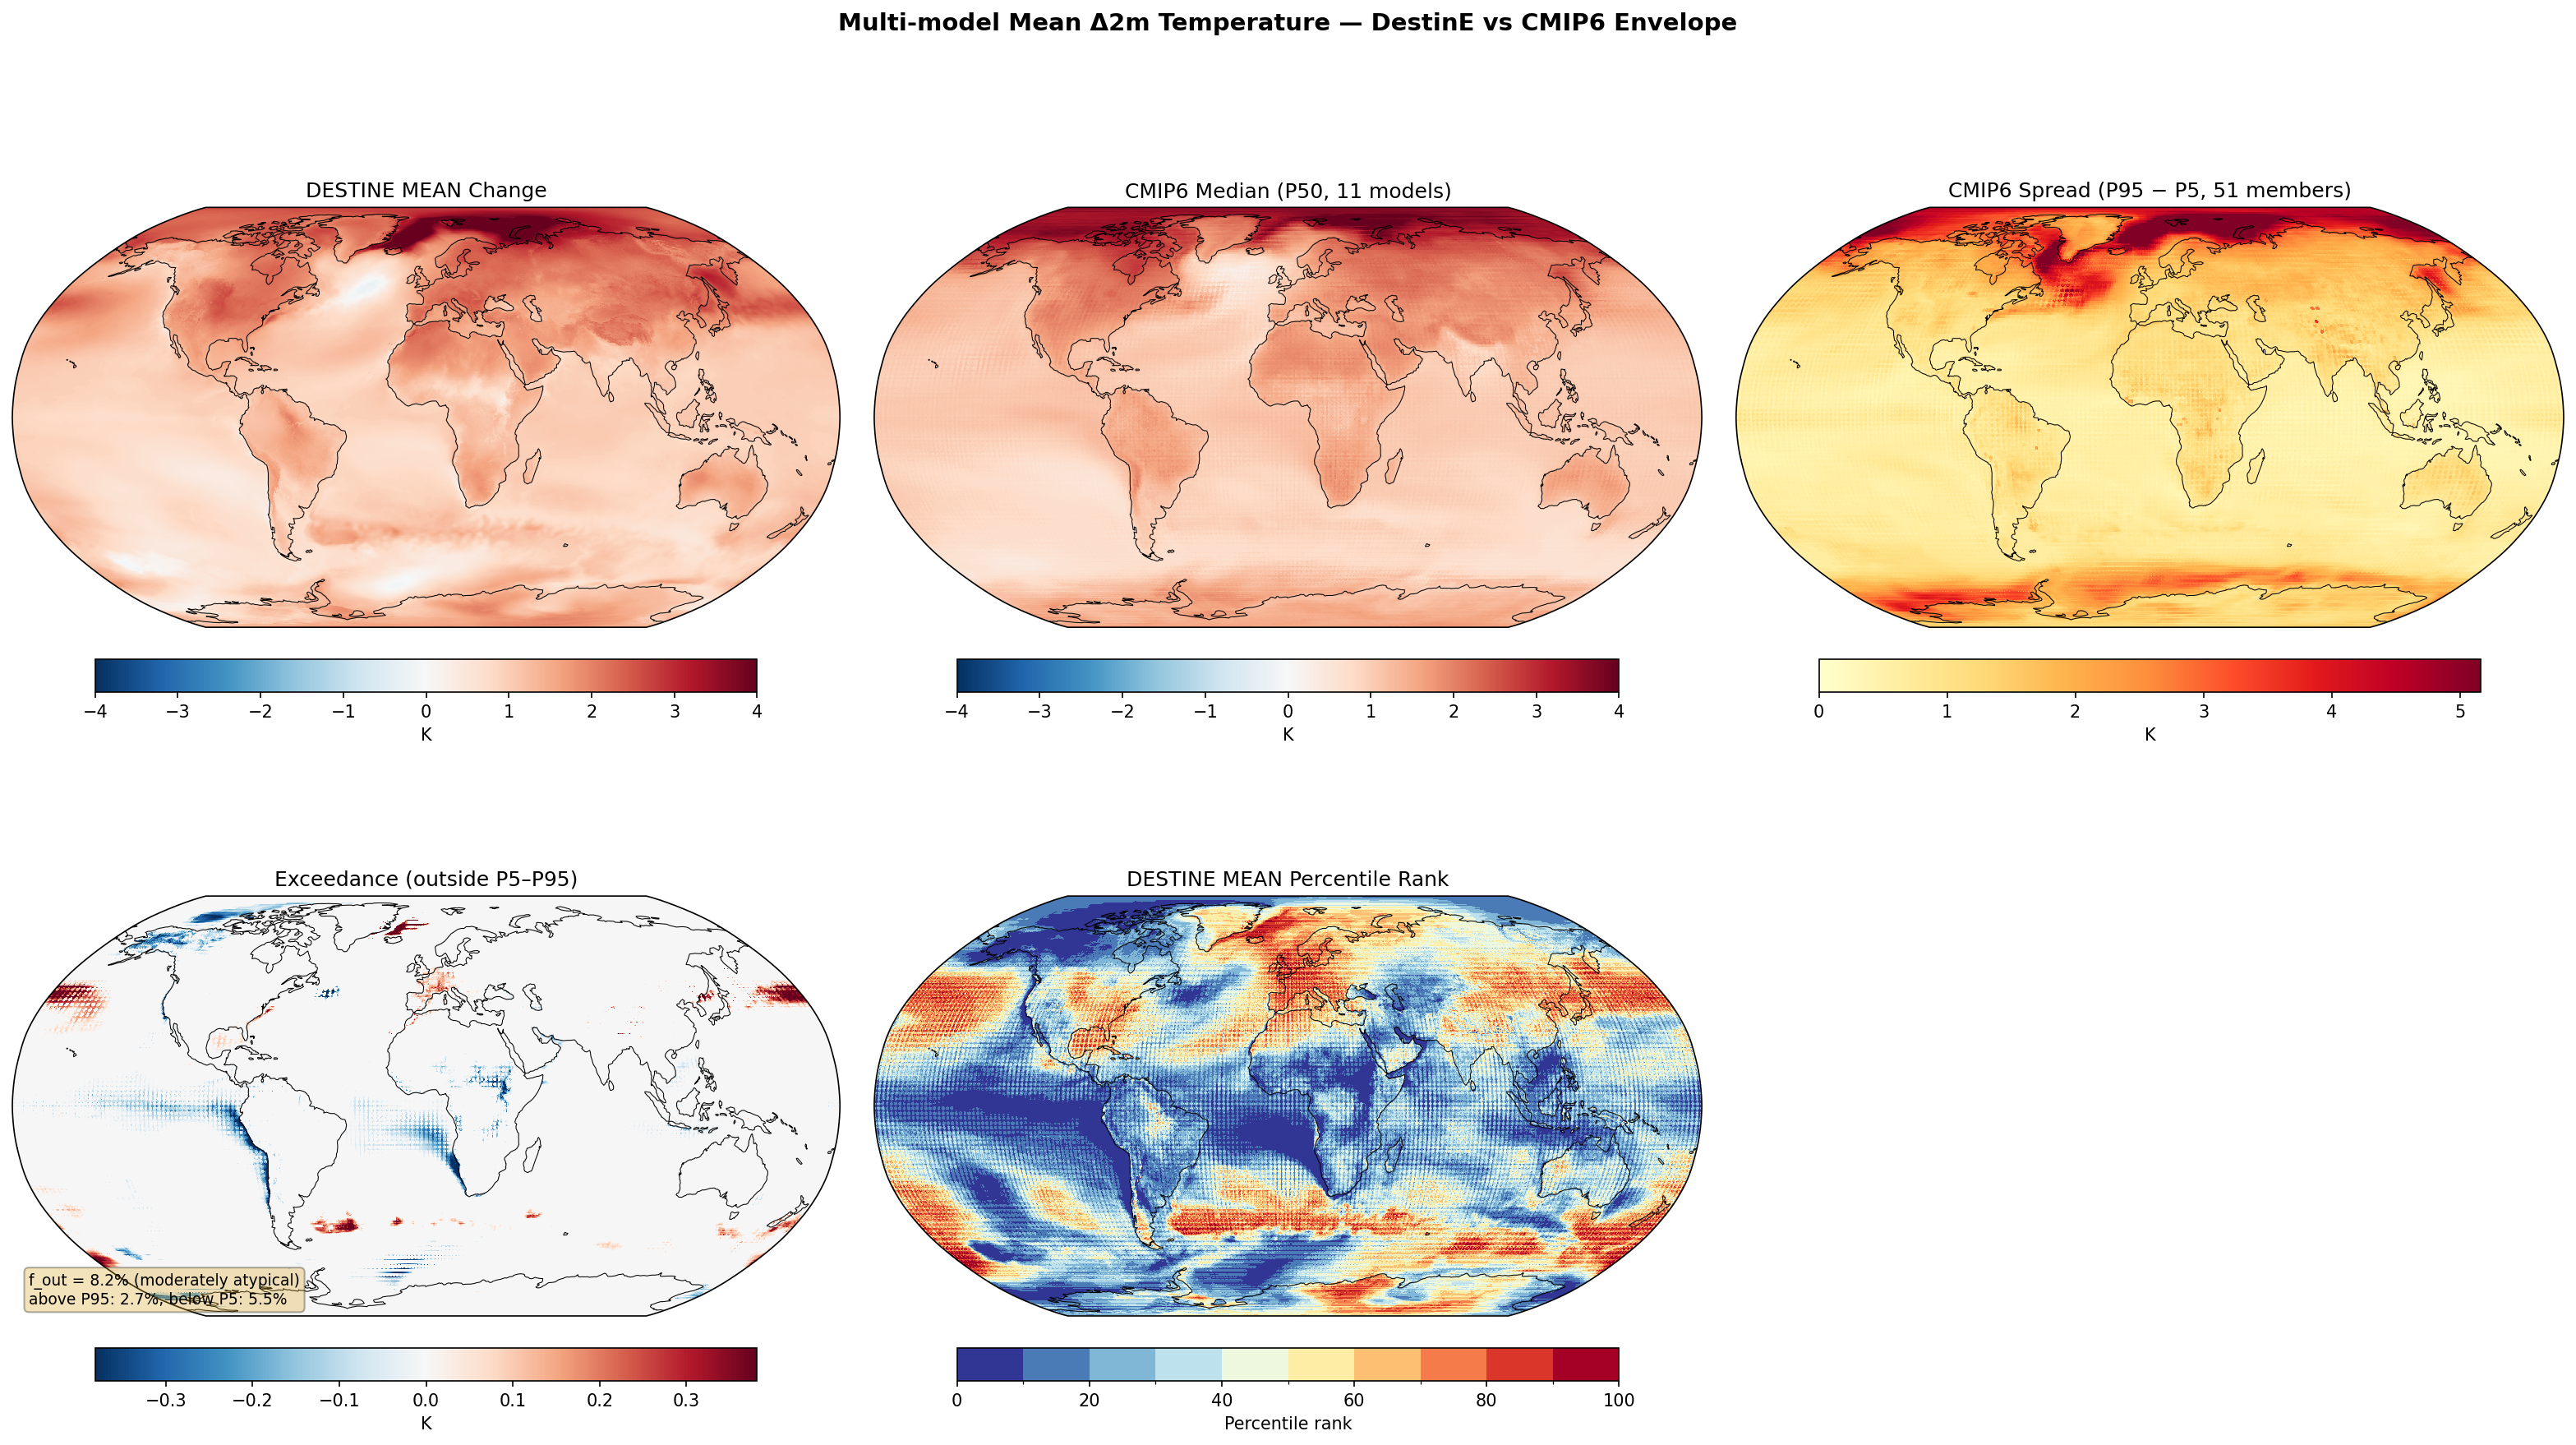
Multi-model Mean 2m Temperature Change — DestinE vs CMIP6 Envelope f_out 8.2%
Envelope Metrics
| f_out (outside P5–P95) | 8.2% moderately atypical |
|---|---|
| Above P95 | 2.7% |
| Below P5 | 5.5% |
| CMIP6 ensemble | 11 models, 51 members |
| Variables | avg_2t |
|---|---|
| Models | ifs-fesom, ifs-nemo |
| Units | K |
| Baseline | 1990-2014 |
| Future | 2040-2049 |
| Method | DestinE multi-model mean of per-model (future − historical) differences compared to CMIP6 percentile envelope (P5, P50, P95). |
Summary high
The DestinE multi-model mean (IFS-NEMO and IFS-FESOM) exhibits a moderately atypical warming pattern (f_out = 8.2%) compared to CMIP6, characterized primarily by weaker warming over the oceans and a significantly enhanced North Atlantic warming hole.
Key Findings
- DestinE projects significantly weaker warming (or stronger cooling) in the North Atlantic subpolar gyre compared to the CMIP6 ensemble, falling below the 5th percentile.
- Global ocean warming in DestinE is generally lower than the CMIP6 median (percentile ranks mostly 10-40), whereas warming over Northern Hemisphere land masses is closer to or above the CMIP6 median (percentile ranks 50-80).
- Specific exceedance (below P5) is observed in the eastern tropical Atlantic and Pacific, potentially corresponding to eastern boundary upwelling systems.
- The total area outside the CMIP6 envelope is 8.2%, classified as 'moderately atypical', with the majority of deviations (5.5%) being on the cooler side (below P5).
Spatial Patterns
The most prominent spatial feature is the deep blue region in the North Atlantic (south of Greenland) in the Exceedance panel, indicating a 'warming hole' much stronger than typical CMIP6 models. Tropical oceans show widespread lower percentile ranks (blue hues), indicating weaker warming. Conversely, parts of Europe and North America show redder hues in percentile rank, indicating warming levels in the upper half of the CMIP6 distribution. Strong Arctic amplification is present but generally lies within the broad CMIP6 spread.
Model Agreement
DestinE agrees with the CMIP6 envelope over 91.8% of the globe. The primary disagreement is in the North Atlantic and parts of the tropical oceans where DestinE warms less than the CMIP6 P5 threshold. The agreement is strongest over the Southern Hemisphere subtropics and parts of the continental tropics where DestinE tracks the CMIP6 median.
Physical Interpretation
The enhanced North Atlantic warming hole suggests that the high-resolution eddy-resolving/permitting ocean models (NEMO/FESOM) may simulate a different response of the Atlantic Meridional Overturning Circulation (AMOC) or more distinct shifts in the North Atlantic Current compared to coarser CMIP6 models. The generally lower sea surface warming and enhanced land-sea contrast might result from more efficient ocean heat uptake (due to resolved eddies mixing heat downward) or differences in cloud feedbacks and aerosol forcing within the IFS physics package compared to the CMIP6 multi-model mean.
Caveats
- The analysis compares a 2-model DestinE mean against a 51-member CMIP6 ensemble; limited DestinE sampling may emphasize structural biases of the IFS.
- The timeframe (2040-2049) is near-term, meaning internal climate variability could still contribute significantly to the observed differences in regional patterns.
- Cooler tropical oceans could partly stem from initialization differences or drift, though the pattern is consistent with stronger ocean heat uptake.
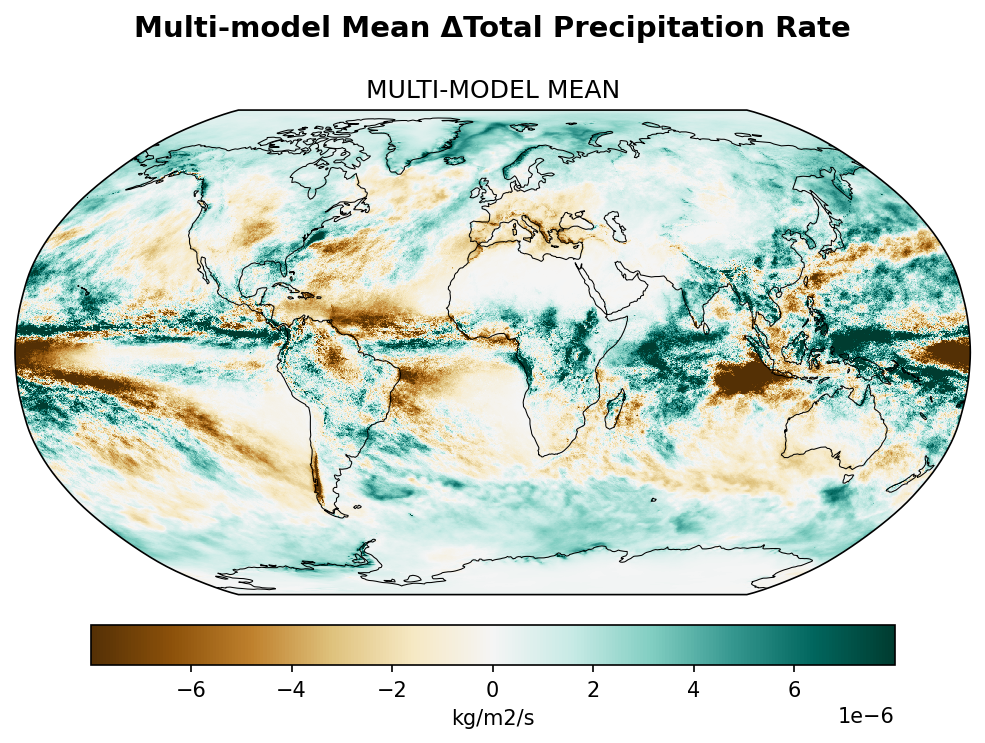
Multi-model Mean Total Precipitation Rate Change
| Variables | avg_tprate |
|---|---|
| Models | ifs-fesom, ifs-nemo |
| Units | kg/m2/s |
| Baseline | 1990-2014 |
| Future | 2040-2049 |
| Method | Arithmetic mean of per-model (future − historical) differences. |
Summary medium
This figure contrasts the projected change in Total Precipitation Rate (2040–2049 vs 1990–2014) between the high-resolution DestinE ensemble (IFS-FESOM, IFS-NEMO) and the CMIP6 multi-model mean, revealing significantly sharper spatial structures and stronger local amplitudes in the high-resolution models.
Key Findings
- DestinE models show much finer spatial detail and stronger local change amplitudes compared to the smoothed CMIP6 mean, particularly in the tropics.
- A major disagreement exists in the Equatorial Pacific: DestinE displays a sharp, narrow band of drying along the equator, whereas CMIP6 predicts broad wetting.
- DestinE captures detailed orographic precipitation signals (e.g., wetting/drying dipoles over the Andes, Himalayas, and New Zealand) resolved by the ~5 km grid but absent in CMIP6.
- Both datasets agree on the broad thermodynamic signal of wetting in high latitudes and drying over the Amazon, though DestinE simulates more intense drying in the Amazon basin.
Spatial Patterns
The DestinE mean is characterized by highly granular features, including a distinct double-ITCZ-like structure or sharp narrowing of the rain belt in the Pacific. It shows intense wetting signals in the Indian Ocean and distinct drying bands in the subtropical Pacific. Orographic signatures are prominent along mountain ranges. The CMIP6 panel shows similar large-scale zonal patterns (high-latitude wetting, subtropical drying) but lacks the mesoscale definition and shows a merged, broad equatorial wetting signal.
Model Agreement
There is broad qualitative agreement on large-scale thermodynamic responses: wetting in the Arctic, Antarctic, and Northern Hemisphere storm tracks, and drying in the Mediterranean and Amazon. However, there is significant disagreement in the tropical dynamical response, specifically the sign of change on the Pacific equator. This divergence may stem from the specific convective parameterization in IFS or the high resolution resolving distinct ITCZ dynamics compared to coarser CMIP6 models.
Physical Interpretation
High-latitude wetting is consistent with Clausius-Clapeyron scaling (warmer air holding more moisture). The complex tropical patterns in DestinE likely reflect dynamical shifts in the Walker and Hadley circulations. The specific equatorial drying in DestinE, contrasted with CMIP6 wetting, suggests a strengthening of the trade winds or a 'La Niña-like' response pattern, possibly influenced by the specific phasing of internal variability (e.g., IPO/ENSO) within the short 10-year analysis window.
Caveats
- The 10-year duration (2040-2049) is short for precipitation analysis; the DestinE signal likely contains significant unforced internal variability (noise) compared to the CMIP6 MMM.
- The sharp equatorial signals in DestinE may be specific to the IFS model physics rather than a universal high-resolution result.
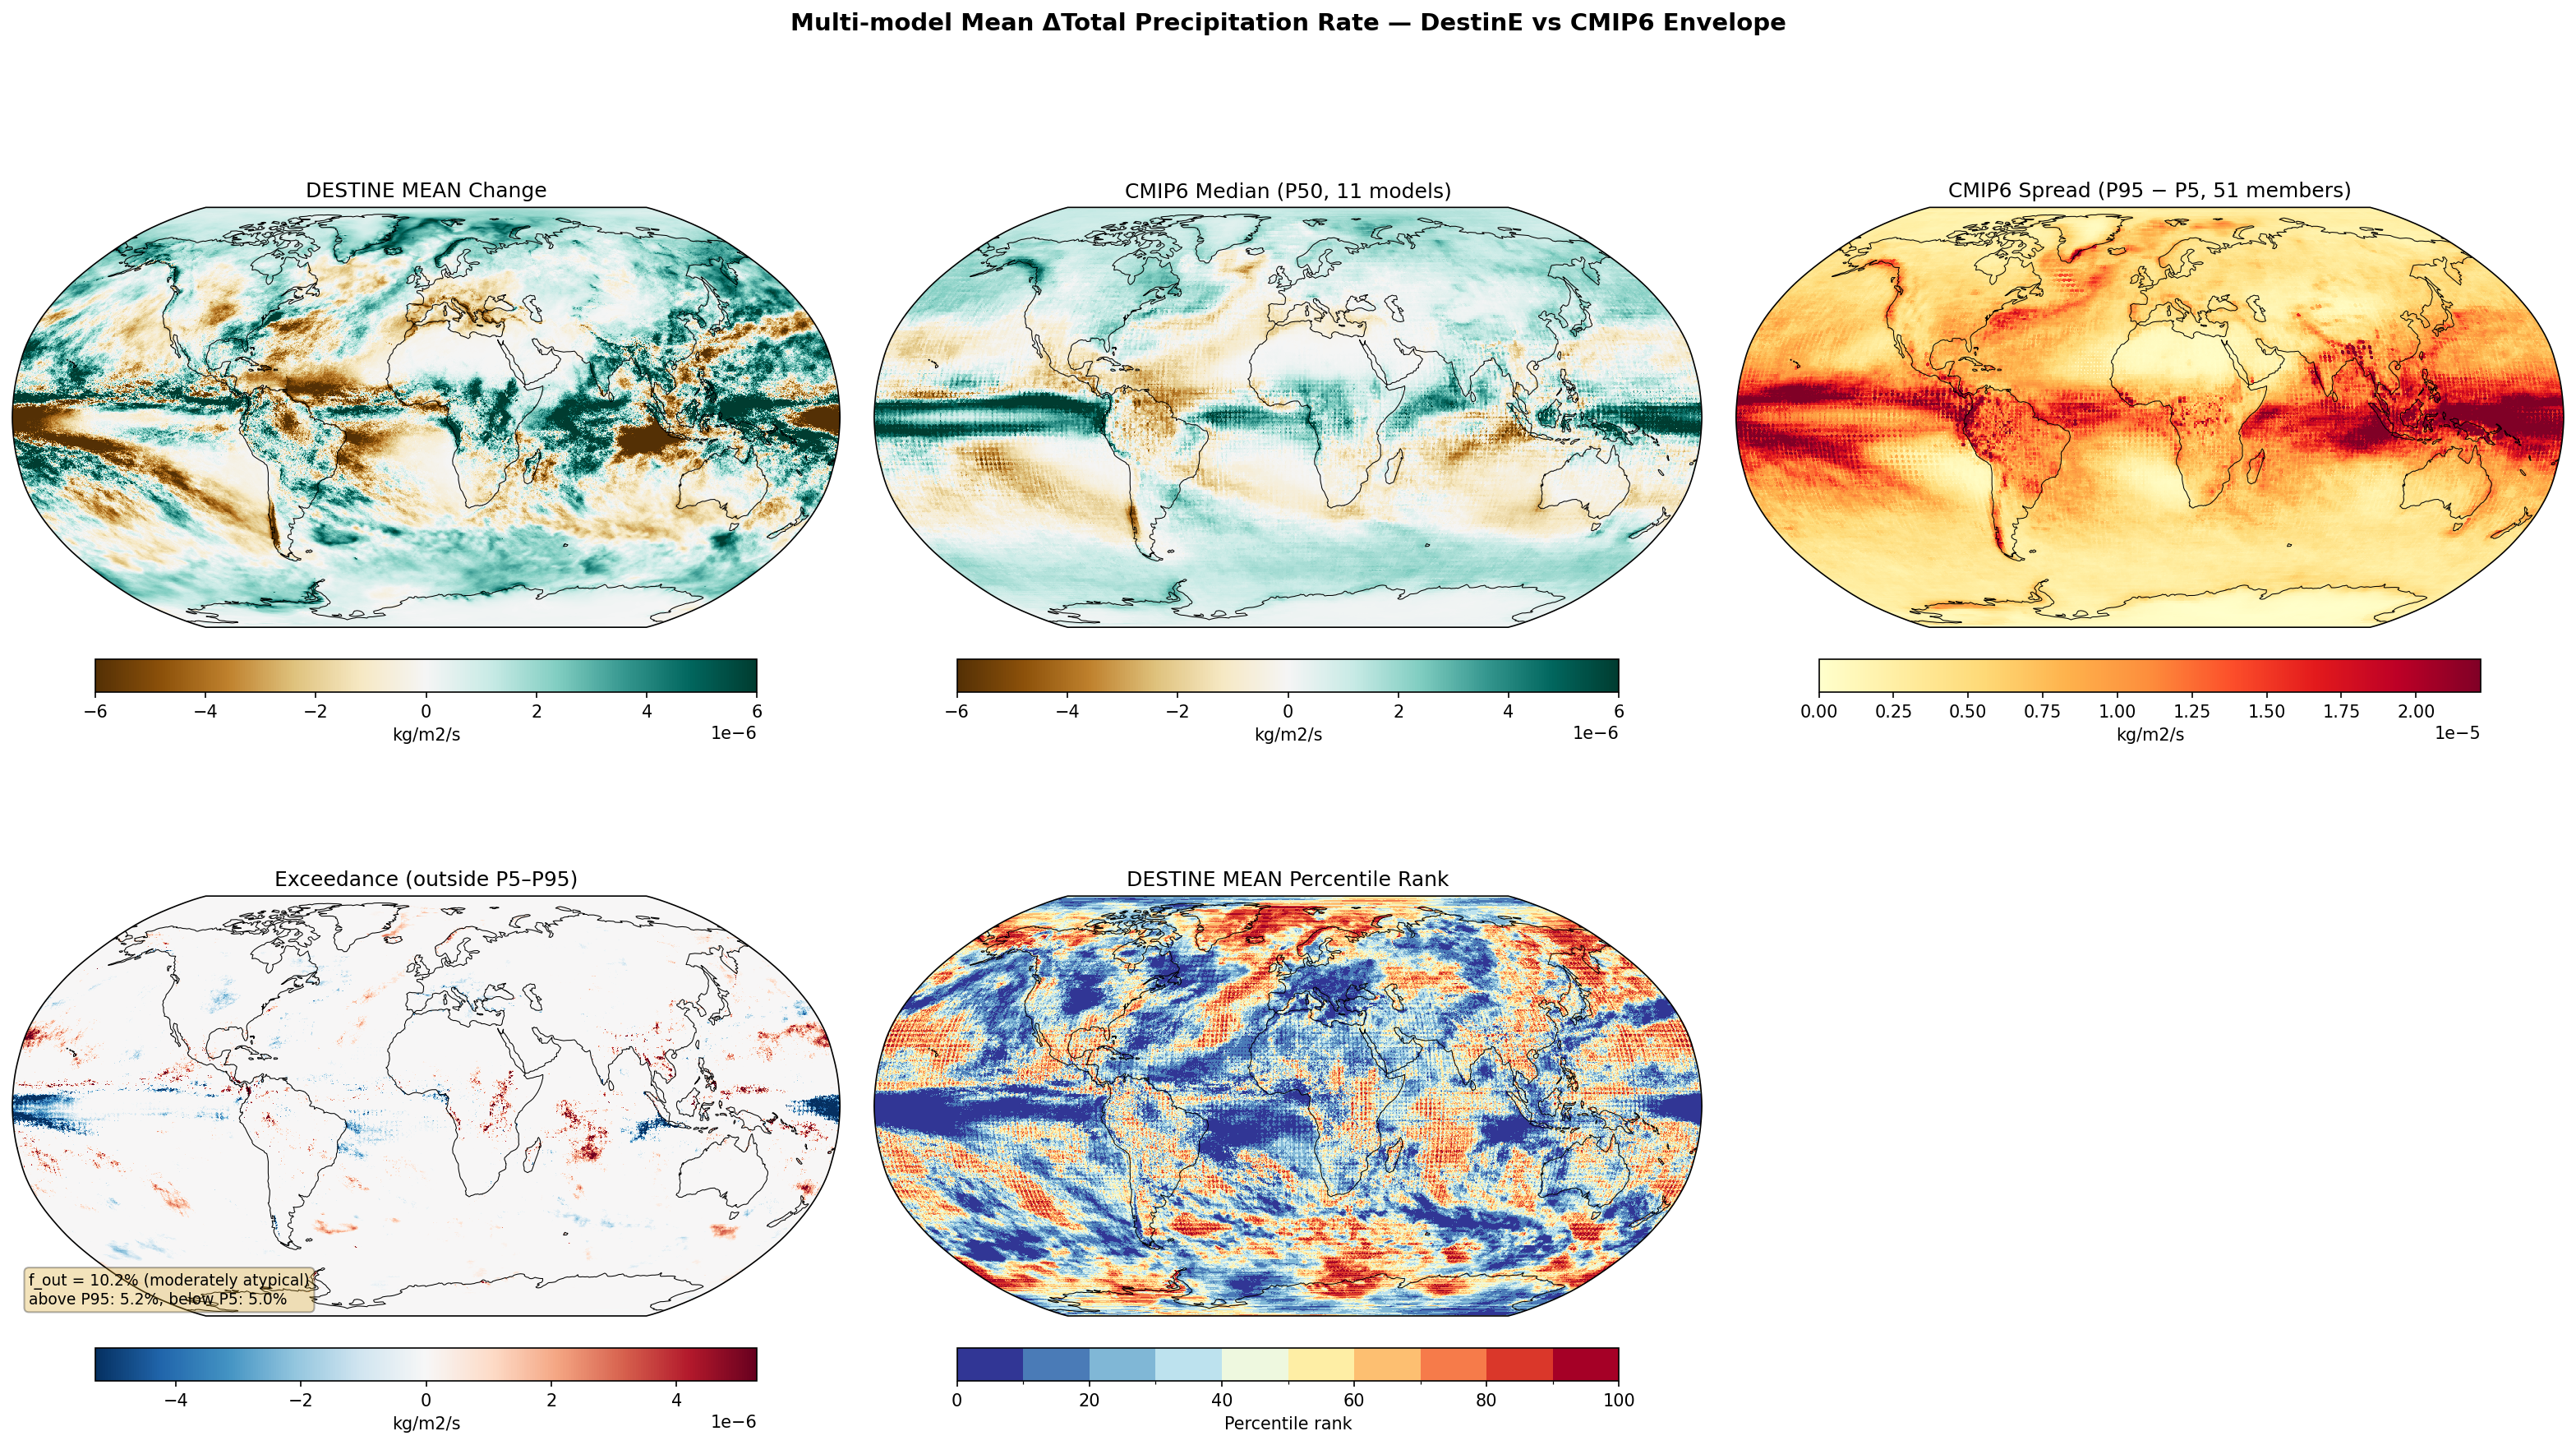
Multi-model Mean Total Precipitation Rate Change — DestinE vs CMIP6 Envelope f_out 10.2%
Envelope Metrics
| f_out (outside P5–P95) | 10.2% moderately atypical |
|---|---|
| Above P95 | 5.2% |
| Below P5 | 5.0% |
| CMIP6 ensemble | 11 models, 51 members |
| Variables | avg_tprate |
|---|---|
| Models | ifs-fesom, ifs-nemo |
| Units | kg/m2/s |
| Baseline | 1990-2014 |
| Future | 2040-2049 |
| Method | DestinE multi-model mean of per-model (future − historical) differences compared to CMIP6 percentile envelope (P5, P50, P95). |
Summary medium
DestinE multi-model mean precipitation changes for 2040–2049 show broad consistency with the CMIP6 ensemble regarding high-latitude wetting and subtropical drying, but exhibit sharper spatial gradients typical of high-resolution simulations. With 10.2% of the global area falling outside the CMIP6 P5–P95 envelope, the result is classified as moderately atypical, primarily driven by intensified tropical convergence zones and specific regional dynamical shifts.
Key Findings
- Global Hydrological Cycle: Both DestinE and CMIP6 exhibit robust 'wet-get-wetter, dry-get-drier' patterns, with intensified precipitation in the ITCZ and high latitudes, and drying in the subtropics (Mediterranean, Amazon).
- Tropical Narrowing: DestinE shows a distinctive pattern in the tropics where precipitation is significantly lower than the CMIP6 P5 threshold on the flanks of the ITCZ/SPCZ, suggesting a narrowing and intensification of rain bands better resolved at high resolution.
- North Atlantic Anomaly: A notable region of precipitation reduction (falling below the CMIP6 P5 lower bound) is observed in the North Atlantic Gulf Stream extension region, likely linked to differences in western boundary current dynamics.
- Amazon Drying: DestinE projects severe drying over the Amazon basin, locally exceeding the drying spread of the CMIP6 ensemble (below P5).
Spatial Patterns
The spatial structure is dominated by zonal bands of wetting (equatorial, high latitudes) and drying (subtropics). DestinE fields contain much finer granular structure than the smooth CMIP6 median. Exceedance (f_out) is concentrated in the Tropical Pacific (blue/dry exceedance), North Atlantic (blue/dry exceedance), and scattered Southern Ocean regions (red/wet exceedance).
Model Agreement
Overall agreement is moderate (f_out = 10.2% is within the 5–15% 'moderately atypical' range). DestinE generally aligns with the CMIP6 median sign in broad continental regions (e.g., Europe, North America) but diverges in gradients over oceans. The percentile rank map shows DestinE frequently occupying the extreme tails (0 or 100) in regions of high dynamical activity, indicating that while the sign is often consistent, the magnitude or precise location of gradients differs from the coarser CMIP6 mean.
Physical Interpretation
The deviations are likely driven by resolution-dependent processes. High-resolution models (DestinE) resolve mesoscale convective systems and sharp SST gradients (e.g., Gulf Stream) that anchor precipitation, leading to narrower and more intense features than the parameterized convection in coarser CMIP6 models. The narrowing of the ITCZ is a known response to improved resolution, reducing the 'double ITCZ' bias common in CMIP6.
Caveats
- Internal Variability: Precipitation is highly variable; a 10-year mean (2040–2049) may still contain significant internal noise compared to the large CMIP6 ensemble, potentially inflating exceedance.
- Ensemble Size: The DestinE signal is a mean of only two models (IFS-FESOM, IFS-NEMO), whereas the CMIP6 envelope is derived from 51 members, making the comparison sensitive to specific structural biases in the IFS family.
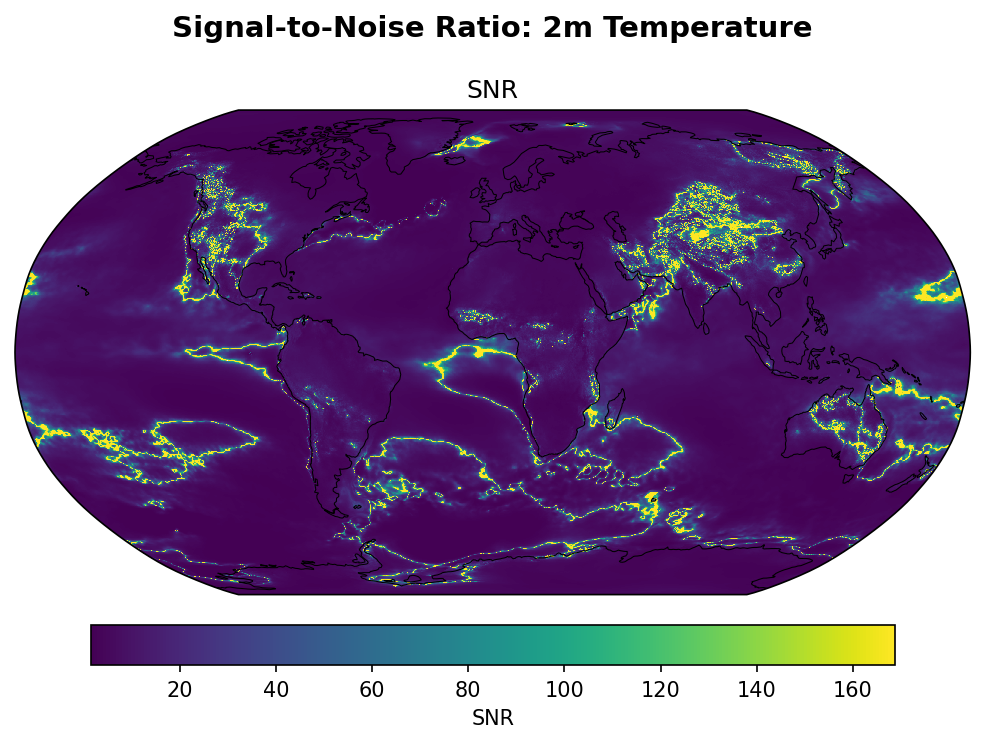
SNR 2m Temperature
| Variables | avg_2t |
|---|---|
| Models | ifs-fesom, ifs-nemo |
| Units | K |
| Baseline | 1990-2014 |
| Future | 2040-2049 |
| Method | SNR = |multi-model mean| / inter-model std. |
Summary high
This figure displays the Signal-to-Noise Ratio (SNR) of 2m temperature change (2040-2049 vs 1990-2014) derived from the two DestinE models (IFS-FESOM and IFS-NEMO). The map is dominated by extremely high SNR values (up to 160+), reflecting the strong structural similarity between the models (which share the IFS atmospheric component), particularly over land and topography.
Key Findings
- Extremely high agreement (SNR > 100) is observed over complex topography, including the Tibetan Plateau, the Andes, and the Rockies, where the shared atmospheric physics (lapse rate, snow albedo) dictates the response.
- Oceanic regions generally show much lower SNR (dark purple, < 40) compared to land, indicating that the different ocean components (NEMO vs FESOM) introduce greater variability in the Sea Surface Temperature (SST) response.
- Localized high-SNR features are visible along sea-ice margins (e.g., Southern Ocean) and specific coastal upwelling zones, suggesting regions where atmospheric forcing strongly constrains the surface changes despite different ocean physics.
Spatial Patterns
The spatial distribution is sharply divided between land/cryosphere (very high SNR) and open ocean (lower SNR). Prominent high-SNR features include the Himalayas/Tibetan Plateau, the Andes, the Australian interior, and margins of the Antarctic continent. The open oceans are largely dark (lower SNR), though distinct high-SNR patches occur in the tropical Pacific and along western boundary currents.
Model Agreement
The agreement between IFS-FESOM and IFS-NEMO is exceptionally high, with 'noise' (inter-model spread) being negligible over land. This is expected as they act as 'structural twins' in the atmosphere. Divergence is primarily restricted to the open ocean where the unstructured FESOM grid and structured NEMO grid produce different circulation and mixing responses.
Physical Interpretation
The pattern confirms that surface temperature change over land is primarily driven by atmospheric processes (radiation, turbulence, albedo) which are identical in both models. Over the ocean, the SST response is a coupled phenomenon; the use of distinct ocean models leads to differences in heat uptake and transport, increasing the 'noise' and lowering the SNR relative to the land.
Caveats
- The SNR is calculated from only two structurally similar models, leading to inflated values compared to a standard multi-model ensemble (like CMIP6, where SNR for temperature is typically < 5).
- The color scale (0-160) is skewed by the extreme agreement over land, potentially obscuring robust but lower-magnitude agreement (e.g., SNR ~5-10) in the ocean regions.
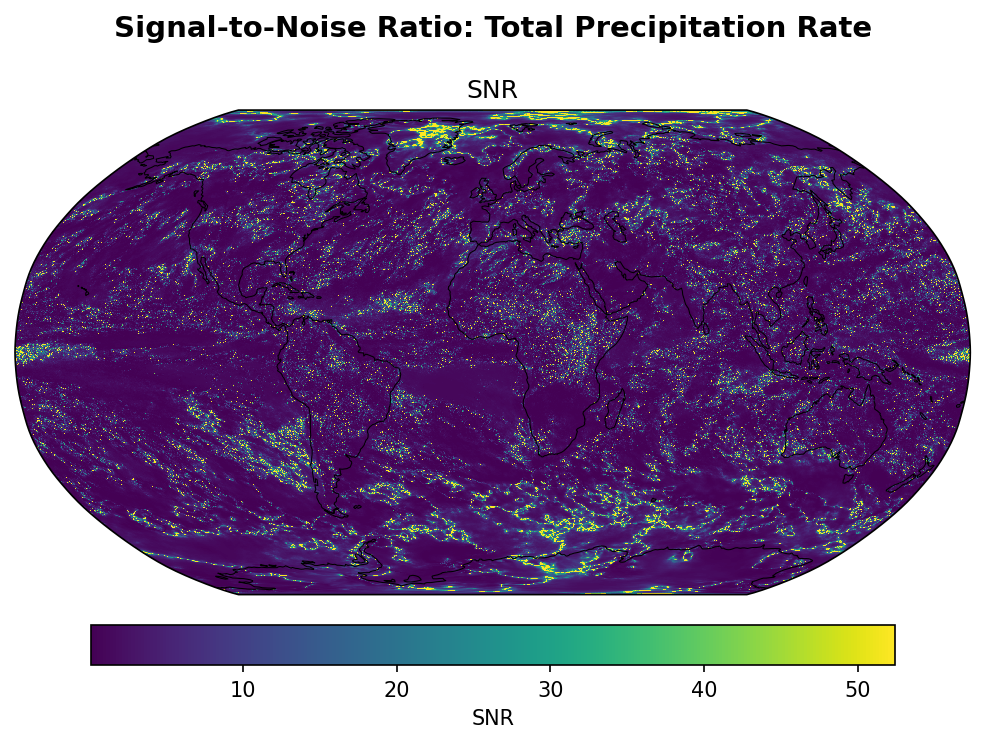
SNR Total Precipitation Rate
| Variables | avg_tprate |
|---|---|
| Models | ifs-fesom, ifs-nemo |
| Units | kg/m2/s |
| Baseline | 1990-2014 |
| Future | 2040-2049 |
| Method | SNR = |multi-model mean| / inter-model std. |
Summary high
This map displays the Signal-to-Noise Ratio (SNR) of Total Precipitation Rate change (2040–2049 vs 1990–2014) derived from the IFS-FESOM and IFS-NEMO high-resolution models, highlighting regions where the climate change signal is robust relative to inter-model variability.
Key Findings
- The majority of the globe exhibits low SNR (dark purple, < 10), indicating that for most grid points, the precipitation change signal is dominated by internal variability or spatial mismatches between the two models.
- High SNR values (> 30, yellow/green) are strongly concentrated along major mountain ranges (e.g., Andes, Himalayas, Rockies) and complex coastlines, demonstrating robust agreement where topography forces vertical motion.
- The map features a 'speckled' texture, particularly over the oceans and tropics, likely resulting from the small ensemble size (N=2) where stochastic overlap of convective features creates high SNR at random individual grid points.
Spatial Patterns
The dominant pattern is 'noise' (low SNR) interspersed with topographic 'signals'. Coherent high-SNR structures align perfectly with orographic features (Andes, Himalayas, Southern Alps of NZ, Rocky Mountains). High latitudes show slightly more widespread moderate signals compared to the tropics, but the overall field is highly fragmented.
Model Agreement
The two models (IFS-FESOM and IFS-NEMO) show high disagreement (low SNR) on the precise location of precipitation changes over flat terrain and open ocean, characteristic of chaotic convective/synoptic systems at 5 km resolution. Agreement is strong only where fixed boundary conditions (topography) constrain the atmospheric response.
Physical Interpretation
Precipitation change is highly subject to internal climate variability. With both models sharing the same atmospheric physics (IFS) but different oceans, the low SNR over land indicates that unforced internal variability overwhelms the forced climate change signal at the grid scale over a 10-year period. However, orographic precipitation is deterministically forced by the interaction of flow with terrain, leading to consistent changes (and high SNR) in mountainous regions despite the different ocean couplings.
Caveats
- The analysis relies on only two models, making the SNR metric highly volatile; 'speckles' in the open ocean are likely statistical artifacts rather than robust physical signals.
- Pixel-wise SNR at ~5 km resolution imposes a severe 'double penalty' on spatial mismatches, potentially underestimating the agreement in broader regional precipitation statistics.