Tier 2 Ocean vs Atmosphere Attribution
Synthesis
Related diagnostics
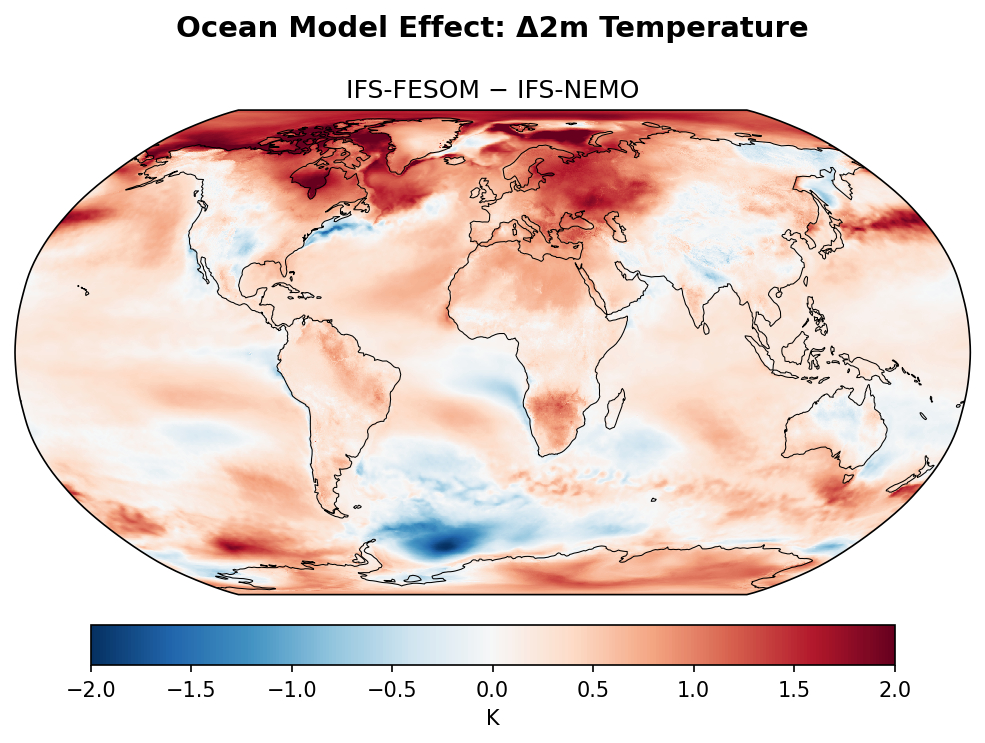
Ocean Model Effect: 2m Temperature
| Variables | avg_2t |
|---|---|
| Models | ifs-fesom, ifs-nemo |
| Units | K |
| Baseline | 1990-2014 |
| Future | 2040-2049 |
| Method | Δvar_FESOM − Δvar_NEMO where Δvar = future_mean − hist_mean. |
Summary high
This figure isolates the impact of the ocean model component by showing the difference in projected 2m temperature change (2040–2049 vs 1990–2014) between IFS-FESOM and IFS-NEMO; it reveals major discrepancies in high-latitude ocean warming.
Key Findings
- IFS-FESOM projects significantly stronger warming (>2.0 K) in the North Atlantic subpolar gyre and Labrador Sea compared to IFS-NEMO.
- Conversely, IFS-FESOM projects reduced warming (<-1.5 K) in the Weddell Sea relative to IFS-NEMO.
- The enhanced North Atlantic heat in IFS-FESOM leads to a widespread warm anomaly (+0.5 to +1.5 K) over Europe and Russia compared to the IFS-NEMO baseline.
Spatial Patterns
The dominant features are dipolar high-latitude ocean anomalies. The North Atlantic and Arctic show broad positive differences (red), indicating IFS-FESOM warms more. The Southern Ocean shows a localized negative difference (blue) in the Weddell Sea. Downstream land impacts are evident, with the Atlantic warmth advecting over the Eurasian continent.
Model Agreement
The two models disagree most strongly in regions of deep water formation, indicating that grid structure (unstructured FESOM vs. structured NEMO) critically affects the stability of overturning circulation. Agreement is better in the tropical oceans, where differences are generally <0.5 K.
Physical Interpretation
The positive anomaly in the North Atlantic suggests IFS-NEMO simulates a stronger AMOC decline (and associated 'warming hole') than IFS-FESOM; FESOM likely sustains stronger convection or northward heat transport. In the Weddell Sea, the negative anomaly implies IFS-FESOM maintains stratification or sea-ice cover more effectively than IFS-NEMO under forcing. The warming over Europe is a direct atmospheric response to the warmer North Atlantic sea surface temperatures in the FESOM configuration.
Caveats
- Results represent a single decade (2040s), so internal multidecadal variability could amplify or dampen structural differences.
- The plot shows relative sensitivity between model formulations, not accuracy against observations.
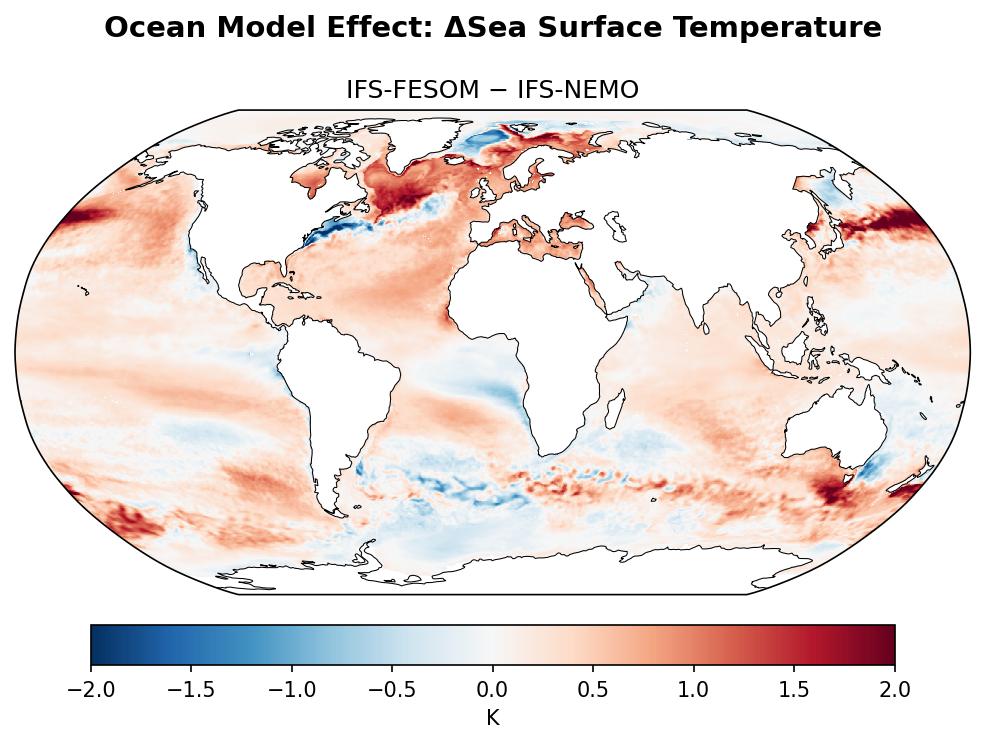
Ocean Model Effect: Sea Surface Temperature
| Variables | avg_tos |
|---|---|
| Models | ifs-fesom, ifs-nemo |
| Units | K |
| Baseline | 1990-2014 |
| Future | 2040-2049 |
| Method | Δvar_FESOM − Δvar_NEMO where Δvar = future_mean − hist_mean. |
Summary high
This figure isolates the contribution of the ocean model component (FESOM vs. NEMO) to projected Sea Surface Temperature (SST) changes under the same atmospheric forcing (IFS), revealing large regional discrepancies particularly in the North Atlantic and western boundary current regions.
Key Findings
- IFS-FESOM projects significantly stronger warming (differences > +1.5 K) in the North Atlantic subpolar gyre and Nordic Seas compared to IFS-NEMO.
- Sharp dipole patterns in the Gulf Stream and Kuroshio Extension regions indicate disagreement on the spatial shift of western boundary currents.
- The Southern Ocean exhibits complex, eddy-scale difference structures, suggesting sensitivity in how the Antarctic Circumpolar Current responds to warming.
Spatial Patterns
The most prominent feature is the large positive anomaly (red) covering the North Atlantic subpolar gyre, contrasted by a narrow negative band (blue) along the Gulf Stream separation path. Similarly, the North Pacific shows a strong positive difference in the Kuroshio Extension. The tropics generally show weaker differences (< 0.5 K), while the Southern Ocean displays zonally-oriented filaments of disagreement.
Model Agreement
Since this compares two components of the DestinE system sharing the same atmosphere, the 'disagreement' isolates structural uncertainty in ocean formulation. The large magnitude (±2 K) implies that ocean model choice is a dominant source of uncertainty for regional projections in the North Atlantic and boundary currents.
Physical Interpretation
The stronger warming in the North Atlantic subpolar gyre in IFS-FESOM suggests it simulates a weaker decline in the Atlantic Meridional Overturning Circulation (AMOC) or more persistent deep convection compared to IFS-NEMO (which likely exhibits a stronger 'warming hole'). The dipoles along the Gulf Stream and Kuroshio imply differences in the latitudinal shift or separation points of these currents under climate change, likely influenced by their differing grid structures (unstructured vs. structured) and resolution of mesoscale eddies.
Caveats
- Differences in internal decadal variability (e.g., AMV, PDO phases) between the two runs could project onto the climate change signal given the relatively short 10-year averaging period.
- Eddy-scale noise is visible in the Southern Ocean, which may not represent a robust forced signal.
Ocean Model Effect: Total Precipitation Rate

| Variables | avg_tprate |
|---|---|
| Models | ifs-fesom, ifs-nemo |
| Units | kg/m2/s |
| Baseline | 1990-2014 |
| Future | 2040-2049 |
| Method | Δvar_FESOM − Δvar_NEMO where Δvar = future_mean − hist_mean. |
Summary high
This diagnostic isolates the 'Ocean Model Effect' by comparing precipitation change projections between IFS-FESOM and IFS-NEMO (sharing the same IFS atmosphere). It reveals substantial structural uncertainty in tropical precipitation responses driven solely by the choice of ocean component.
Key Findings
- The choice of ocean model (FESOM vs. NEMO) drives large differences in projected precipitation change, particularly in the Tropical Pacific and Indian Oceans.
- IFS-FESOM projects significantly drier conditions (or less wetting) along the Equatorial Pacific and Maritime Continent compared to IFS-NEMO.
- Conversely, IFS-FESOM projects enhanced precipitation in the off-equatorial ITCZ and SPCZ regions relative to IFS-NEMO, suggesting a narrowing or meridional shift of the tropical rain belts.
- A zonal dipole is evident in the Indian Ocean, with FESOM projecting relative wetting in the west and drying in the east (Maritime Continent).
Spatial Patterns
The dominant feature is a strong tropical dipole pattern. In the Pacific, a distinct zonal band of negative difference (brown, FESOM < NEMO) runs along the equator, flanked by positive differences (teal, FESOM > NEMO) in the northern ITCZ and southern SPCZ latitudes. The Indian Ocean shows a west-wet/east-dry difference pattern. Mid-latitude differences are smaller but include wave-like structures in the Southern Ocean.
Model Agreement
Internal model agreement is low in the tropics; the magnitude of the difference (~1.5e-5 kg/m2/s or ~1.3 mm/day) is comparable to the total climate change signal in these regions, highlighting high sensitivity to ocean numerics/grid.
Physical Interpretation
The patterns strongly suggest differences in the simulation of Equatorial Pacific SST dynamics (e.g., the 'cold tongue' evolution). The equatorial drying/off-equatorial wetting in FESOM relative to NEMO implies that FESOM may simulate a stronger preservation of the equatorial cold tongue (suppressing local convection) or that NEMO warms the equator more aggressively. Differences in grid structure (unstructured FESOM vs. tripolar NEMO) likely affect the resolution of equatorial upwelling and boundary currents, altering the heat budget and subsequent Walker/Hadley circulation responses.
Caveats
- The 10-year averaging period (2040-2049) may contain residual internal variability (e.g., different ENSO phasing) that projects onto the mean state difference.
- Without observational ground truth for the future, it is unclear which ocean model provides the more plausible response.