Tier 2 Precipitation Concentration Index CMIP6
CMIP6 Multi-Model Mean Context
Comparison with CMIP6 conventional-resolution ensemble mean (up to 8 models under SSP3-7.0, regridded to 0.25°).
Contributing models: MPI-ESM1-2-LR, GISS-E2-1-G, IPSL-CM6A-LR, ACCESS-ESM1-5, EC-Earth3, CNRM-CM6-1, AWI-CM-1-1-MR, CNRM-ESM2-1, FGOALS-g3, INM-CM5-0, MRI-ESM2-0
Synthesis
Related diagnostics
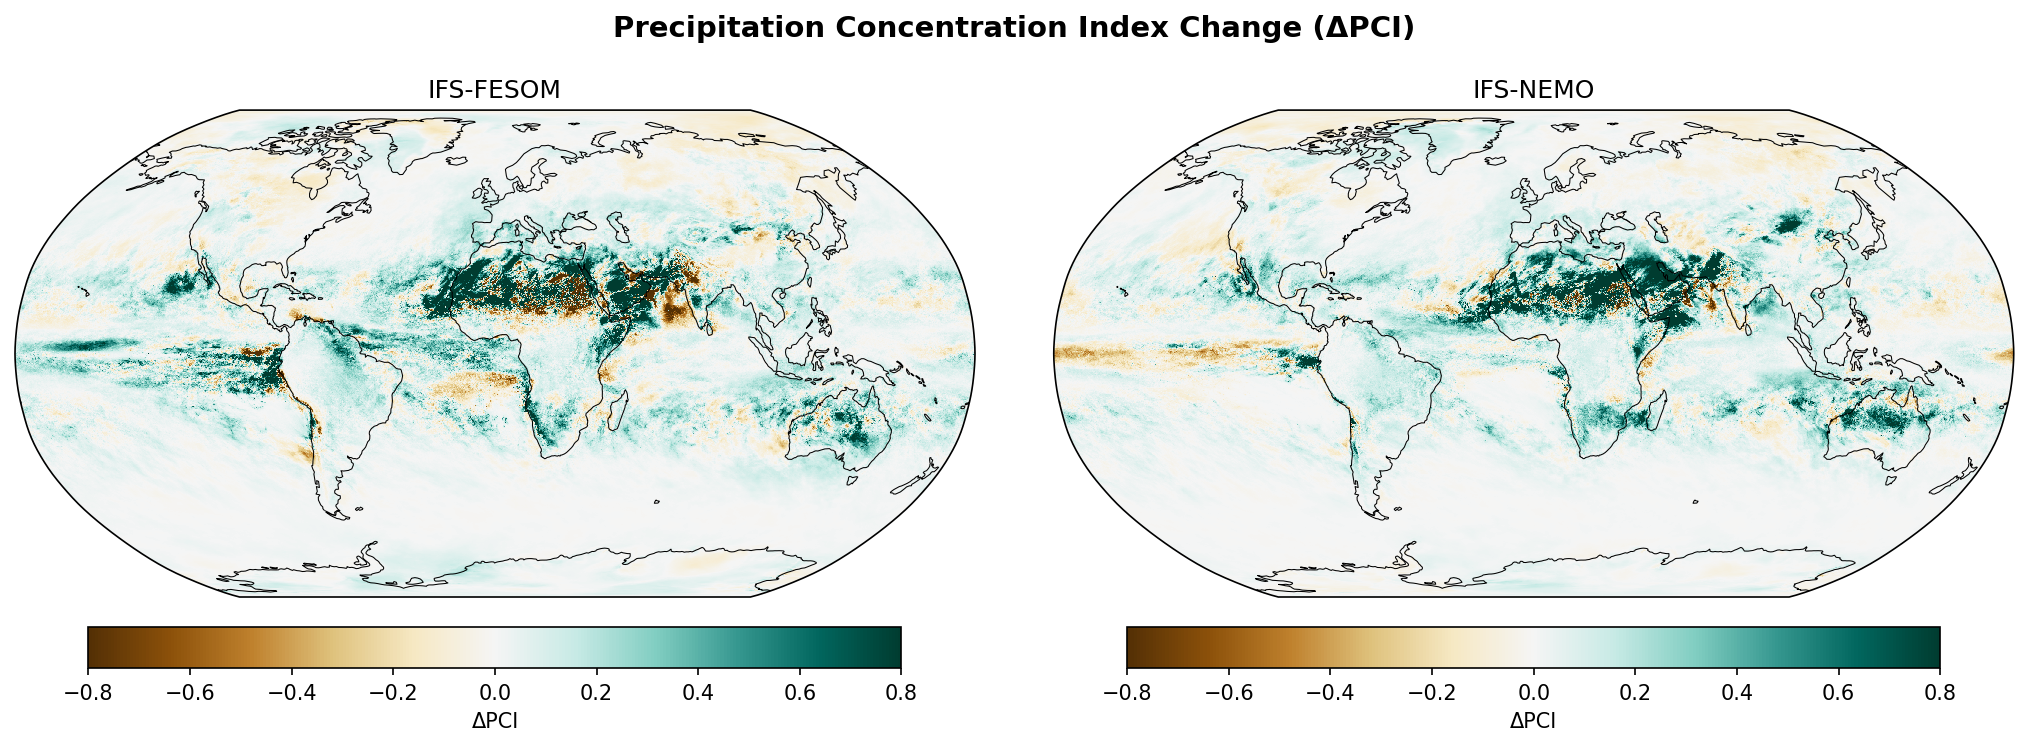
Precipitation Concentration Index Change
| Variables | avg_tprate |
|---|---|
| Models | ifs-fesom, ifs-nemo, CMIP6-MMM |
| Units | kg/m2/s |
| Baseline | 1990-2014 |
| Future | 2040-2049 |
| Method | PCI = 12 × Σ(P_i²) / (ΣP_i)² from climatological monthly means. PCI=1 = uniform; PCI>1 = concentrated. |
Summary medium
This figure illustrates the projected change in Precipitation Concentration Index (PCI) for the 2040–2049 period relative to 1990–2014, comparing two high-resolution DestinE models (IFS-FESOM, IFS-NEMO) against the CMIP6 multi-model mean. While all models indicate a general global trend towards increased precipitation seasonality (green), significant regional discrepancies exist, particularly over North Africa and the Arabian Peninsula where IFS-NEMO predicts a drastic increase in concentration unlike IFS-FESOM.
Key Findings
- A widespread positive ΔPCI signal (green) across the tropics and subtropics indicates that precipitation is projected to become more concentrated in fewer months (intensified seasonality).
- IFS-NEMO shows a much stronger and more spatially coherent increase in precipitation concentration over North Africa, the Middle East, and Central Asia compared to both IFS-FESOM and the CMIP6 mean.
- IFS-FESOM exhibits a distinct pattern over the Sahara and Arabian Peninsula, showing areas of decreased concentration (brown) where IFS-NEMO shows strong increases.
- Both high-resolution models resolve fine-scale filament structures in the ITCZ and storm tracks that are absent in the smoothed CMIP6-MMM.
Spatial Patterns
The dominant signal is an increase in PCI (green) over land monsoon regions (Sahel, South Asia) and the tropical oceans. IFS-NEMO displays a particularly intense band of increased concentration stretching from West Africa to Central Asia. In contrast, IFS-FESOM shows a complex dipole pattern in the Sahara/Arabian desert with both strong positive and negative changes. The tropical Pacific shows zonal banding in the high-resolution models, reflecting ITCZ shifts or narrowing.
Model Agreement
All models agree on the sign of change (positive/green) over the South Asian monsoon region, indicating intensified wet seasons. There is significant disagreement over North Africa and the Arabian Peninsula: IFS-NEMO agrees with the sign of CMIP6 (positive) but exceeds its magnitude, while IFS-FESOM diverges with negative anomalies in these arid regions. The CMIP6 mean is notably smoother and lacks the sharp gradients seen in the DestinE simulations.
Physical Interpretation
The broad increase in PCI is consistent with the thermodynamic intensification of the hydrological cycle, where wet seasons become wetter and dry seasons drier. In monsoon regions, this manifests as a sharper seasonal peak. The discrepancy in arid regions (Sahara/Arabia) between IFS-FESOM and IFS-NEMO likely stems from differences in how rare rainfall events are handled; in hyper-arid zones, PCI is sensitive to whether trace precipitation is spread out (decreasing PCI) or concentrated in rare convective bursts (increasing PCI).
Caveats
- PCI calculations in hyper-arid regions (e.g., Sahara) can be numerically unstable, where small absolute changes in rainfall timing cause large index fluctuations.
- The analysis is based on a relatively short 10-year future window (2040–2049), meaning internal decadal variability may influence the fine-scale patterns compared to the forced climate response.