Tier 2 Dewpoint Depression Change CMIP6 f_out 24.7%
CMIP6 Envelope Comparison
DestinE anomalies compared to the CMIP6 P5–P95 percentile envelope derived from 43 ensemble members across 10 models under SSP3-7.0.
Contributing models: AWI-CM-1-1-MR, CESM2, CNRM-CM6-1, EC-Earth3, MIROC6, MPI-ESM1-2-LR, UKESM1-0-LL
Outside CMIP6 does not mean wrong — it indicates an uncommon response within the CMIP6 distribution.
Dewpoint Depression Change
| Variables | avg_2t, avg_2d |
|---|---|
| Models | ifs-fesom, ifs-nemo, CMIP6-MMM |
| Units | K |
| Baseline | 1990-2014 |
| Future | 2040-2049 |
| Method | ΔDPD = (T_fut − Td_fut) − (T_hist − Td_hist). |
Summary high
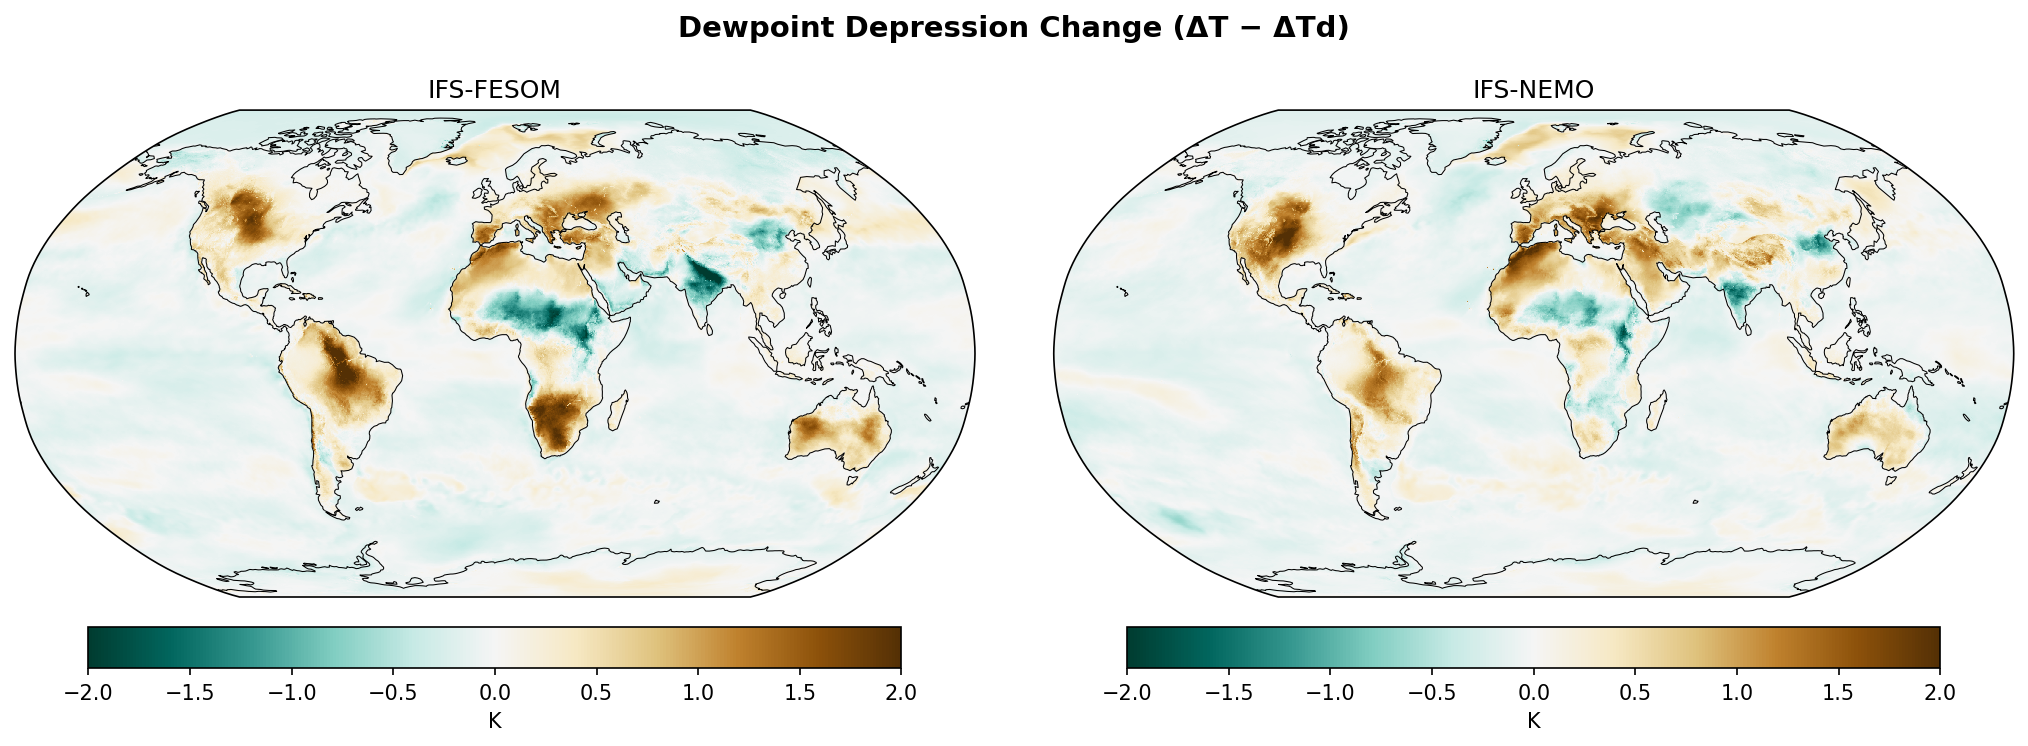
This figure illustrates the projected change in dewpoint depression (DPD) for the 2040–2049 period relative to the baseline, comparing two high-resolution DestinE models (IFS-FESOM, IFS-NEMO) against the CMIP6 multi-model mean. The models show broad consensus on continental drying (increased DPD) in the subtropics and mid-latitudes, contrasted by specific regions of moistening (decreased DPD) in monsoon zones.
Key Findings
- Widespread increase in dewpoint depression (drying) over land masses, particularly in the Amazon, Southern Africa, the Mediterranean, Western North America, and Australia.
- Distinct regions of decreased dewpoint depression (moistening) in the Sahel, Central Africa, and India, indicating localized increases in relative humidity likely driven by intensified monsoon circulation.
- High structural agreement between IFS-FESOM and IFS-NEMO, both exhibiting sharper spatial gradients and more granular regional details than the smoother CMIP6 ensemble mean.
- Oceanic regions predominantly show neutral to slightly negative DPD changes (slight moistening relative to saturation), contrasting with the strong land drying signal.
Spatial Patterns
A clear land-sea contrast is evident, with land surfaces generally showing positive anomalies (browning) and oceans showing neutral/negative anomalies (greening). Notable regional features include a sharp dipole in Africa (wet Sahel vs. dry South Africa) and strong drying centered over the Amazon Basin. The IFS models resolve finer-scale features, such as the sharp topographic delineation of moisture changes near the Himalayas and the Andes.
Model Agreement
There is high agreement on the sign of change between DestinE models and CMIP6-MMM across major climatic zones. Both DestinE models capture the 'Sahel greening' and 'Amazon drying' seen in the CMIP6 mean. The IFS models show stronger, more localized signals in some regions (e.g., parts of the Amazon and West Africa) compared to the smoothed ensemble mean.
Physical Interpretation
The pervasive land drying (increased DPD) is driven by the land-sea warming contrast: land surfaces warm faster than the oceans, and without unlimited moisture sources, specific humidity cannot increase fast enough to maintain constant relative humidity, leading to a wider $T-T_d$ gap. The moistening in the Sahel and India runs counter to this thermodynamic trend, suggesting dynamic drivers—specifically, a northward shift or intensification of the ITCZ and monsoon systems bringing increased moisture convergence.
Caveats
- The 10-year averaging period (2040–2049) in the DestinE simulations leaves some internal variability visible (e.g., wave-like patterns in the Southern Ocean) which is smoothed out in the CMIP6 multi-model mean.
- Differences in soil moisture parameterizations between the IFS and the diverse CMIP6 ensemble may influence the magnitude of the land-surface feedback.
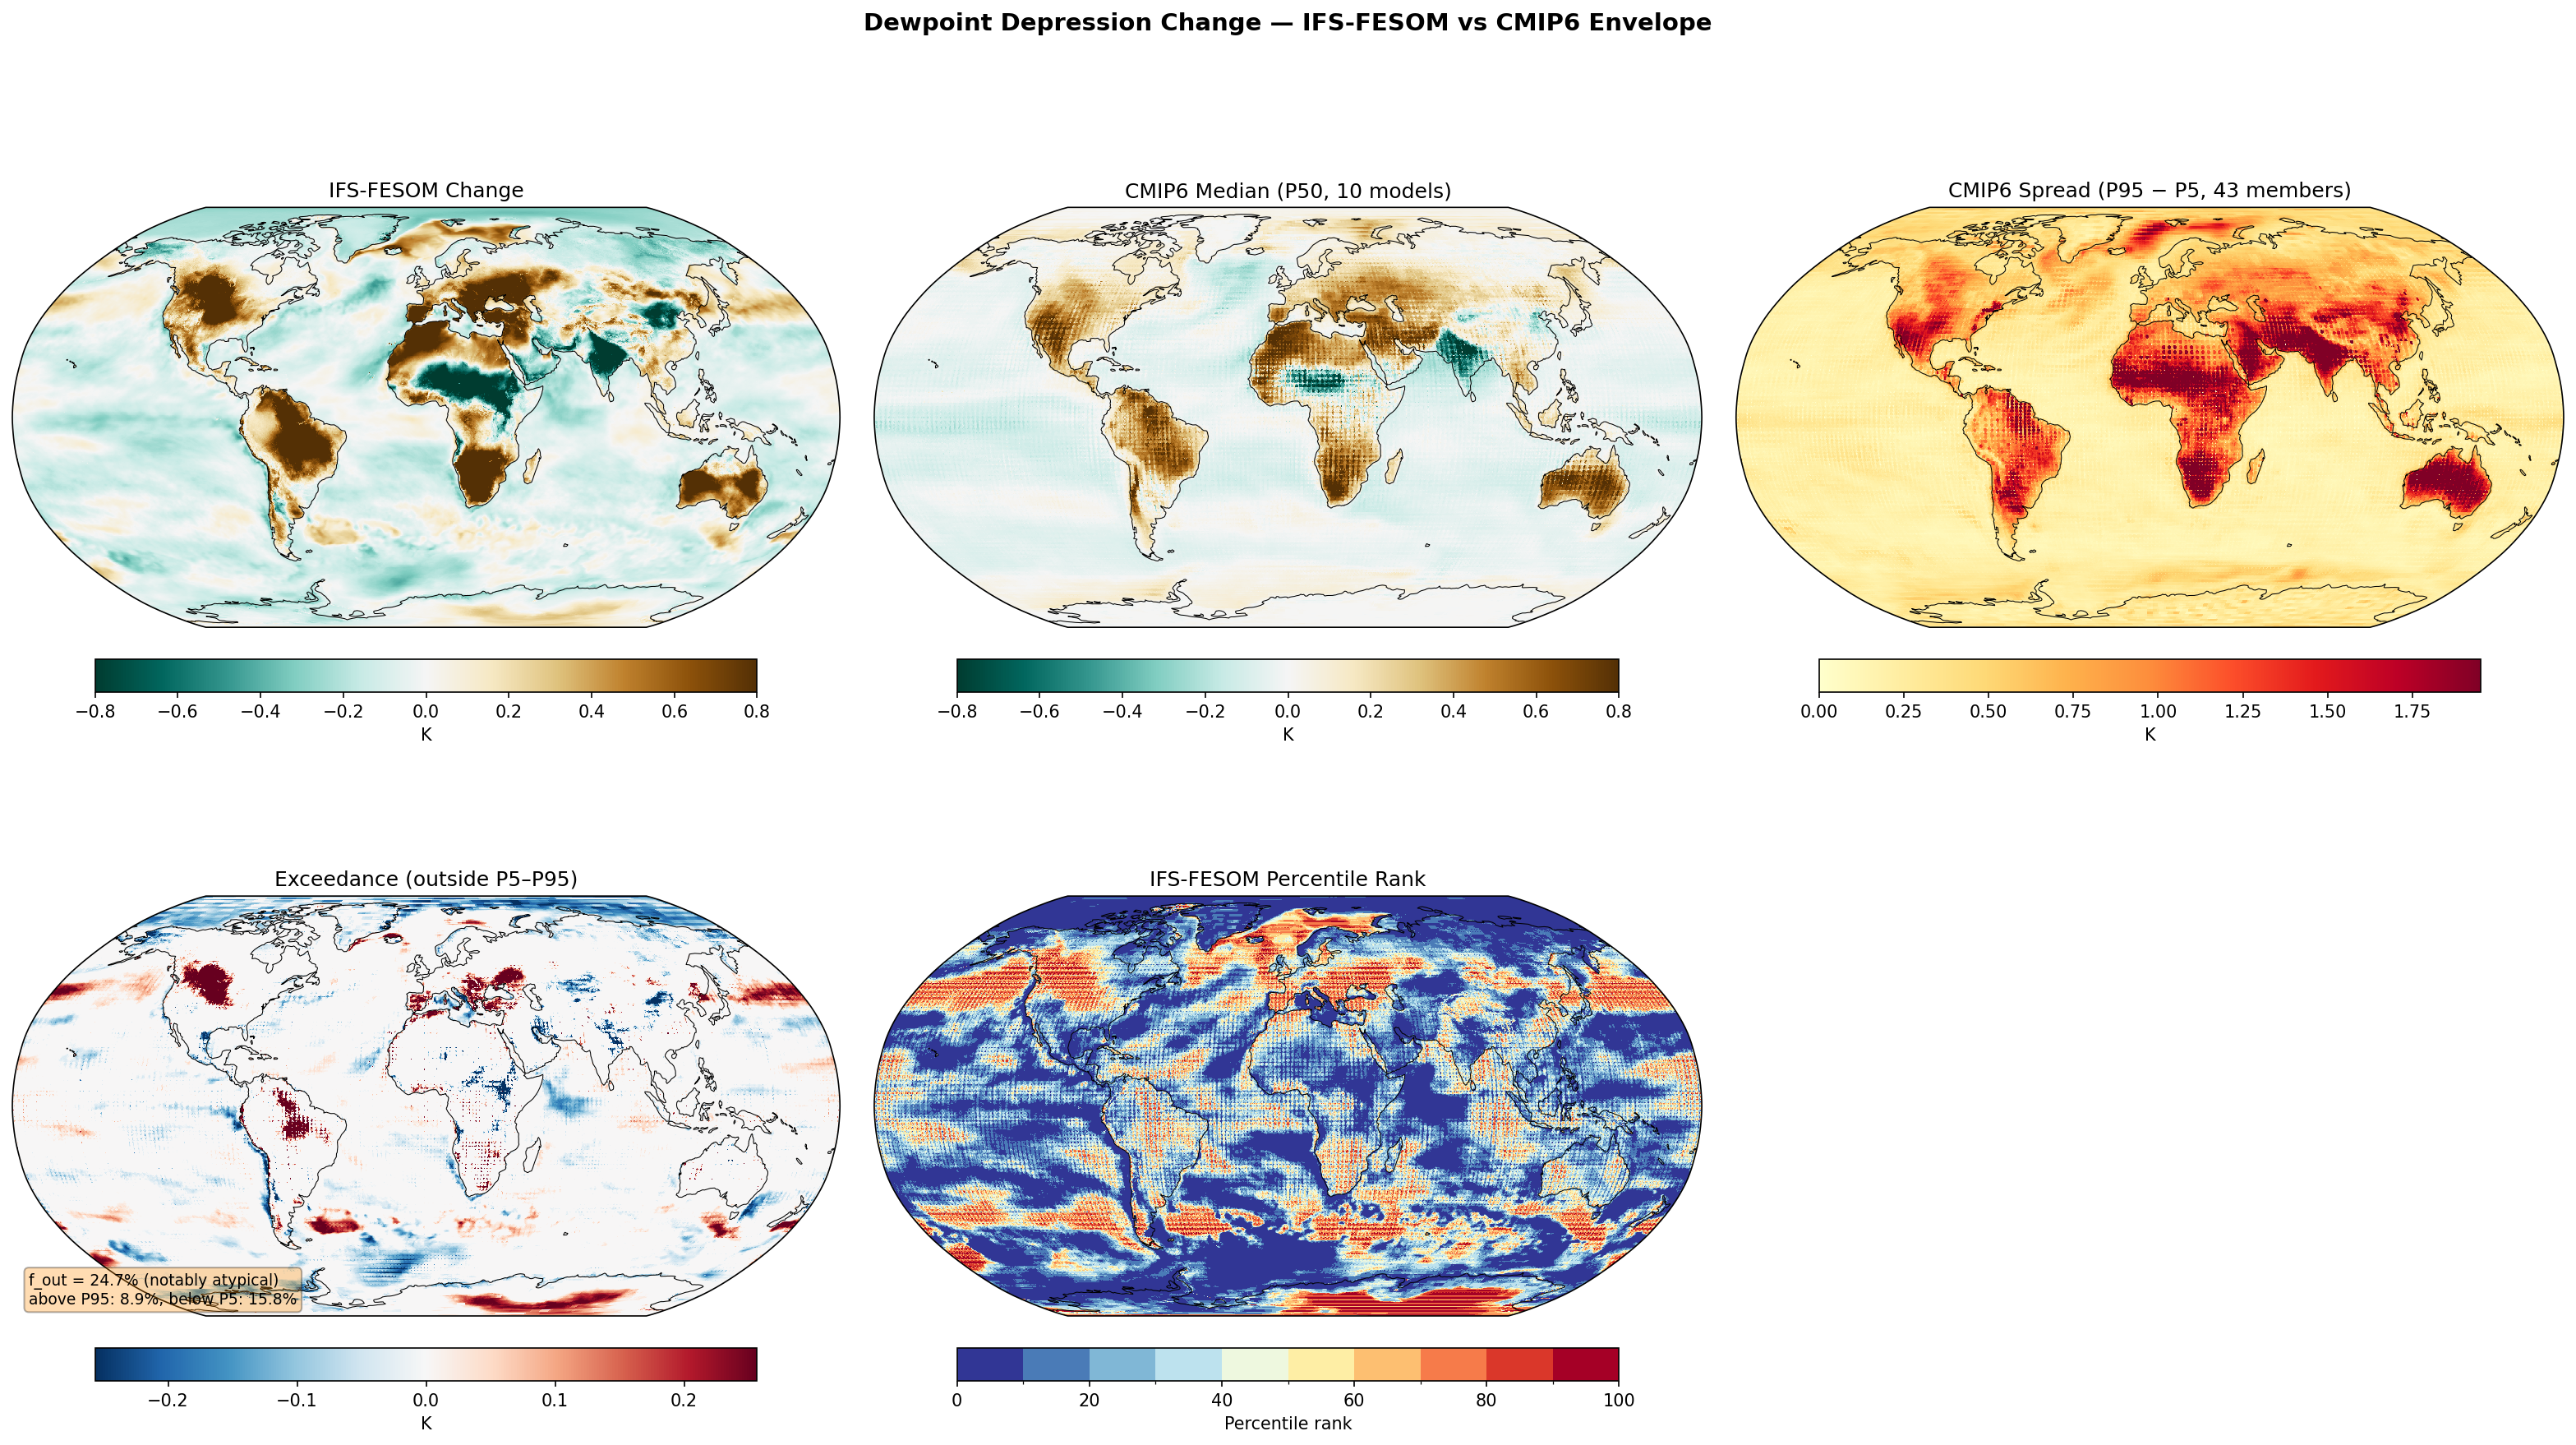
Dewpoint Depression Change — IFS-FESOM vs CMIP6 Envelope f_out 24.7%
Envelope Metrics
| f_out (outside P5–P95) | 24.7% notably atypical |
|---|---|
| Above P95 | 8.9% |
| Below P5 | 15.8% |
| CMIP6 ensemble | 10 models, 43 members |
| Variables | avg_2t, avg_2d |
|---|---|
| Models | ifs-fesom |
| Units | K |
| Baseline | 1990-2014 |
| Future | 2040-2049 |
| Method | ΔDPD = (T_fut − Td_fut) − (T_hist − Td_hist). CMIP6 Td derived from T and RH via Magnus formula. Compared to CMIP6 percentile envelope (P5, P50, P95). |
Summary high
IFS-FESOM displays a notably atypical response ($f_{out}=24.7\%$) in dewpoint depression change, characterized by systematically maintaining higher relative humidity (lower DPD) over global oceans compared to CMIP6, while projecting more intense drying trends over Europe and North America.
Key Findings
- The model is notably atypical ($f_{out} = 24.7\%$), driven primarily by widespread oceanic regions falling below the CMIP6 P5 threshold (15.8% of area), indicating a 'moister' marine boundary layer response than the ensemble.
- IFS-FESOM projects stronger drying (exceeding CMIP6 P95) in parts of Europe and North America, suggesting enhanced land-atmosphere feedbacks in these regions.
- Key hydroclimatic patterns match the CMIP6 median structurally: drying in the Amazon and Mediterranean, and moistening (monsoon intensification) in the Sahel and India.
Spatial Patterns
A sharp land-sea contrast is evident. Land areas generally show increasing DPD (drying), particularly in the Amazon, Southern Africa, and the Mediterranean. Oceans largely show decreasing DPD (moistening relative to saturation). The Sahel and India stand out as land regions with decreasing DPD.
Model Agreement
IFS-FESOM agrees with the CMIP6 median on the location of major drying/moistening zones (e.g., Amazon drying, Sahel wetting). However, it disagrees on magnitude: it is systematically moister (lower DPD) than the ensemble over oceans and drier (higher DPD) than the ensemble over key Northern Hemisphere land masses.
Physical Interpretation
The widespread 'below P5' signal over oceans suggests IFS-FESOM parameterisations maintain a marine boundary layer closer to saturation than most CMIP6 models, or that SST warming is lower. Conversely, the 'above P95' drying over land likely reflects stronger soil-moisture-temperature coupling at 5 km resolution, where depletion of soil moisture leads to larger sensible heat fluxes and higher DPD.
Caveats
- The analysis covers a single decade (2040-2049), so internal variability (e.g., ENSO, IPO) could influence the exceedance patterns, particularly in the Pacific.
- Dewpoint depression conflates temperature and humidity changes; distinguishing purely thermal drying from moisture deficit requires joint analysis with RH or specific humidity.
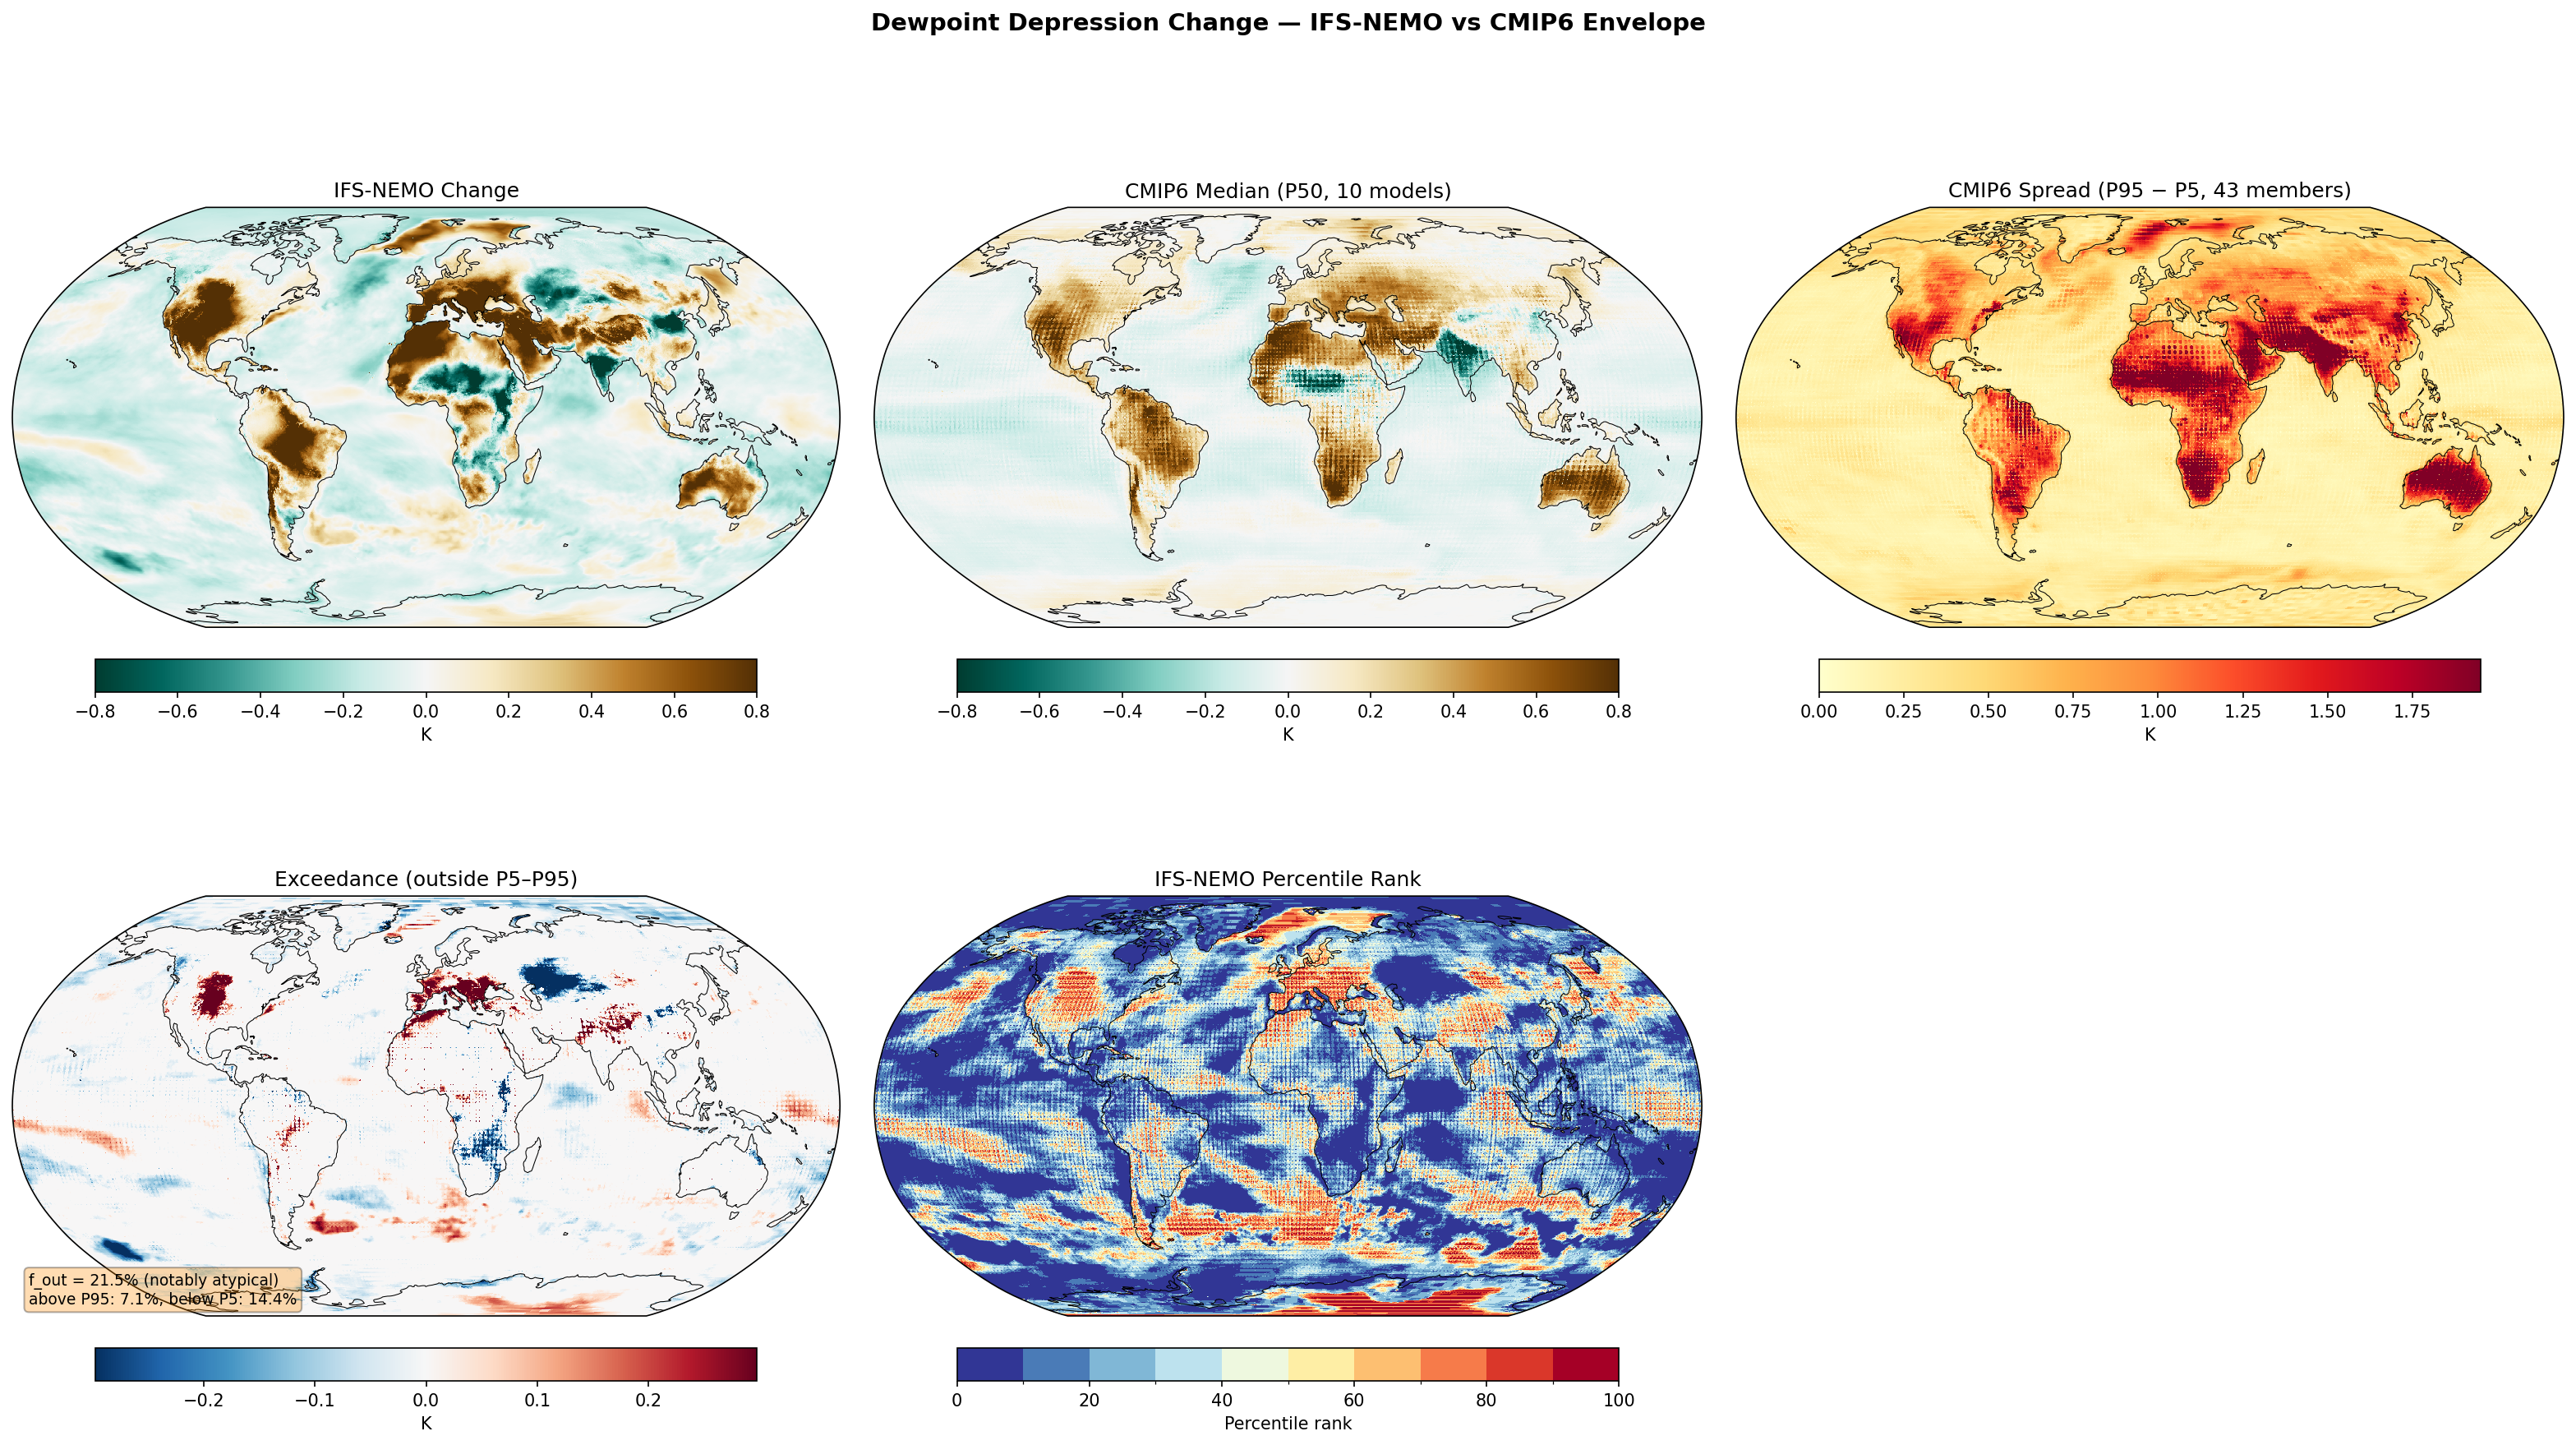
Dewpoint Depression Change — IFS-NEMO vs CMIP6 Envelope f_out 21.5%
Envelope Metrics
| f_out (outside P5–P95) | 21.5% notably atypical |
|---|---|
| Above P95 | 7.1% |
| Below P5 | 14.4% |
| CMIP6 ensemble | 10 models, 43 members |
| Variables | avg_2t, avg_2d |
|---|---|
| Models | ifs-nemo |
| Units | K |
| Baseline | 1990-2014 |
| Future | 2040-2049 |
| Method | ΔDPD = (T_fut − Td_fut) − (T_hist − Td_hist). CMIP6 Td derived from T and RH via Magnus formula. Compared to CMIP6 percentile envelope (P5, P50, P95). |
Summary high
IFS-NEMO projects a classic thermodynamic land-sea contrast with increased dewpoint depression (drying/lower RH) over land and decreases (moistening/higher RH) over oceans, but with notable magnitude differences compared to CMIP6 (f_out = 21.5%).
Key Findings
- IFS-NEMO shows significantly stronger drying (increased DPD) in Western/Central Europe and the Mediterranean compared to the CMIP6 ensemble (exceeding P95).
- The model simulates a more intense wetting signal (decreased DPD) over the Sahel and Central Africa than the CMIP6 range (below P5).
- Globally, IFS-NEMO tends to be 'moister' (lower DPD) than the CMIP6 median over the oceans and high-latitude land areas (Russia/Siberia), indicated by widespread low percentile ranks.
Spatial Patterns
Dominant land drying (browning) is observed over the Amazon, Southern Africa, Australia, and the Mediterranean. Strong moistening (greening) occurs over the Sahel, India, and high-latitude oceans. A distinct dipole exists in Africa (wet Sahel vs dry South).
Model Agreement
While the sign of change broadly agrees with the CMIP6 median (land drying, Sahel wetting), IFS-NEMO is notably atypical (21.5% outside envelope). It is an outlier on the 'wet' side (below P5) for 14.4% of the area, particularly over the Southern Ocean, North Atlantic, and Siberia, and on the 'dry' side (above P95) for 7.1% of the area, mostly in Europe and parts of the Amazon.
Physical Interpretation
The pattern reflects the fundamental land-ocean warming contrast: land warms faster than oceans, leading to relative humidity decreases (DPD increases) despite specific humidity increases. The extreme drying in Europe suggests strong soil-moisture-temperature feedbacks or circulation changes (e.g., blocking) potentially better resolved at high resolution. The intense Sahel wetting suggests a robust intensification or northward shift of the West African Monsoon.
Caveats
- The strong drying signal in Europe may be influenced by decadal variability given the relatively short 10-year integration window.
- High f_out values over oceans suggest systematic differences in marine boundary layer physics or cloud parameterizations compared to standard CMIP6 models.